
|
|||||
|
 | |
| |
| |
| |
| |
| |
|
Gene: CYTIP |
Gene summary for CYTIP |
| Gene information | Species | Human | Gene symbol | CYTIP | Gene ID | 9595 |
| Gene name | cytohesin 1 interacting protein | |
| Gene Alias | B3-1 | |
| Cytomap | 2q24.1 | |
| Gene Type | protein-coding | GO ID | GO:0007155 | UniProtAcc | O60759 |
Top |
Malignant transformation analysis |
| Identification of the aberrant gene expression in precancerous and cancerous lesions by comparing the gene expression of stem-like cells in diseased tissues with normal stem cells |
| Entrez ID | Symbol | Replicates | Species | Organ | Tissue | Adj P-value | Log2FC | Malignancy |
| 9595 | CYTIP | LZE4T | Human | Esophagus | ESCC | 3.04e-04 | 4.56e-01 | 0.0811 |
| 9595 | CYTIP | LZE7T | Human | Esophagus | ESCC | 3.87e-07 | 9.33e-01 | 0.0667 |
| 9595 | CYTIP | LZE6T | Human | Esophagus | ESCC | 6.84e-21 | 1.51e+00 | 0.0845 |
| 9595 | CYTIP | C21 | Human | Oral cavity | OSCC | 2.04e-11 | 4.38e-01 | 0.2678 |
| 9595 | CYTIP | C30 | Human | Oral cavity | OSCC | 4.10e-03 | 2.38e-01 | 0.3055 |
| 9595 | CYTIP | C38 | Human | Oral cavity | OSCC | 1.24e-05 | 9.14e-01 | 0.172 |
| 9595 | CYTIP | C06 | Human | Oral cavity | OSCC | 1.96e-02 | 4.12e-01 | 0.2699 |
| 9595 | CYTIP | C08 | Human | Oral cavity | OSCC | 1.67e-03 | 5.92e-02 | 0.1919 |
| 9595 | CYTIP | C09 | Human | Oral cavity | OSCC | 4.94e-04 | 1.62e-01 | 0.1431 |
| 9595 | CYTIP | LN22 | Human | Oral cavity | OSCC | 6.36e-08 | 9.34e-01 | 0.1733 |
| 9595 | CYTIP | EOLP-1 | Human | Oral cavity | EOLP | 9.17e-12 | 5.59e-01 | -0.0202 |
| 9595 | CYTIP | SYSMH6 | Human | Oral cavity | OSCC | 1.45e-02 | 4.98e-02 | 0.1275 |
| 9595 | CYTIP | 047563_1562-all-cells | Human | Prostate | BPH | 2.20e-11 | 4.24e-01 | 0.0791 |
| 9595 | CYTIP | 052095_1628-all-cells | Human | Prostate | BPH | 2.27e-04 | 1.73e-01 | 0.1032 |
| 9595 | CYTIP | Dong_P1 | Human | Prostate | Tumor | 1.13e-06 | 1.01e-01 | 0.035 |
| 9595 | CYTIP | Dong_P3 | Human | Prostate | Tumor | 2.88e-02 | 7.86e-02 | 0.0278 |
| 9595 | CYTIP | Dong_P5 | Human | Prostate | Tumor | 2.03e-02 | 5.31e-02 | 0.053 |
| 9595 | CYTIP | GSM5353218_PA_PB1B_Pool_1_2_S74_L003 | Human | Prostate | Tumor | 6.49e-08 | 8.07e-01 | 0.1479 |
| 9595 | CYTIP | GSM5353220_PA_PB1B_Pool_3_S51_L002 | Human | Prostate | Tumor | 2.22e-03 | 5.20e-01 | 0.1531 |
| 9595 | CYTIP | GSM5353221_PA_PB2A_Pool_1_3_S25_L001 | Human | Prostate | Tumor | 1.53e-03 | 3.06e-01 | 0.1633 |
| Page: 1 2 |
| Tissue | Expression Dynamics | Abbreviation |
| Esophagus | 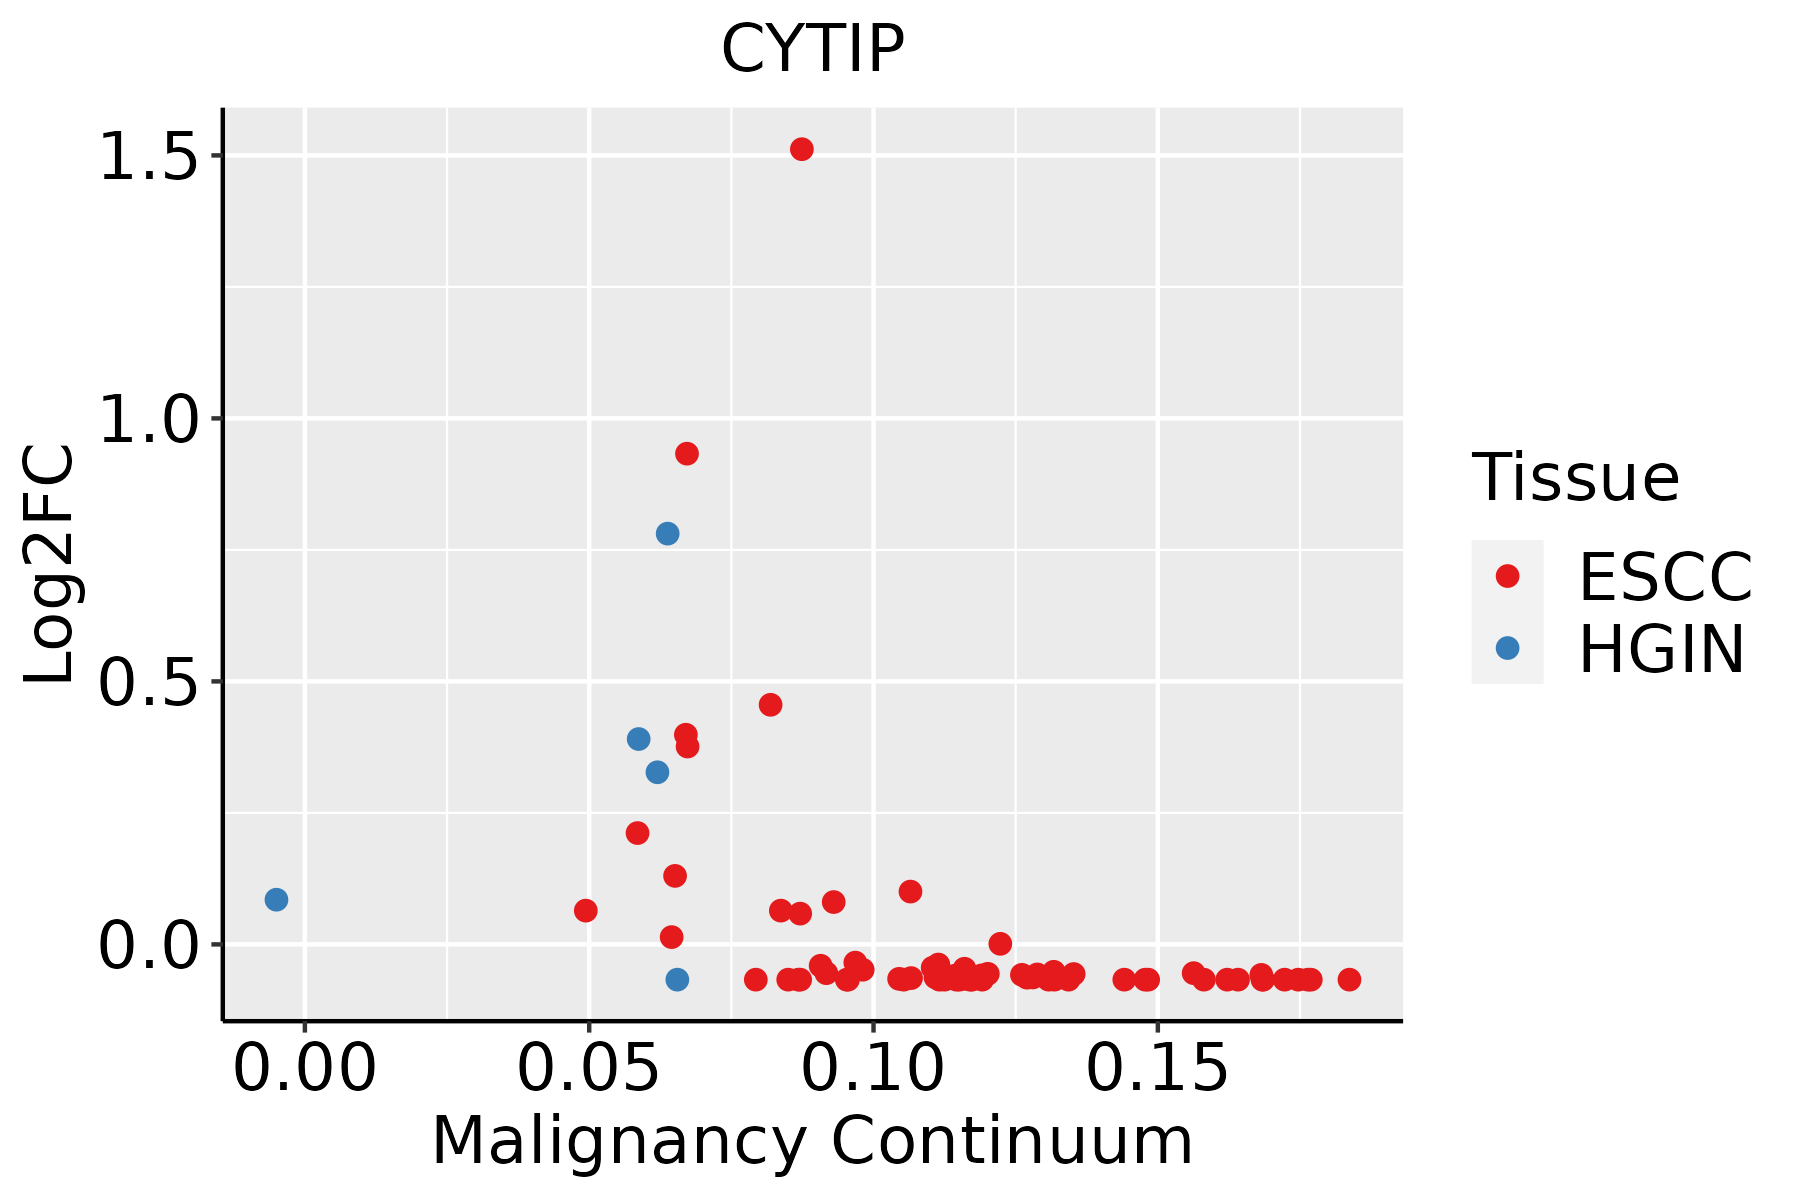 | ESCC: Esophageal squamous cell carcinoma |
| HGIN: High-grade intraepithelial neoplasias | ||
| LGIN: Low-grade intraepithelial neoplasias | ||
| Oral Cavity | 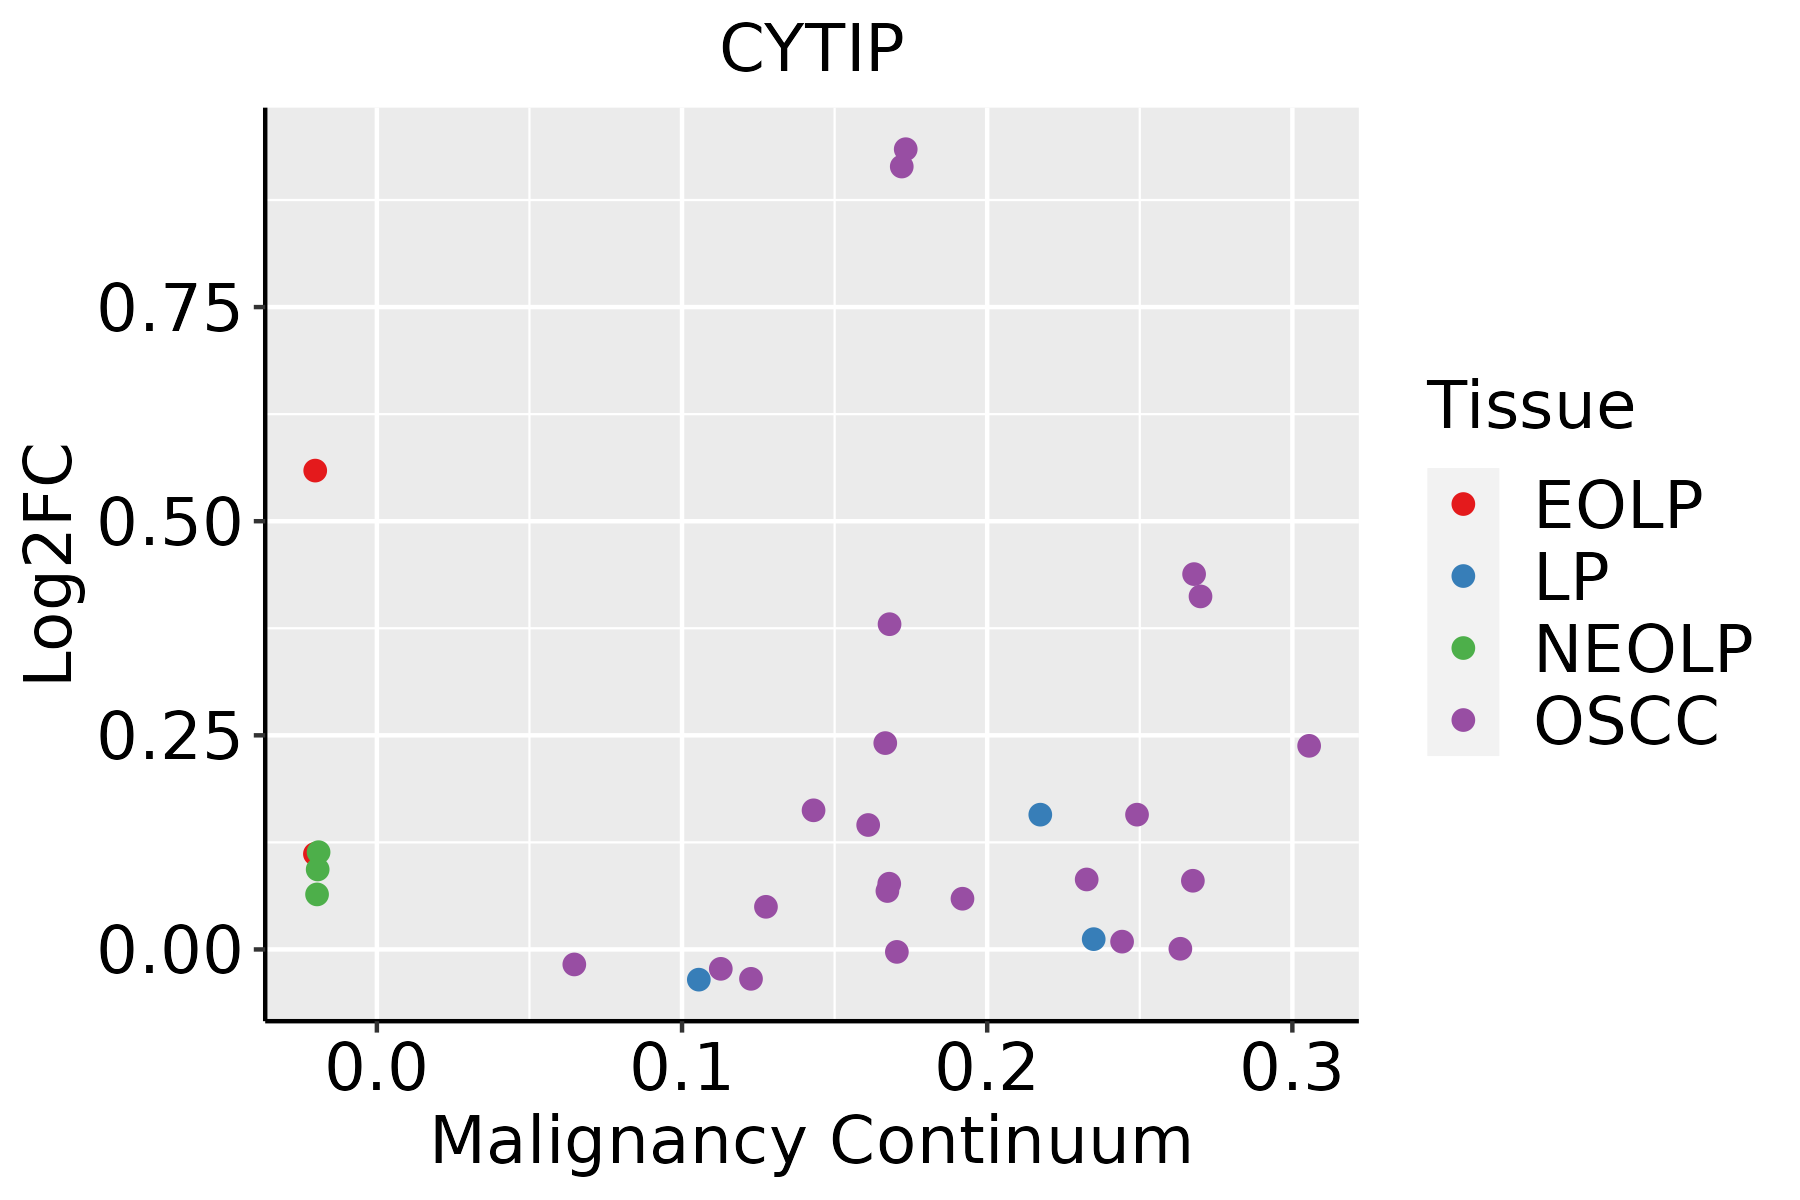 | EOLP: Erosive Oral lichen planus |
| LP: leukoplakia | ||
| NEOLP: Non-erosive oral lichen planus | ||
| OSCC: Oral squamous cell carcinoma | ||
| Prostate | 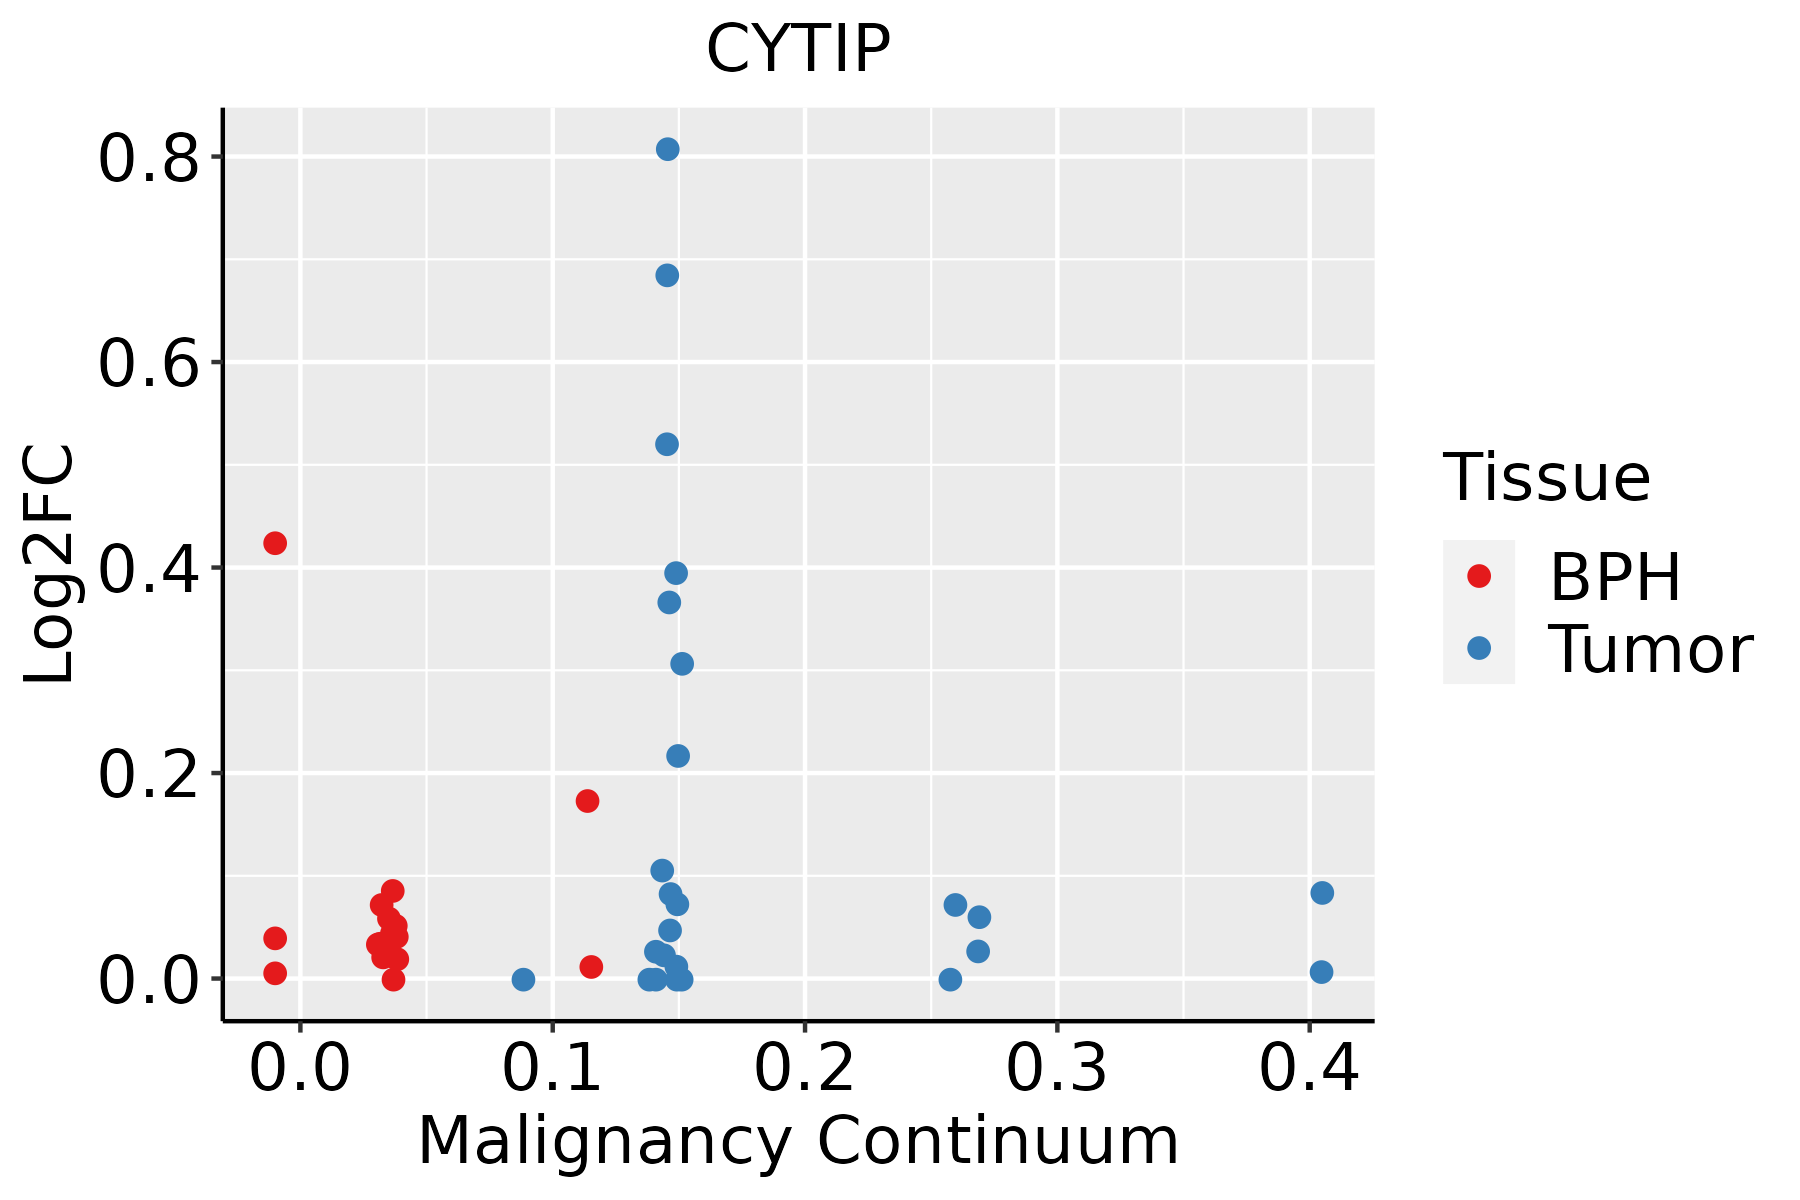 | BPH: Benign Prostatic Hyperplasia |
| ∗log2FC in expression of this searched gene in stem-like cells from each diseased tissue sample relative to stem-like cells in normal samples in each tissue plotted against the malignancy continuum. Samples are colored based on if they are from different disease stage. |
Top |
Malignant transformation related pathway analysis |
| Find out the enriched GO biological processes and KEGG pathways involved in transition from healthy to precancer to cancer |
| Tissue | Disease Stage | Enriched GO biological Processes |
| Colorectum | AD |  |
| Colorectum | SER |  |
| Colorectum | MSS |  |
| Colorectum | MSI-H |  |
| Colorectum | FAP |  |
| ∗Top 15 enriched GO BP terms are showed in the bar plot of each disease state in each tissue. Each row represents a significant GO biological process which is colored according to the -log10(p.adjust). |
| Page: 1 2 3 4 5 6 7 8 9 |
| GO ID | Tissue | Disease Stage | Description | Gene Ratio | Bg Ratio | pvalue | p.adjust | Count |
| Page: 1 |
| Pathway ID | Tissue | Disease Stage | Description | Gene Ratio | Bg Ratio | pvalue | p.adjust | qvalue | Count |
| Page: 1 |
Top |
Cell-cell communication analysis |
| Identification of potential cell-cell interactions between two cell types and their ligand-receptor pairs for different disease states |
| Ligand | Receptor | LRpair | Pathway | Tissue | Disease Stage |
| Page: 1 |
Top |
Single-cell gene regulatory network inference analysis |
| Find out the significant the regulons (TFs) and the target genes of each regulon across cell types for different disease states |
| TF | Cell Type | Tissue | Disease Stage | Target Gene | RSS | Regulon Activity |
| ∗The dot plots of a searched regulon are shown for all cell subpopulations in each disease state of each tissue based on the regulon specific score inferred using pySCENIC and by calculating the average expression. |
| Page: 1 |
Top |
Somatic mutation of malignant transformation related genes |
| Annotation of somatic variants for genes involved in malignant transformation |
| Hugo Symbol | Variant Class | Variant Classification | dbSNP RS | HGVSc | HGVSp | HGVSp Short | SWISSPROT | BIOTYPE | SIFT | PolyPhen | Tumor Sample Barcode | Tissue | Histology | Sex | Age | Stage | Therapy Types | Drugs | Outcome |
| CYTIP | SNV | Missense_Mutation | c.998G>C | p.Arg333Thr | p.R333T | O60759 | protein_coding | deleterious(0) | probably_damaging(0.963) | TCGA-3C-AALI-01 | Breast | breast invasive carcinoma | Female | <65 | I/II | Unspecific | Poly E | Complete Response | |
| CYTIP | SNV | Missense_Mutation | novel | c.483N>C | p.Glu161Asp | p.E161D | O60759 | protein_coding | tolerated(0.13) | probably_damaging(1) | TCGA-A7-A4SE-01 | Breast | breast invasive carcinoma | Female | <65 | I/II | Chemotherapy | adriamycin | CR |
| CYTIP | SNV | Missense_Mutation | c.755N>T | p.Ser252Phe | p.S252F | O60759 | protein_coding | tolerated(0.1) | benign(0.037) | TCGA-E2-A10C-01 | Breast | breast invasive carcinoma | Female | <65 | I/II | Chemotherapy | cytoxan | SD | |
| CYTIP | SNV | Missense_Mutation | c.841N>A | p.Asp281Asn | p.D281N | O60759 | protein_coding | tolerated(0.07) | benign(0.133) | TCGA-EW-A1P3-01 | Breast | breast invasive carcinoma | Female | <65 | I/II | Chemotherapy | fluorouracil | SD | |
| CYTIP | SNV | Missense_Mutation | novel | c.665N>T | p.Ser222Phe | p.S222F | O60759 | protein_coding | tolerated(0.06) | benign(0.021) | TCGA-PL-A8LZ-01 | Breast | breast invasive carcinoma | Female | <65 | III/IV | Chemotherapy | paclitaxel | SD |
| CYTIP | SNV | Missense_Mutation | c.893C>T | p.Ser298Phe | p.S298F | O60759 | protein_coding | deleterious(0.01) | benign(0.211) | TCGA-IR-A3LA-01 | Cervix | cervical & endocervical cancer | Female | <65 | I/II | Chemotherapy | cisplatin | CR | |
| CYTIP | SNV | Missense_Mutation | c.682N>T | p.Pro228Ser | p.P228S | O60759 | protein_coding | tolerated(0.88) | benign(0) | TCGA-AA-3713-01 | Colorectum | colon adenocarcinoma | Male | >=65 | III/IV | Chemotherapy | 5-fluorouracil | PR | |
| CYTIP | SNV | Missense_Mutation | c.526N>A | p.Ala176Thr | p.A176T | O60759 | protein_coding | tolerated(0.88) | benign(0.018) | TCGA-AA-3968-01 | Colorectum | colon adenocarcinoma | Female | <65 | I/II | Unknown | Unknown | SD | |
| CYTIP | SNV | Missense_Mutation | c.526G>A | p.Ala176Thr | p.A176T | O60759 | protein_coding | tolerated(0.88) | benign(0.018) | TCGA-AA-3977-01 | Colorectum | colon adenocarcinoma | Male | >=65 | I/II | Unknown | Unknown | SD | |
| CYTIP | SNV | Missense_Mutation | c.914T>G | p.Ile305Ser | p.I305S | O60759 | protein_coding | tolerated(0.09) | benign(0.006) | TCGA-AD-6964-01 | Colorectum | colon adenocarcinoma | Male | <65 | III/IV | Chemotherapy | folfox | PD |
| Page: 1 2 3 4 5 6 |
Top |
Related drugs of malignant transformation related genes |
| Identification of chemicals and drugs interact with genes involved in malignant transfromation |
| (DGIdb 4.0) |
| Entrez ID | Symbol | Category | Interaction Types | Drug Claim Name | Drug Name | PMIDs |
| Page: 1 |

Copyright 2023-Present -The University of Texas Health Science Center at Houston |