
|
|||||
|
 | |
| |
| |
| |
| |
| |
|
Gene: CYTH3 |
Gene summary for CYTH3 |
| Gene information | Species | Human | Gene symbol | CYTH3 | Gene ID | 9265 |
| Gene name | cytohesin 3 | |
| Gene Alias | ARNO3 | |
| Cytomap | 7p22.1 | |
| Gene Type | protein-coding | GO ID | GO:0006810 | UniProtAcc | O43739 |
Top |
Malignant transformation analysis |
| Identification of the aberrant gene expression in precancerous and cancerous lesions by comparing the gene expression of stem-like cells in diseased tissues with normal stem cells |
| Entrez ID | Symbol | Replicates | Species | Organ | Tissue | Adj P-value | Log2FC | Malignancy |
| 9265 | CYTH3 | LZE24T | Human | Esophagus | ESCC | 2.92e-04 | 1.34e-01 | 0.0596 |
| 9265 | CYTH3 | P2T-E | Human | Esophagus | ESCC | 6.40e-08 | 1.25e-01 | 0.1177 |
| 9265 | CYTH3 | P4T-E | Human | Esophagus | ESCC | 1.16e-03 | 9.20e-02 | 0.1323 |
| 9265 | CYTH3 | P5T-E | Human | Esophagus | ESCC | 5.37e-07 | 1.69e-01 | 0.1327 |
| 9265 | CYTH3 | P8T-E | Human | Esophagus | ESCC | 8.68e-05 | 1.11e-01 | 0.0889 |
| 9265 | CYTH3 | P9T-E | Human | Esophagus | ESCC | 4.62e-02 | 1.45e-01 | 0.1131 |
| 9265 | CYTH3 | P10T-E | Human | Esophagus | ESCC | 1.54e-04 | 8.03e-02 | 0.116 |
| 9265 | CYTH3 | P11T-E | Human | Esophagus | ESCC | 5.46e-09 | 3.52e-01 | 0.1426 |
| 9265 | CYTH3 | P12T-E | Human | Esophagus | ESCC | 2.54e-06 | 1.42e-01 | 0.1122 |
| 9265 | CYTH3 | P15T-E | Human | Esophagus | ESCC | 4.29e-09 | 2.04e-01 | 0.1149 |
| 9265 | CYTH3 | P16T-E | Human | Esophagus | ESCC | 1.56e-03 | 5.27e-02 | 0.1153 |
| 9265 | CYTH3 | P20T-E | Human | Esophagus | ESCC | 7.85e-03 | 1.28e-01 | 0.1124 |
| 9265 | CYTH3 | P21T-E | Human | Esophagus | ESCC | 7.15e-08 | 2.03e-01 | 0.1617 |
| 9265 | CYTH3 | P22T-E | Human | Esophagus | ESCC | 2.10e-09 | 6.07e-02 | 0.1236 |
| 9265 | CYTH3 | P23T-E | Human | Esophagus | ESCC | 2.70e-04 | 1.55e-01 | 0.108 |
| 9265 | CYTH3 | P24T-E | Human | Esophagus | ESCC | 8.60e-04 | 3.42e-02 | 0.1287 |
| 9265 | CYTH3 | P26T-E | Human | Esophagus | ESCC | 2.32e-06 | 1.20e-01 | 0.1276 |
| 9265 | CYTH3 | P27T-E | Human | Esophagus | ESCC | 1.56e-07 | 9.21e-02 | 0.1055 |
| 9265 | CYTH3 | P28T-E | Human | Esophagus | ESCC | 6.09e-09 | 1.86e-01 | 0.1149 |
| 9265 | CYTH3 | P30T-E | Human | Esophagus | ESCC | 9.97e-04 | 1.38e-01 | 0.137 |
| Page: 1 2 3 4 |
| Tissue | Expression Dynamics | Abbreviation |
| Esophagus | 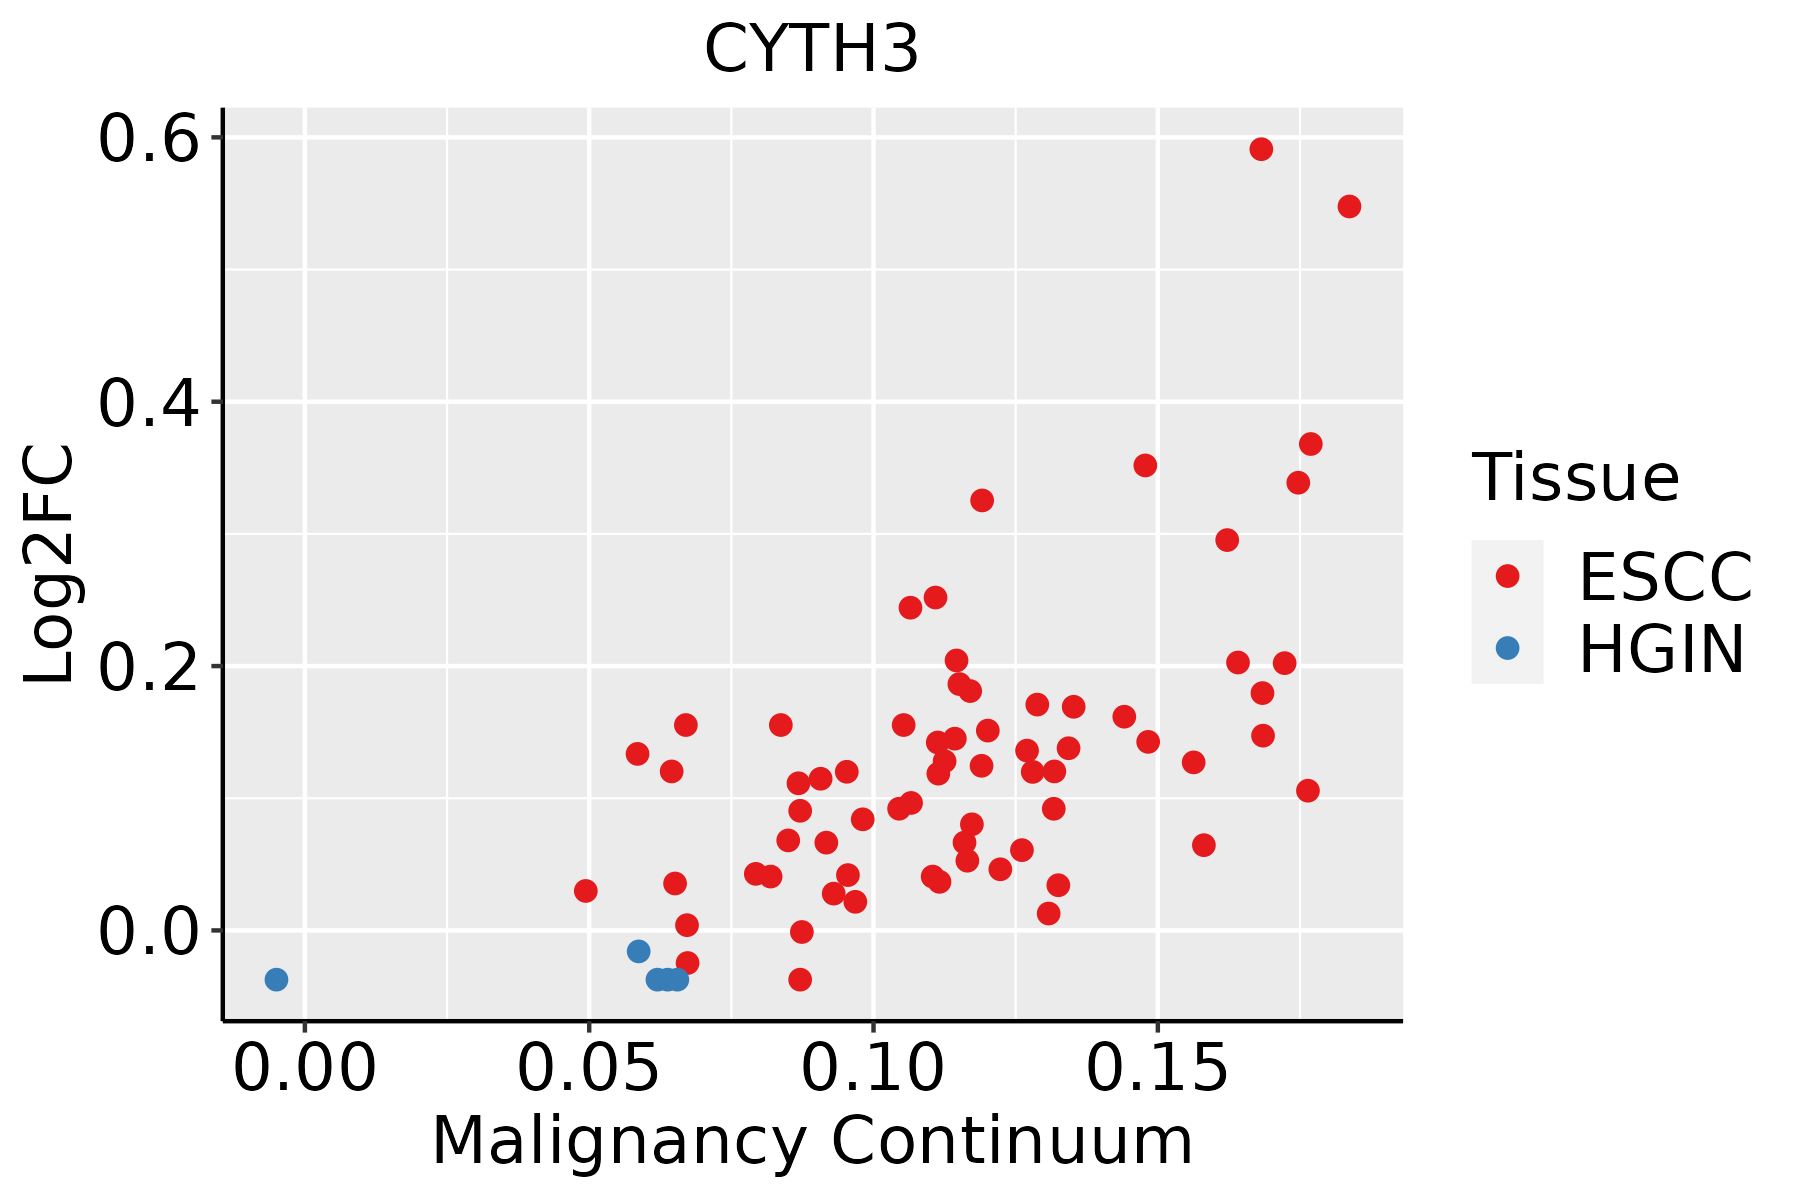 | ESCC: Esophageal squamous cell carcinoma |
| HGIN: High-grade intraepithelial neoplasias | ||
| LGIN: Low-grade intraepithelial neoplasias | ||
| Lung | 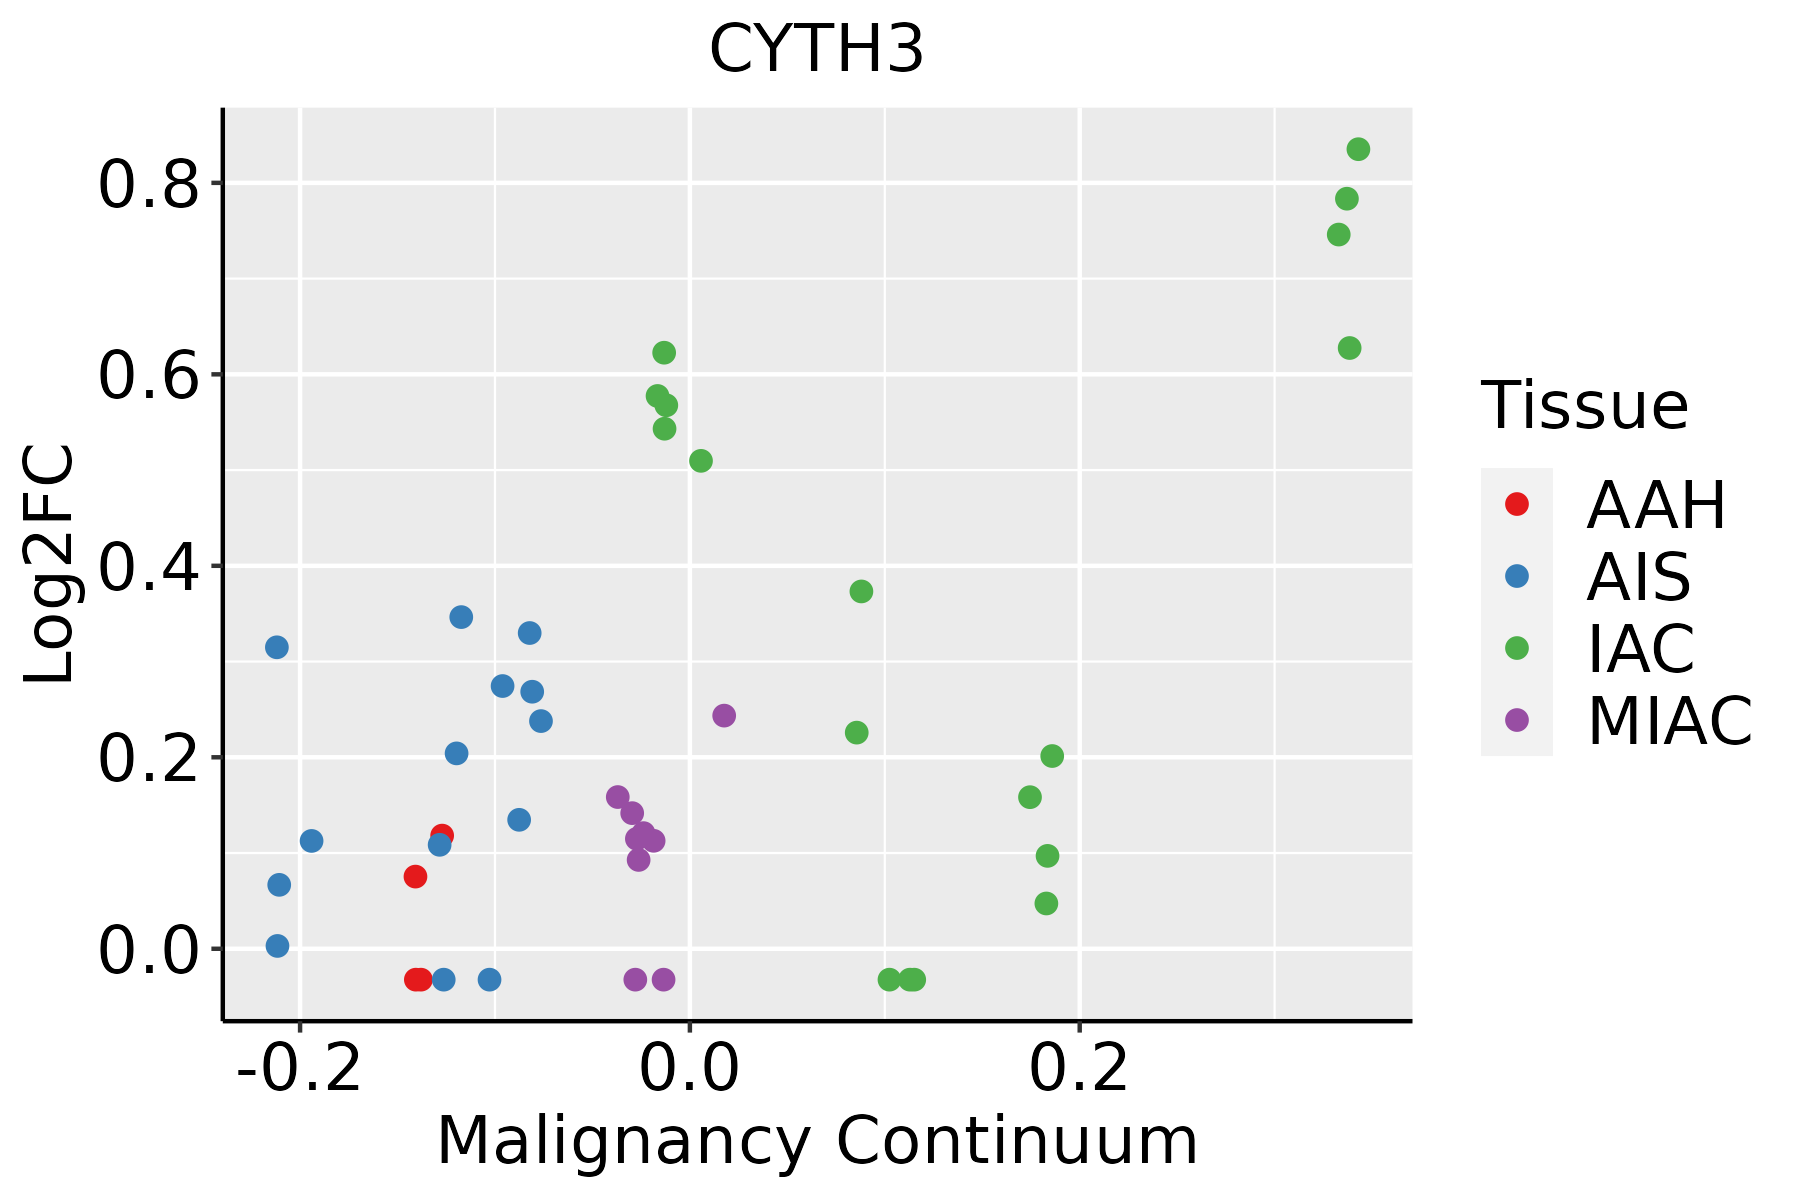 | AAH: Atypical adenomatous hyperplasia |
| AIS: Adenocarcinoma in situ | ||
| IAC: Invasive lung adenocarcinoma | ||
| MIA: Minimally invasive adenocarcinoma | ||
| Oral Cavity | 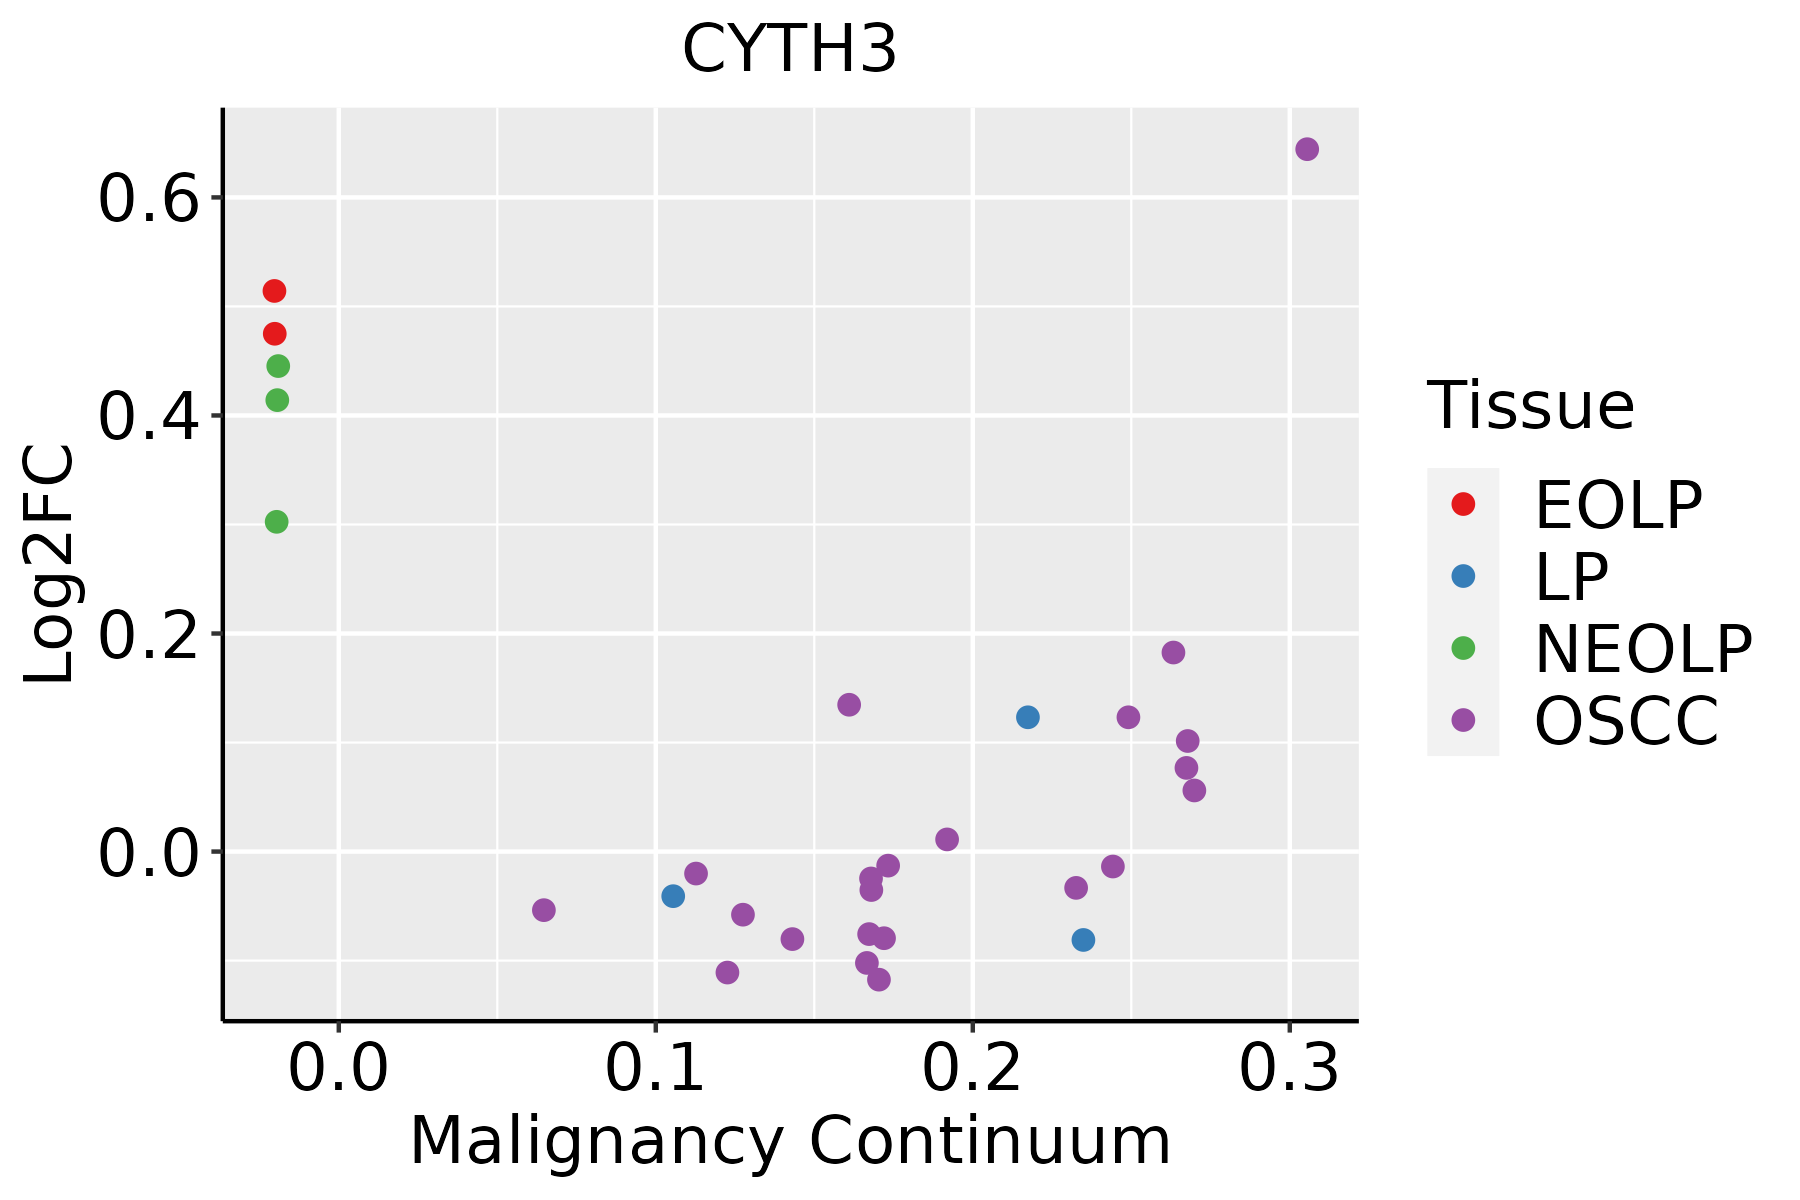 | EOLP: Erosive Oral lichen planus |
| LP: leukoplakia | ||
| NEOLP: Non-erosive oral lichen planus | ||
| OSCC: Oral squamous cell carcinoma | ||
| Thyroid |  | ATC: Anaplastic thyroid cancer |
| HT: Hashimoto's thyroiditis | ||
| PTC: Papillary thyroid cancer |
| ∗log2FC in expression of this searched gene in stem-like cells from each diseased tissue sample relative to stem-like cells in normal samples in each tissue plotted against the malignancy continuum. Samples are colored based on if they are from different disease stage. |
Top |
Malignant transformation related pathway analysis |
| Find out the enriched GO biological processes and KEGG pathways involved in transition from healthy to precancer to cancer |
| Tissue | Disease Stage | Enriched GO biological Processes |
| Colorectum | AD |  |
| Colorectum | SER |  |
| Colorectum | MSS |  |
| Colorectum | MSI-H |  |
| Colorectum | FAP |  |
| ∗Top 15 enriched GO BP terms are showed in the bar plot of each disease state in each tissue. Each row represents a significant GO biological process which is colored according to the -log10(p.adjust). |
| Page: 1 2 3 4 5 6 7 8 9 |
| GO ID | Tissue | Disease Stage | Description | Gene Ratio | Bg Ratio | pvalue | p.adjust | Count |
| GO:004819318 | Esophagus | ESCC | Golgi vesicle transport | 231/8552 | 296/18723 | 1.82e-30 | 9.63e-28 | 231 |
| GO:000716320 | Esophagus | ESCC | establishment or maintenance of cell polarity | 143/8552 | 218/18723 | 2.05e-09 | 4.65e-08 | 143 |
| GO:004578527 | Esophagus | ESCC | positive regulation of cell adhesion | 255/8552 | 437/18723 | 5.07e-08 | 9.11e-07 | 255 |
| GO:000726510 | Esophagus | ESCC | Ras protein signal transduction | 201/8552 | 337/18723 | 1.44e-07 | 2.30e-06 | 201 |
| GO:003001018 | Esophagus | ESCC | establishment of cell polarity | 96/8552 | 143/18723 | 1.69e-07 | 2.67e-06 | 96 |
| GO:009016216 | Esophagus | ESCC | establishment of epithelial cell polarity | 25/8552 | 31/18723 | 7.13e-05 | 5.38e-04 | 25 |
| GO:00465789 | Esophagus | ESCC | regulation of Ras protein signal transduction | 106/8552 | 189/18723 | 2.49e-03 | 1.08e-02 | 106 |
| GO:005105610 | Esophagus | ESCC | regulation of small GTPase mediated signal transduction | 157/8552 | 302/18723 | 1.55e-02 | 4.98e-02 | 157 |
| GO:00071637 | Lung | IAC | establishment or maintenance of cell polarity | 61/2061 | 218/18723 | 3.10e-12 | 3.07e-09 | 61 |
| GO:00300107 | Lung | IAC | establishment of cell polarity | 46/2061 | 143/18723 | 7.70e-12 | 4.27e-09 | 46 |
| GO:00510565 | Lung | IAC | regulation of small GTPase mediated signal transduction | 70/2061 | 302/18723 | 9.44e-10 | 1.87e-07 | 70 |
| GO:00457858 | Lung | IAC | positive regulation of cell adhesion | 87/2061 | 437/18723 | 2.59e-08 | 3.13e-06 | 87 |
| GO:00072655 | Lung | IAC | Ras protein signal transduction | 65/2061 | 337/18723 | 4.48e-06 | 1.81e-04 | 65 |
| GO:00465784 | Lung | IAC | regulation of Ras protein signal transduction | 40/2061 | 189/18723 | 3.50e-05 | 8.65e-04 | 40 |
| GO:00901626 | Lung | IAC | establishment of epithelial cell polarity | 11/2061 | 31/18723 | 2.91e-04 | 4.72e-03 | 11 |
| GO:0032011 | Lung | IAC | ARF protein signal transduction | 8/2061 | 19/18723 | 5.25e-04 | 7.44e-03 | 8 |
| GO:0032012 | Lung | IAC | regulation of ARF protein signal transduction | 8/2061 | 19/18723 | 5.25e-04 | 7.44e-03 | 8 |
| GO:00481937 | Lung | IAC | Golgi vesicle transport | 49/2061 | 296/18723 | 2.35e-03 | 2.28e-02 | 49 |
| GO:000716313 | Lung | AIS | establishment or maintenance of cell polarity | 56/1849 | 218/18723 | 1.31e-11 | 6.13e-09 | 56 |
| GO:003001013 | Lung | AIS | establishment of cell polarity | 42/1849 | 143/18723 | 5.03e-11 | 1.95e-08 | 42 |
| Page: 1 2 3 4 |
| Pathway ID | Tissue | Disease Stage | Description | Gene Ratio | Bg Ratio | pvalue | p.adjust | qvalue | Count |
| hsa05132211 | Esophagus | ESCC | Salmonella infection | 191/4205 | 249/8465 | 6.51e-19 | 5.45e-17 | 2.79e-17 | 191 |
| hsa04144210 | Esophagus | ESCC | Endocytosis | 186/4205 | 251/8465 | 9.74e-16 | 4.66e-14 | 2.39e-14 | 186 |
| hsa05131211 | Esophagus | ESCC | Shigellosis | 176/4205 | 247/8465 | 2.27e-12 | 4.01e-11 | 2.05e-11 | 176 |
| hsa05130211 | Esophagus | ESCC | Pathogenic Escherichia coli infection | 142/4205 | 197/8465 | 8.21e-11 | 1.06e-09 | 5.42e-10 | 142 |
| hsa05132310 | Esophagus | ESCC | Salmonella infection | 191/4205 | 249/8465 | 6.51e-19 | 5.45e-17 | 2.79e-17 | 191 |
| hsa0414437 | Esophagus | ESCC | Endocytosis | 186/4205 | 251/8465 | 9.74e-16 | 4.66e-14 | 2.39e-14 | 186 |
| hsa05131310 | Esophagus | ESCC | Shigellosis | 176/4205 | 247/8465 | 2.27e-12 | 4.01e-11 | 2.05e-11 | 176 |
| hsa05130310 | Esophagus | ESCC | Pathogenic Escherichia coli infection | 142/4205 | 197/8465 | 8.21e-11 | 1.06e-09 | 5.42e-10 | 142 |
| hsa0513116 | Lung | IAC | Shigellosis | 58/1053 | 247/8465 | 8.21e-07 | 3.81e-05 | 2.53e-05 | 58 |
| hsa0513016 | Lung | IAC | Pathogenic Escherichia coli infection | 45/1053 | 197/8465 | 2.93e-05 | 6.14e-04 | 4.08e-04 | 45 |
| hsa0513216 | Lung | IAC | Salmonella infection | 52/1053 | 249/8465 | 9.46e-05 | 1.28e-03 | 8.50e-04 | 52 |
| hsa0414414 | Lung | IAC | Endocytosis | 51/1053 | 251/8465 | 2.25e-04 | 2.54e-03 | 1.68e-03 | 51 |
| hsa04072 | Lung | IAC | Phospholipase D signaling pathway | 28/1053 | 148/8465 | 1.46e-02 | 5.00e-02 | 3.32e-02 | 28 |
| hsa0513117 | Lung | IAC | Shigellosis | 58/1053 | 247/8465 | 8.21e-07 | 3.81e-05 | 2.53e-05 | 58 |
| hsa0513017 | Lung | IAC | Pathogenic Escherichia coli infection | 45/1053 | 197/8465 | 2.93e-05 | 6.14e-04 | 4.08e-04 | 45 |
| hsa0513217 | Lung | IAC | Salmonella infection | 52/1053 | 249/8465 | 9.46e-05 | 1.28e-03 | 8.50e-04 | 52 |
| hsa0414415 | Lung | IAC | Endocytosis | 51/1053 | 251/8465 | 2.25e-04 | 2.54e-03 | 1.68e-03 | 51 |
| hsa040721 | Lung | IAC | Phospholipase D signaling pathway | 28/1053 | 148/8465 | 1.46e-02 | 5.00e-02 | 3.32e-02 | 28 |
| hsa0513123 | Lung | AIS | Shigellosis | 53/961 | 247/8465 | 2.70e-06 | 9.71e-05 | 6.21e-05 | 53 |
| hsa0414423 | Lung | AIS | Endocytosis | 52/961 | 251/8465 | 9.74e-06 | 3.04e-04 | 1.95e-04 | 52 |
| Page: 1 2 3 |
Top |
Cell-cell communication analysis |
| Identification of potential cell-cell interactions between two cell types and their ligand-receptor pairs for different disease states |
| Ligand | Receptor | LRpair | Pathway | Tissue | Disease Stage |
| Page: 1 |
Top |
Single-cell gene regulatory network inference analysis |
| Find out the significant the regulons (TFs) and the target genes of each regulon across cell types for different disease states |
| TF | Cell Type | Tissue | Disease Stage | Target Gene | RSS | Regulon Activity |
| ∗The dot plots of a searched regulon are shown for all cell subpopulations in each disease state of each tissue based on the regulon specific score inferred using pySCENIC and by calculating the average expression. |
| Page: 1 |
Top |
Somatic mutation of malignant transformation related genes |
| Annotation of somatic variants for genes involved in malignant transformation |
| Hugo Symbol | Variant Class | Variant Classification | dbSNP RS | HGVSc | HGVSp | HGVSp Short | SWISSPROT | BIOTYPE | SIFT | PolyPhen | Tumor Sample Barcode | Tissue | Histology | Sex | Age | Stage | Therapy Types | Drugs | Outcome |
| CYTH3 | SNV | Missense_Mutation | c.557C>A | p.Ser186Tyr | p.S186Y | O43739 | protein_coding | deleterious(0.01) | possibly_damaging(0.899) | TCGA-AN-A0FL-01 | Breast | breast invasive carcinoma | Female | <65 | I/II | Unknown | Unknown | SD | |
| CYTH3 | SNV | Missense_Mutation | c.1142N>C | p.Arg381Thr | p.R381T | O43739 | protein_coding | tolerated(0.11) | benign(0.125) | TCGA-C8-A26Y-01 | Breast | breast invasive carcinoma | Female | >=65 | I/II | Unknown | Unknown | SD | |
| CYTH3 | SNV | Missense_Mutation | novel | c.826G>A | p.Gly276Arg | p.G276R | O43739 | protein_coding | deleterious(0) | probably_damaging(0.995) | TCGA-2W-A8YY-01 | Cervix | cervical & endocervical cancer | Female | <65 | I/II | Chemotherapy | cisplatin | CR |
| CYTH3 | SNV | Missense_Mutation | novel | c.848N>A | p.Arg283His | p.R283H | O43739 | protein_coding | deleterious(0.01) | possibly_damaging(0.871) | TCGA-C5-A2LV-01 | Cervix | cervical & endocervical cancer | Female | <65 | I/II | Unknown | Unknown | SD |
| CYTH3 | SNV | Missense_Mutation | novel | c.760G>A | p.Asp254Asn | p.D254N | O43739 | protein_coding | deleterious(0) | benign(0.194) | TCGA-EA-A3HS-01 | Cervix | cervical & endocervical cancer | Female | <65 | I/II | Unknown | Unknown | SD |
| CYTH3 | SNV | Missense_Mutation | rs749850896 | c.658G>A | p.Ala220Thr | p.A220T | O43739 | protein_coding | tolerated(0.22) | benign(0) | TCGA-EA-A3HS-01 | Cervix | cervical & endocervical cancer | Female | <65 | I/II | Unknown | Unknown | SD |
| CYTH3 | SNV | Missense_Mutation | novel | c.586N>A | p.Ala196Thr | p.A196T | O43739 | protein_coding | tolerated(0.08) | benign(0.191) | TCGA-EA-A3HU-01 | Cervix | cervical & endocervical cancer | Female | <65 | I/II | Unknown | Unknown | SD |
| CYTH3 | SNV | Missense_Mutation | novel | c.597G>A | p.Met199Ile | p.M199I | O43739 | protein_coding | tolerated(0.05) | possibly_damaging(0.567) | TCGA-AA-3947-01 | Colorectum | colon adenocarcinoma | Female | <65 | I/II | Unknown | Unknown | SD |
| CYTH3 | SNV | Missense_Mutation | novel | c.96N>T | p.Lys32Asn | p.K32N | O43739 | protein_coding | tolerated(0.32) | benign(0.118) | TCGA-AZ-4315-01 | Colorectum | colon adenocarcinoma | Male | <65 | I/II | Unknown | Unknown | SD |
| CYTH3 | SNV | Missense_Mutation | c.389N>C | p.Val130Ala | p.V130A | O43739 | protein_coding | deleterious(0) | probably_damaging(0.978) | TCGA-AZ-6600-01 | Colorectum | colon adenocarcinoma | Male | <65 | III/IV | Chemotherapy | cpt-11 | PD |
| Page: 1 2 3 4 5 |
Top |
Related drugs of malignant transformation related genes |
| Identification of chemicals and drugs interact with genes involved in malignant transfromation |
| (DGIdb 4.0) |
| Entrez ID | Symbol | Category | Interaction Types | Drug Claim Name | Drug Name | PMIDs |
| Page: 1 |

Copyright 2023-Present -The University of Texas Health Science Center at Houston |