
|
|||||
|
 | |
| |
| |
| |
| |
| |
|
Gene: CYTH2 |
Gene summary for CYTH2 |
| Gene information | Species | Human | Gene symbol | CYTH2 | Gene ID | 9266 |
| Gene name | cytohesin 2 | |
| Gene Alias | ARNO | |
| Cytomap | 19q13.33 | |
| Gene Type | protein-coding | GO ID | GO:0006810 | UniProtAcc | Q99418 |
Top |
Malignant transformation analysis |
| Identification of the aberrant gene expression in precancerous and cancerous lesions by comparing the gene expression of stem-like cells in diseased tissues with normal stem cells |
| Entrez ID | Symbol | Replicates | Species | Organ | Tissue | Adj P-value | Log2FC | Malignancy |
| 9266 | CYTH2 | LZE4T | Human | Esophagus | ESCC | 1.16e-09 | 2.08e-01 | 0.0811 |
| 9266 | CYTH2 | LZE7T | Human | Esophagus | ESCC | 6.55e-03 | 3.94e-01 | 0.0667 |
| 9266 | CYTH2 | LZE8T | Human | Esophagus | ESCC | 2.98e-07 | 6.71e-02 | 0.067 |
| 9266 | CYTH2 | LZE20T | Human | Esophagus | ESCC | 1.69e-05 | 1.53e-01 | 0.0662 |
| 9266 | CYTH2 | LZE24T | Human | Esophagus | ESCC | 1.36e-27 | 7.66e-01 | 0.0596 |
| 9266 | CYTH2 | LZE6T | Human | Esophagus | ESCC | 5.04e-07 | 9.81e-02 | 0.0845 |
| 9266 | CYTH2 | P1T-E | Human | Esophagus | ESCC | 7.63e-10 | 7.23e-01 | 0.0875 |
| 9266 | CYTH2 | P2T-E | Human | Esophagus | ESCC | 1.31e-19 | 4.02e-01 | 0.1177 |
| 9266 | CYTH2 | P4T-E | Human | Esophagus | ESCC | 8.36e-27 | 5.79e-01 | 0.1323 |
| 9266 | CYTH2 | P5T-E | Human | Esophagus | ESCC | 3.76e-22 | 2.51e-01 | 0.1327 |
| 9266 | CYTH2 | P8T-E | Human | Esophagus | ESCC | 4.51e-54 | 9.67e-01 | 0.0889 |
| 9266 | CYTH2 | P9T-E | Human | Esophagus | ESCC | 4.97e-05 | 3.44e-01 | 0.1131 |
| 9266 | CYTH2 | P10T-E | Human | Esophagus | ESCC | 7.75e-46 | 8.07e-01 | 0.116 |
| 9266 | CYTH2 | P11T-E | Human | Esophagus | ESCC | 1.97e-14 | 6.38e-01 | 0.1426 |
| 9266 | CYTH2 | P12T-E | Human | Esophagus | ESCC | 2.86e-29 | 5.19e-01 | 0.1122 |
| 9266 | CYTH2 | P15T-E | Human | Esophagus | ESCC | 4.07e-26 | 5.69e-01 | 0.1149 |
| 9266 | CYTH2 | P16T-E | Human | Esophagus | ESCC | 1.31e-21 | 2.30e-01 | 0.1153 |
| 9266 | CYTH2 | P17T-E | Human | Esophagus | ESCC | 9.40e-10 | 5.17e-01 | 0.1278 |
| 9266 | CYTH2 | P19T-E | Human | Esophagus | ESCC | 2.19e-04 | 5.47e-01 | 0.1662 |
| 9266 | CYTH2 | P20T-E | Human | Esophagus | ESCC | 1.89e-10 | 1.82e-01 | 0.1124 |
| Page: 1 2 3 4 5 6 |
| Tissue | Expression Dynamics | Abbreviation |
| Esophagus | 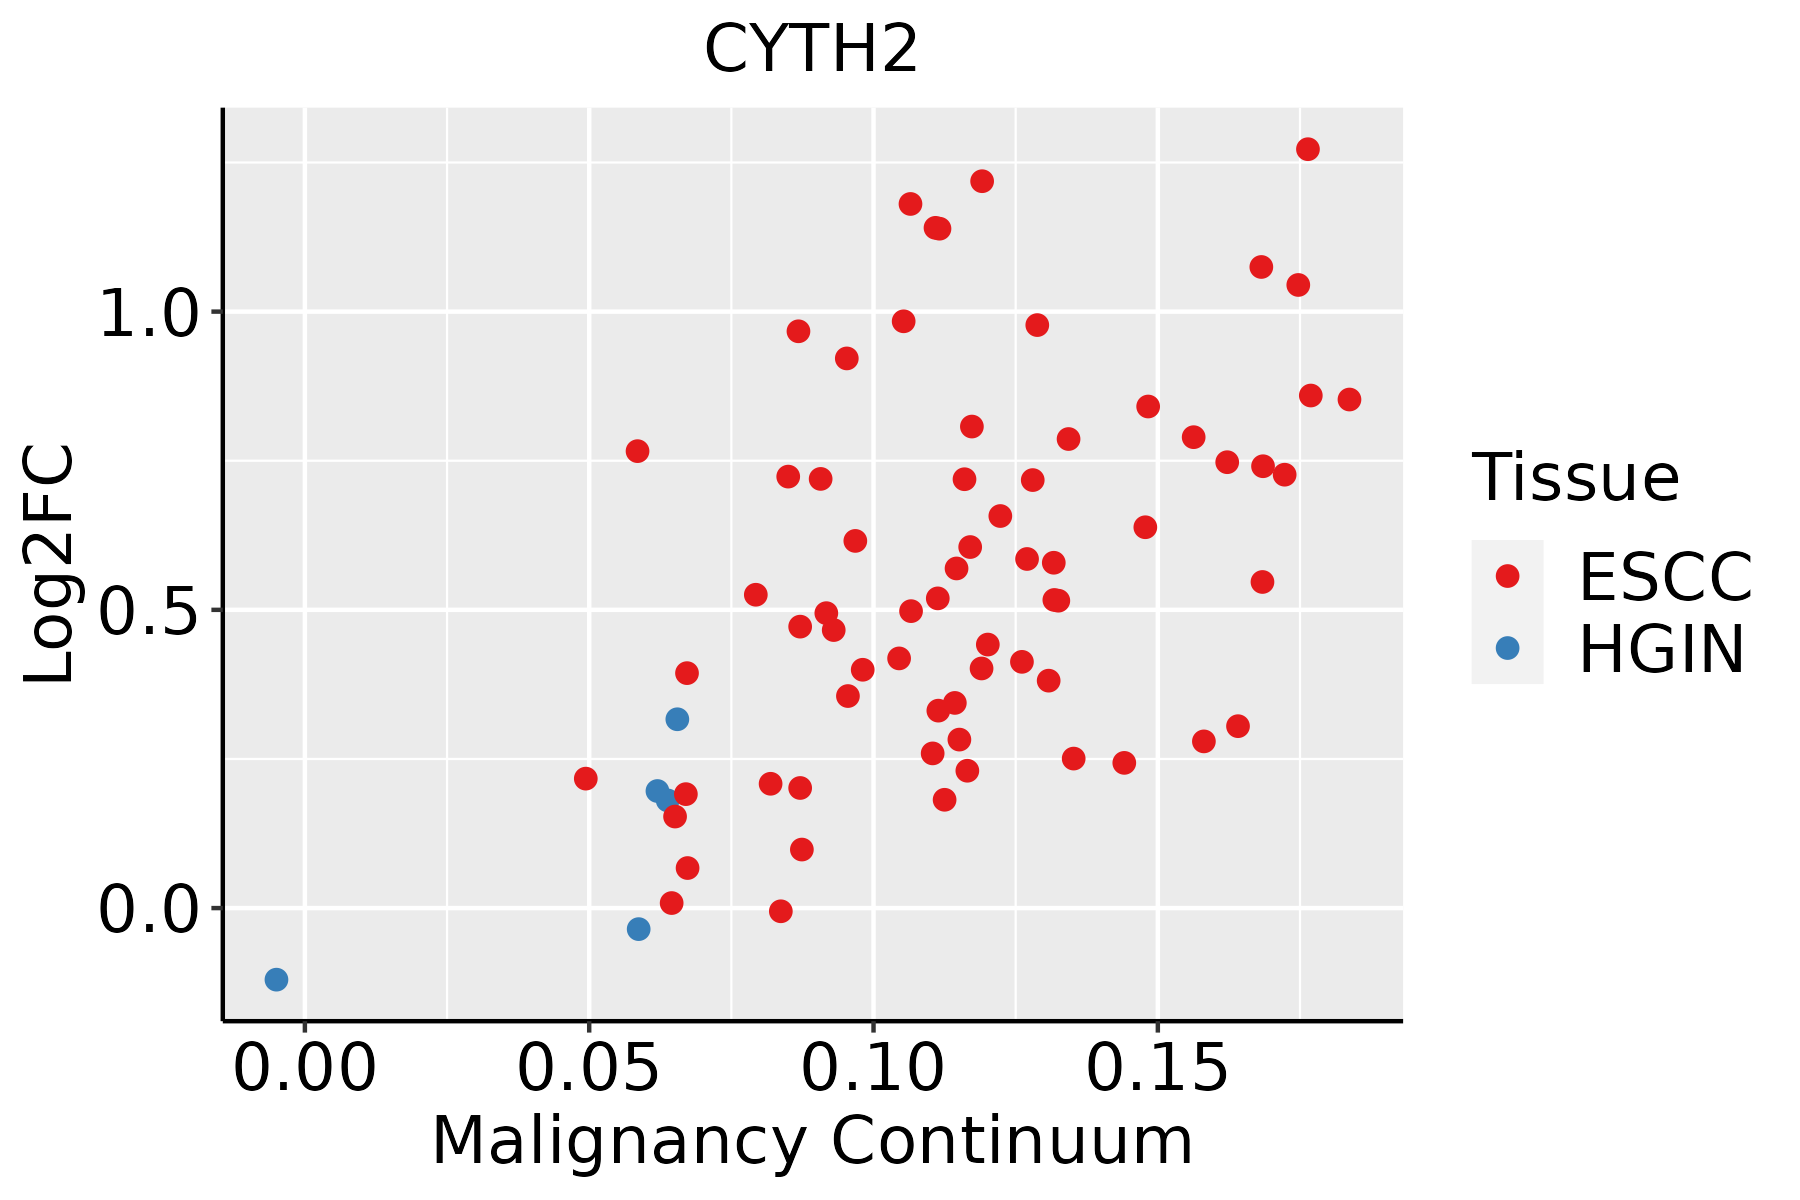 | ESCC: Esophageal squamous cell carcinoma |
| HGIN: High-grade intraepithelial neoplasias | ||
| LGIN: Low-grade intraepithelial neoplasias | ||
| Liver | 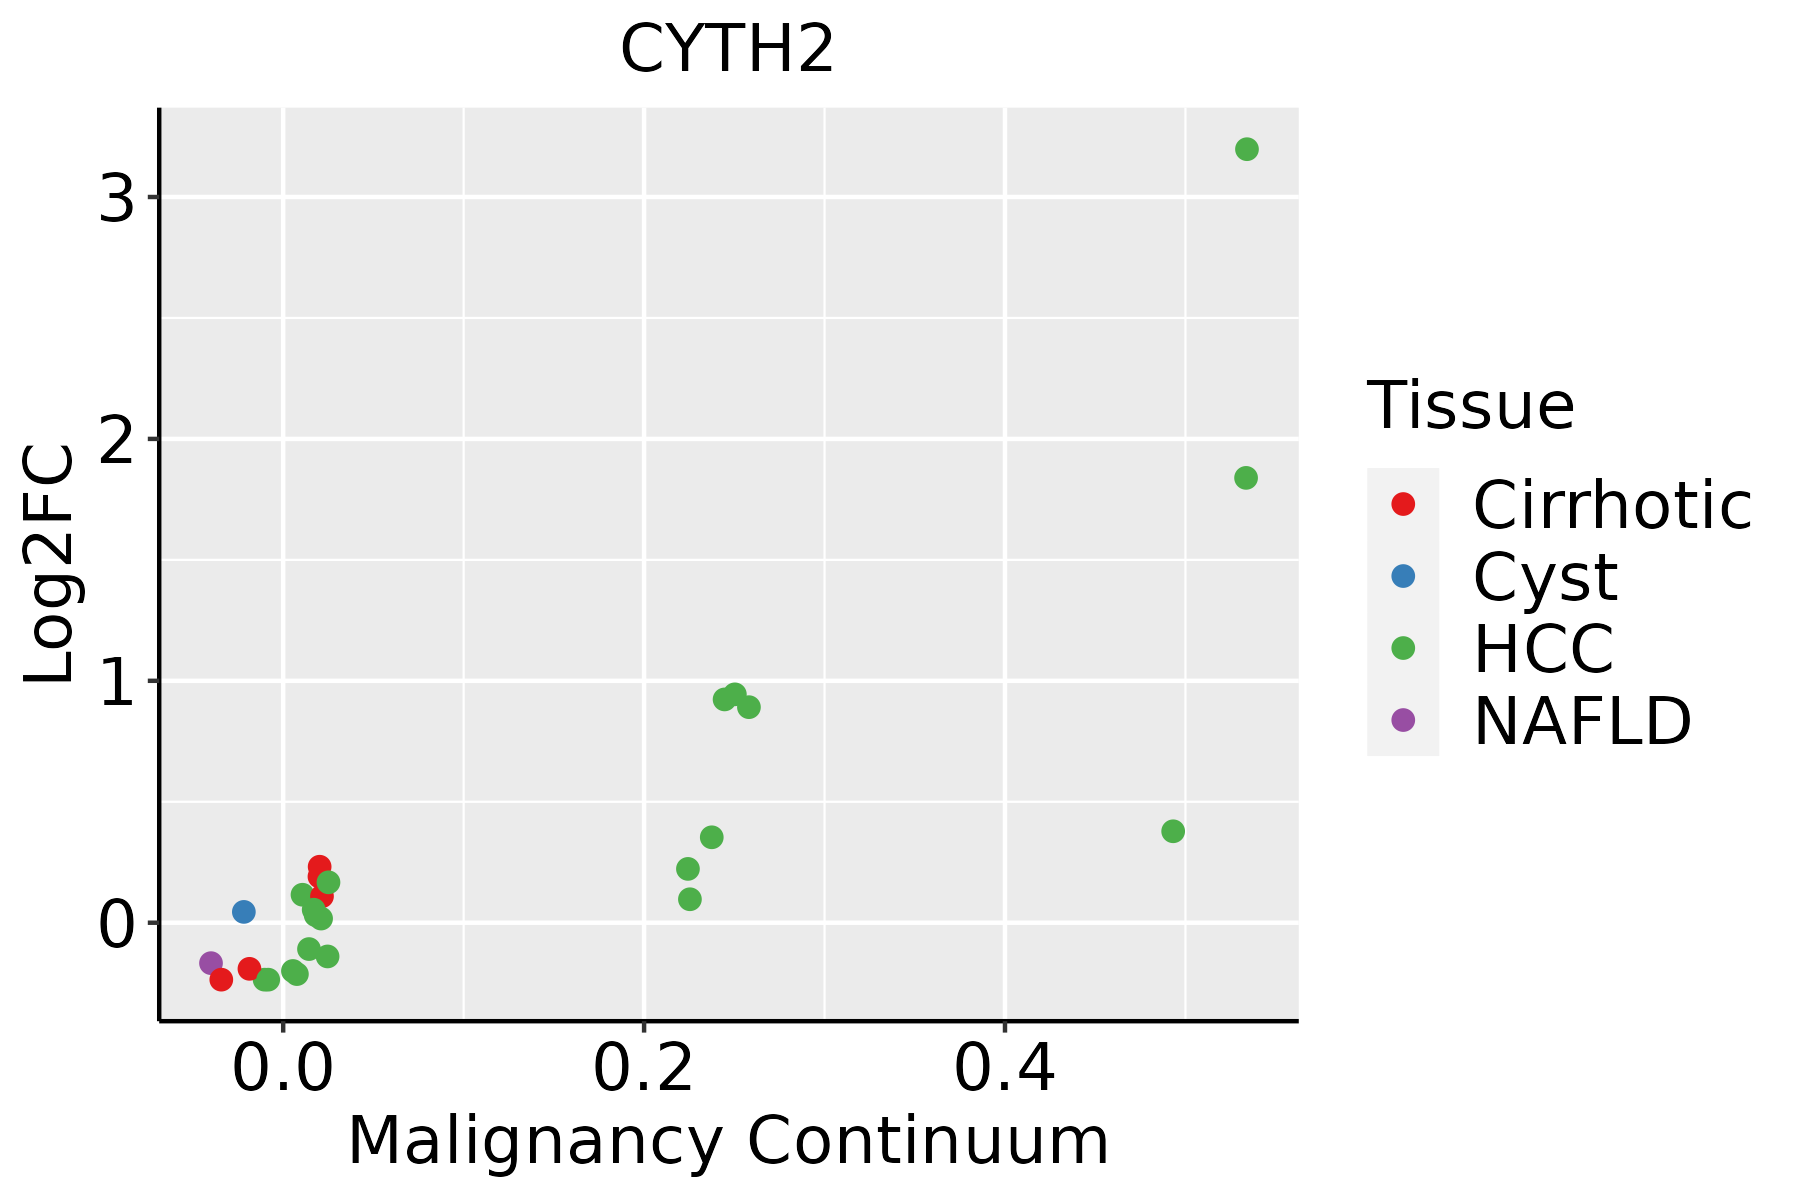 | HCC: Hepatocellular carcinoma |
| NAFLD: Non-alcoholic fatty liver disease | ||
| Oral Cavity | 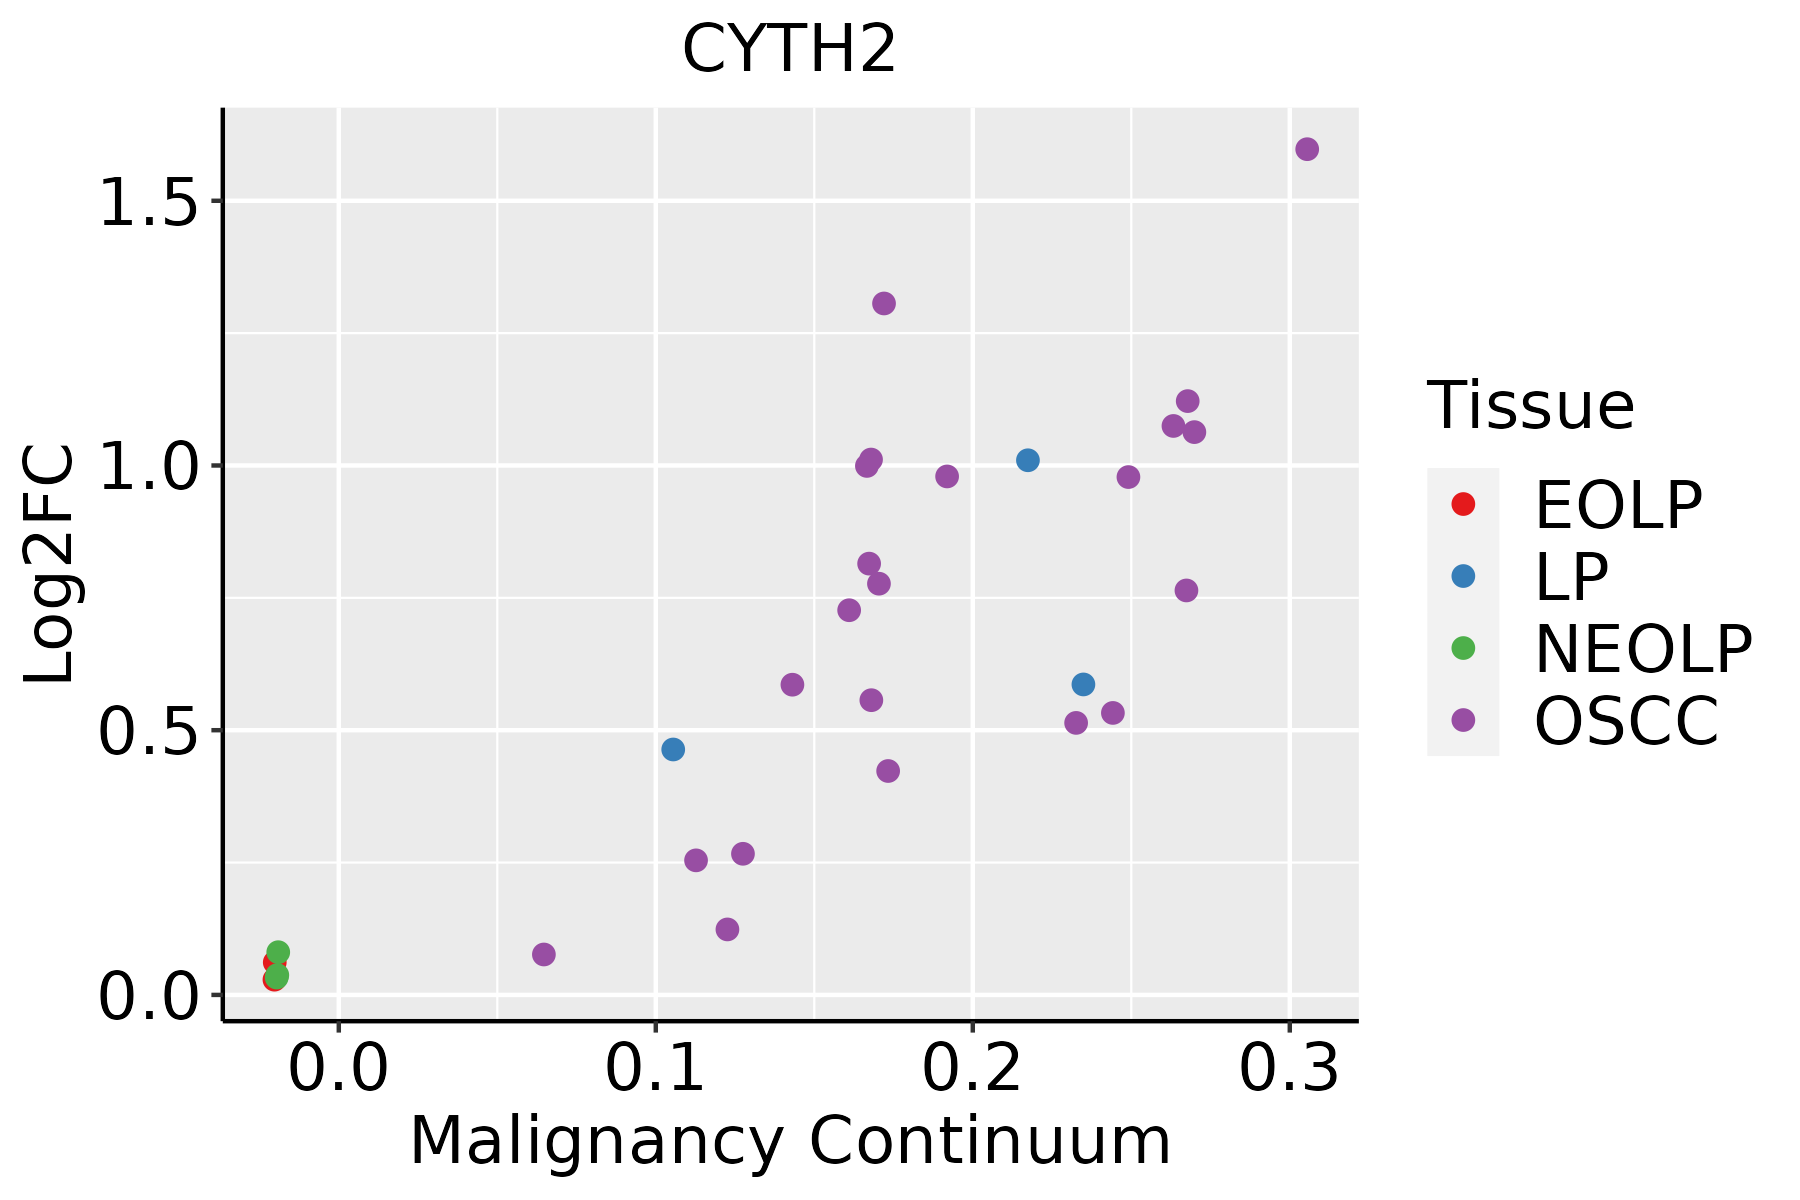 | EOLP: Erosive Oral lichen planus |
| LP: leukoplakia | ||
| NEOLP: Non-erosive oral lichen planus | ||
| OSCC: Oral squamous cell carcinoma | ||
| Skin |  | AK: Actinic keratosis |
| cSCC: Cutaneous squamous cell carcinoma | ||
| SCCIS:squamous cell carcinoma in situ | ||
| Thyroid | 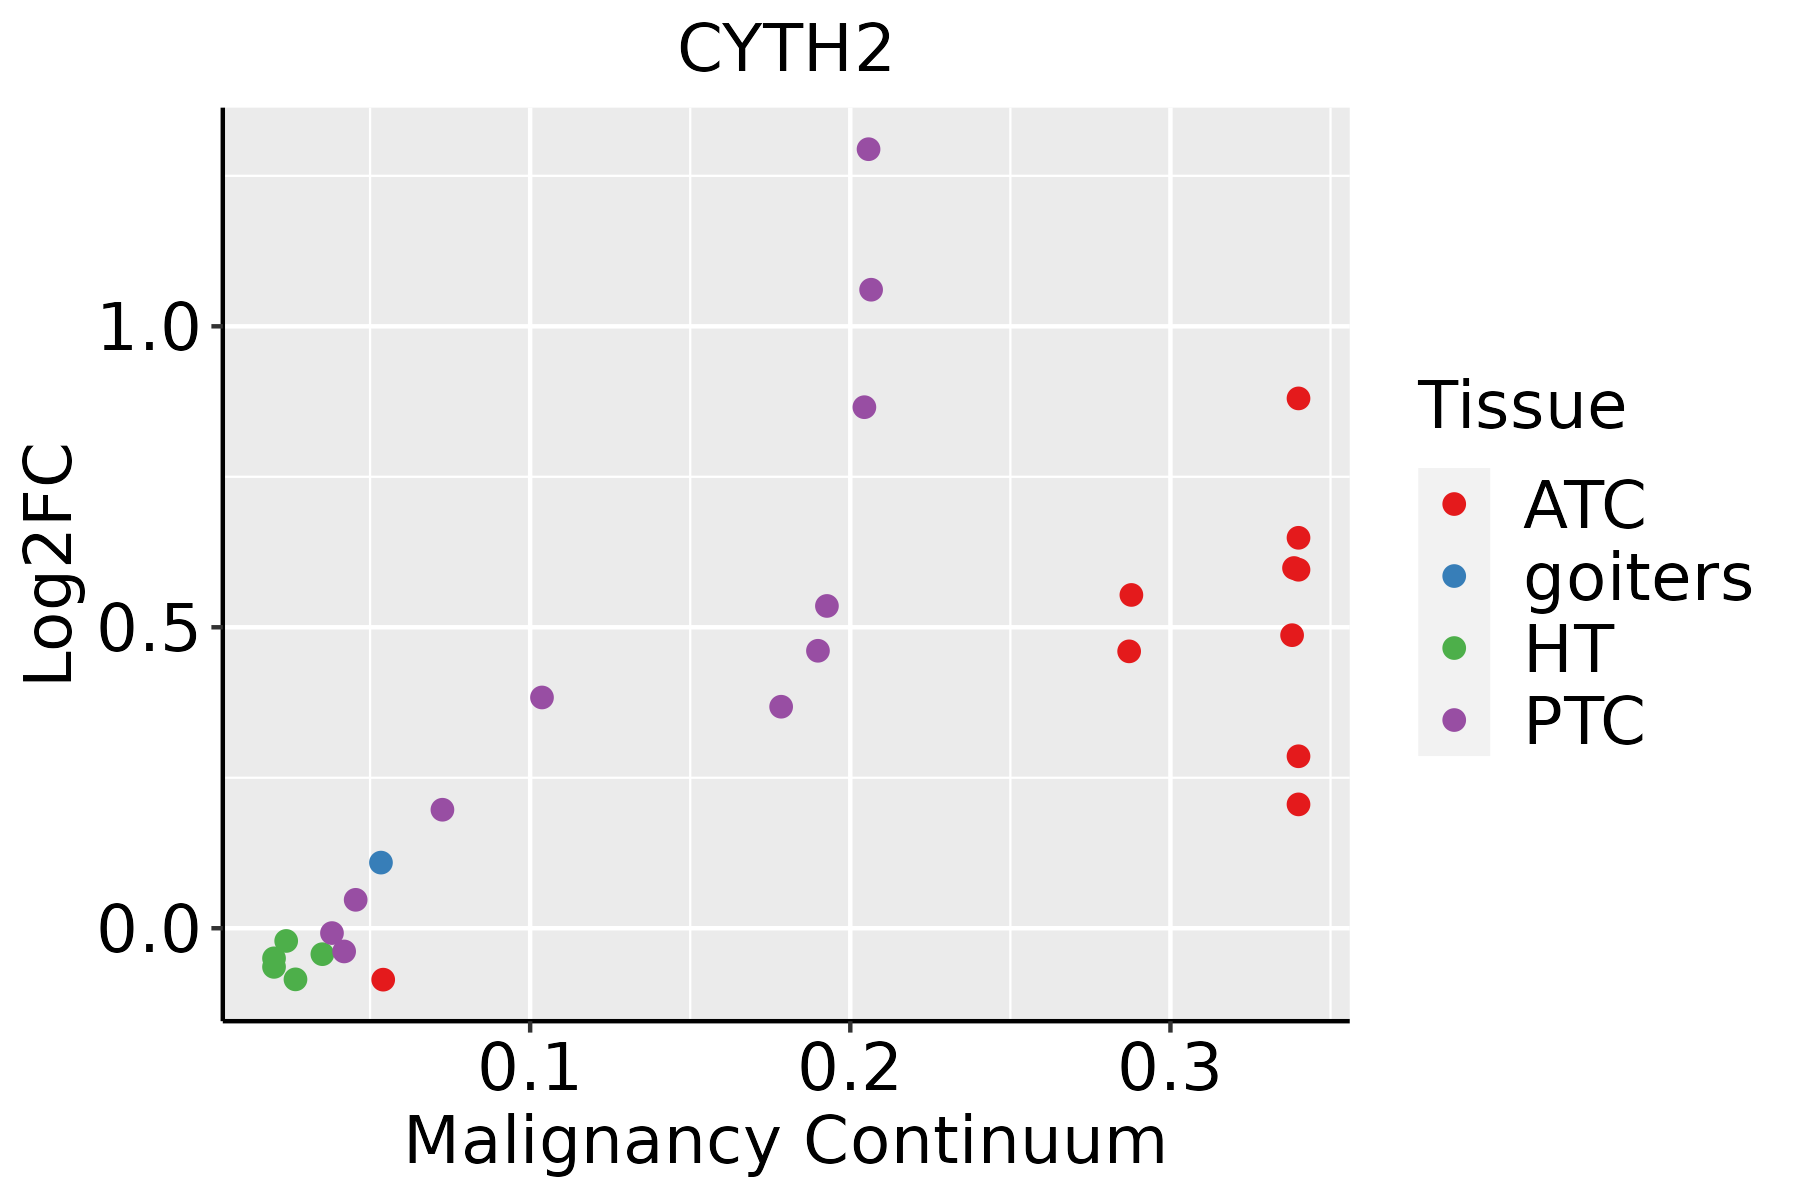 | ATC: Anaplastic thyroid cancer |
| HT: Hashimoto's thyroiditis | ||
| PTC: Papillary thyroid cancer |
| ∗log2FC in expression of this searched gene in stem-like cells from each diseased tissue sample relative to stem-like cells in normal samples in each tissue plotted against the malignancy continuum. Samples are colored based on if they are from different disease stage. |
Top |
Malignant transformation related pathway analysis |
| Find out the enriched GO biological processes and KEGG pathways involved in transition from healthy to precancer to cancer |
| Tissue | Disease Stage | Enriched GO biological Processes |
| Colorectum | AD |  |
| Colorectum | SER |  |
| Colorectum | MSS |  |
| Colorectum | MSI-H |  |
| Colorectum | FAP |  |
| ∗Top 15 enriched GO BP terms are showed in the bar plot of each disease state in each tissue. Each row represents a significant GO biological process which is colored according to the -log10(p.adjust). |
| Page: 1 2 3 4 5 6 7 8 9 |
| GO ID | Tissue | Disease Stage | Description | Gene Ratio | Bg Ratio | pvalue | p.adjust | Count |
| GO:000726510 | Esophagus | ESCC | Ras protein signal transduction | 201/8552 | 337/18723 | 1.44e-07 | 2.30e-06 | 201 |
| GO:00465789 | Esophagus | ESCC | regulation of Ras protein signal transduction | 106/8552 | 189/18723 | 2.49e-03 | 1.08e-02 | 106 |
| GO:005105610 | Esophagus | ESCC | regulation of small GTPase mediated signal transduction | 157/8552 | 302/18723 | 1.55e-02 | 4.98e-02 | 157 |
| GO:000726511 | Liver | Cirrhotic | Ras protein signal transduction | 119/4634 | 337/18723 | 8.16e-06 | 1.22e-04 | 119 |
| GO:000726521 | Liver | HCC | Ras protein signal transduction | 187/7958 | 337/18723 | 8.89e-07 | 1.35e-05 | 187 |
| GO:004657811 | Liver | HCC | regulation of Ras protein signal transduction | 100/7958 | 189/18723 | 2.42e-03 | 1.18e-02 | 100 |
| GO:00072659 | Oral cavity | OSCC | Ras protein signal transduction | 185/7305 | 337/18723 | 1.95e-09 | 4.60e-08 | 185 |
| GO:00465788 | Oral cavity | OSCC | regulation of Ras protein signal transduction | 90/7305 | 189/18723 | 9.58e-03 | 3.40e-02 | 90 |
| GO:000726515 | Oral cavity | LP | Ras protein signal transduction | 109/4623 | 337/18723 | 8.44e-04 | 7.36e-03 | 109 |
| GO:000726523 | Skin | cSCC | Ras protein signal transduction | 132/4864 | 337/18723 | 6.17e-08 | 1.57e-06 | 132 |
| GO:000726519 | Thyroid | PTC | Ras protein signal transduction | 162/5968 | 337/18723 | 3.16e-10 | 1.02e-08 | 162 |
| GO:005105617 | Thyroid | PTC | regulation of small GTPase mediated signal transduction | 132/5968 | 302/18723 | 9.26e-06 | 1.04e-04 | 132 |
| GO:004657817 | Thyroid | PTC | regulation of Ras protein signal transduction | 88/5968 | 189/18723 | 1.62e-05 | 1.70e-04 | 88 |
| GO:000726524 | Thyroid | ATC | Ras protein signal transduction | 172/6293 | 337/18723 | 2.25e-11 | 7.96e-10 | 172 |
| GO:005105618 | Thyroid | ATC | regulation of small GTPase mediated signal transduction | 141/6293 | 302/18723 | 1.43e-06 | 1.77e-05 | 141 |
| GO:004657818 | Thyroid | ATC | regulation of Ras protein signal transduction | 94/6293 | 189/18723 | 3.12e-06 | 3.55e-05 | 94 |
| Page: 1 |
| Pathway ID | Tissue | Disease Stage | Description | Gene Ratio | Bg Ratio | pvalue | p.adjust | qvalue | Count |
| hsa05132211 | Esophagus | ESCC | Salmonella infection | 191/4205 | 249/8465 | 6.51e-19 | 5.45e-17 | 2.79e-17 | 191 |
| hsa04144210 | Esophagus | ESCC | Endocytosis | 186/4205 | 251/8465 | 9.74e-16 | 4.66e-14 | 2.39e-14 | 186 |
| hsa05131211 | Esophagus | ESCC | Shigellosis | 176/4205 | 247/8465 | 2.27e-12 | 4.01e-11 | 2.05e-11 | 176 |
| hsa05130211 | Esophagus | ESCC | Pathogenic Escherichia coli infection | 142/4205 | 197/8465 | 8.21e-11 | 1.06e-09 | 5.42e-10 | 142 |
| hsa05132310 | Esophagus | ESCC | Salmonella infection | 191/4205 | 249/8465 | 6.51e-19 | 5.45e-17 | 2.79e-17 | 191 |
| hsa0414437 | Esophagus | ESCC | Endocytosis | 186/4205 | 251/8465 | 9.74e-16 | 4.66e-14 | 2.39e-14 | 186 |
| hsa05131310 | Esophagus | ESCC | Shigellosis | 176/4205 | 247/8465 | 2.27e-12 | 4.01e-11 | 2.05e-11 | 176 |
| hsa05130310 | Esophagus | ESCC | Pathogenic Escherichia coli infection | 142/4205 | 197/8465 | 8.21e-11 | 1.06e-09 | 5.42e-10 | 142 |
| hsa0513222 | Liver | Cirrhotic | Salmonella infection | 121/2530 | 249/8465 | 2.47e-10 | 5.13e-09 | 3.16e-09 | 121 |
| hsa0414412 | Liver | Cirrhotic | Endocytosis | 119/2530 | 251/8465 | 2.33e-09 | 4.56e-08 | 2.81e-08 | 119 |
| hsa0513022 | Liver | Cirrhotic | Pathogenic Escherichia coli infection | 88/2530 | 197/8465 | 6.48e-06 | 6.24e-05 | 3.84e-05 | 88 |
| hsa0513122 | Liver | Cirrhotic | Shigellosis | 105/2530 | 247/8465 | 1.31e-05 | 1.21e-04 | 7.48e-05 | 105 |
| hsa0513232 | Liver | Cirrhotic | Salmonella infection | 121/2530 | 249/8465 | 2.47e-10 | 5.13e-09 | 3.16e-09 | 121 |
| hsa0414413 | Liver | Cirrhotic | Endocytosis | 119/2530 | 251/8465 | 2.33e-09 | 4.56e-08 | 2.81e-08 | 119 |
| hsa0513032 | Liver | Cirrhotic | Pathogenic Escherichia coli infection | 88/2530 | 197/8465 | 6.48e-06 | 6.24e-05 | 3.84e-05 | 88 |
| hsa0513132 | Liver | Cirrhotic | Shigellosis | 105/2530 | 247/8465 | 1.31e-05 | 1.21e-04 | 7.48e-05 | 105 |
| hsa0513242 | Liver | HCC | Salmonella infection | 178/4020 | 249/8465 | 5.90e-15 | 1.98e-13 | 1.10e-13 | 178 |
| hsa0414422 | Liver | HCC | Endocytosis | 178/4020 | 251/8465 | 2.03e-14 | 5.22e-13 | 2.91e-13 | 178 |
| hsa0513042 | Liver | HCC | Pathogenic Escherichia coli infection | 129/4020 | 197/8465 | 2.02e-07 | 2.50e-06 | 1.39e-06 | 129 |
| hsa0513142 | Liver | HCC | Shigellosis | 150/4020 | 247/8465 | 1.53e-05 | 1.04e-04 | 5.81e-05 | 150 |
| Page: 1 2 |
Top |
Cell-cell communication analysis |
| Identification of potential cell-cell interactions between two cell types and their ligand-receptor pairs for different disease states |
| Ligand | Receptor | LRpair | Pathway | Tissue | Disease Stage |
| Page: 1 |
Top |
Single-cell gene regulatory network inference analysis |
| Find out the significant the regulons (TFs) and the target genes of each regulon across cell types for different disease states |
| TF | Cell Type | Tissue | Disease Stage | Target Gene | RSS | Regulon Activity |
| ∗The dot plots of a searched regulon are shown for all cell subpopulations in each disease state of each tissue based on the regulon specific score inferred using pySCENIC and by calculating the average expression. |
| Page: 1 |
Top |
Somatic mutation of malignant transformation related genes |
| Annotation of somatic variants for genes involved in malignant transformation |
| Hugo Symbol | Variant Class | Variant Classification | dbSNP RS | HGVSc | HGVSp | HGVSp Short | SWISSPROT | BIOTYPE | SIFT | PolyPhen | Tumor Sample Barcode | Tissue | Histology | Sex | Age | Stage | Therapy Types | Drugs | Outcome |
| CYTH2 | SNV | Missense_Mutation | novel | c.784C>T | p.Arg262Trp | p.R262W | Q99418 | protein_coding | deleterious(0.01) | probably_damaging(0.948) | TCGA-E9-A2JS-01 | Breast | breast invasive carcinoma | Female | >=65 | I/II | Chemotherapy | cyclophosphamide | PD |
| CYTH2 | SNV | Missense_Mutation | rs772190797 | c.110N>A | p.Arg37Gln | p.R37Q | Q99418 | protein_coding | deleterious(0.04) | benign(0.058) | TCGA-S3-AA11-01 | Breast | breast invasive carcinoma | Female | >=65 | I/II | Hormone Therapy | letrozole | CR |
| CYTH2 | insertion | Frame_Shift_Ins | novel | c.169_170insCCAACTTACTGTGTCACTTTGGACTCCTCTTCATGTC | p.Lys57ThrfsTer43 | p.K57Tfs*43 | Q99418 | protein_coding | TCGA-BH-A0B1-01 | Breast | breast invasive carcinoma | Female | >=65 | I/II | Chemotherapy | adriamycin | SD | ||
| CYTH2 | deletion | Frame_Shift_Del | novel | c.863delN | p.Leu288ProfsTer21 | p.L288Pfs*21 | Q99418 | protein_coding | TCGA-D8-A27V-01 | Breast | breast invasive carcinoma | Female | <65 | I/II | Hormone Therapy | tamoxiphen | SD | ||
| CYTH2 | SNV | Missense_Mutation | c.967G>C | p.Glu323Gln | p.E323Q | Q99418 | protein_coding | deleterious(0) | probably_damaging(0.992) | TCGA-IR-A3LH-01 | Cervix | cervical & endocervical cancer | Female | <65 | I/II | Chemotherapy | cisplatin | CR | |
| CYTH2 | SNV | Missense_Mutation | rs368161948 | c.182N>A | p.Arg61Gln | p.R61Q | Q99418 | protein_coding | tolerated(0.09) | benign(0.026) | TCGA-A6-2686-01 | Colorectum | colon adenocarcinoma | Female | >=65 | I/II | Unknown | Unknown | SD |
| CYTH2 | SNV | Missense_Mutation | c.104N>A | p.Arg35His | p.R35H | Q99418 | protein_coding | tolerated(0.29) | benign(0.014) | TCGA-AD-6889-01 | Colorectum | colon adenocarcinoma | Male | >=65 | I/II | Chemotherapy | xeloda | PD | |
| CYTH2 | SNV | Missense_Mutation | novel | c.370G>A | p.Ala124Thr | p.A124T | Q99418 | protein_coding | tolerated(0.08) | benign(0.019) | TCGA-CA-6717-01 | Colorectum | colon adenocarcinoma | Male | <65 | I/II | Chemotherapy | oxaliplatin | CR |
| CYTH2 | SNV | Missense_Mutation | c.950G>A | p.Arg317Gln | p.R317Q | Q99418 | protein_coding | tolerated(0.24) | benign(0.018) | TCGA-A5-A0G2-01 | Endometrium | uterine corpus endometrioid carcinoma | Female | <65 | III/IV | Unknown | Unknown | SD | |
| CYTH2 | SNV | Missense_Mutation | novel | c.134G>A | p.Ser45Asn | p.S45N | Q99418 | protein_coding | tolerated(0.54) | benign(0.003) | TCGA-AJ-A3BG-01 | Endometrium | uterine corpus endometrioid carcinoma | Female | >=65 | I/II | Chemotherapy | carboplatin | PD |
| Page: 1 2 3 4 5 |
Top |
Related drugs of malignant transformation related genes |
| Identification of chemicals and drugs interact with genes involved in malignant transfromation |
| (DGIdb 4.0) |
| Entrez ID | Symbol | Category | Interaction Types | Drug Claim Name | Drug Name | PMIDs |
| 9266 | CYTH2 | NA | CLOTRIMAZOLE | CLOTRIMAZOLE |
| Page: 1 |

Copyright 2023-Present -The University of Texas Health Science Center at Houston |