
|
|||||
|
 | |
| |
| |
| |
| |
| |
|
Gene: CYSLTR2 |
Gene summary for CYSLTR2 |
| Gene information | Species | Human | Gene symbol | CYSLTR2 | Gene ID | 57105 |
| Gene name | cysteinyl leukotriene receptor 2 | |
| Gene Alias | CYSLT2 | |
| Cytomap | 13q14.2 | |
| Gene Type | protein-coding | GO ID | GO:0002376 | UniProtAcc | A4ZKH2 |
Top |
Malignant transformation analysis |
| Identification of the aberrant gene expression in precancerous and cancerous lesions by comparing the gene expression of stem-like cells in diseased tissues with normal stem cells |
| Entrez ID | Symbol | Replicates | Species | Organ | Tissue | Adj P-value | Log2FC | Malignancy |
| 57105 | CYSLTR2 | male-WTA | Human | Thyroid | PTC | 6.16e-27 | 4.15e-01 | 0.1037 |
| 57105 | CYSLTR2 | PTC01 | Human | Thyroid | PTC | 5.45e-11 | 2.58e-01 | 0.1899 |
| 57105 | CYSLTR2 | PTC04 | Human | Thyroid | PTC | 2.61e-10 | 2.24e-01 | 0.1927 |
| 57105 | CYSLTR2 | PTC05 | Human | Thyroid | PTC | 4.06e-13 | 6.44e-01 | 0.2065 |
| 57105 | CYSLTR2 | PTC06 | Human | Thyroid | PTC | 1.08e-30 | 7.32e-01 | 0.2057 |
| 57105 | CYSLTR2 | PTC07 | Human | Thyroid | PTC | 7.40e-31 | 6.08e-01 | 0.2044 |
| Page: 1 |
| Tissue | Expression Dynamics | Abbreviation |
| Thyroid | 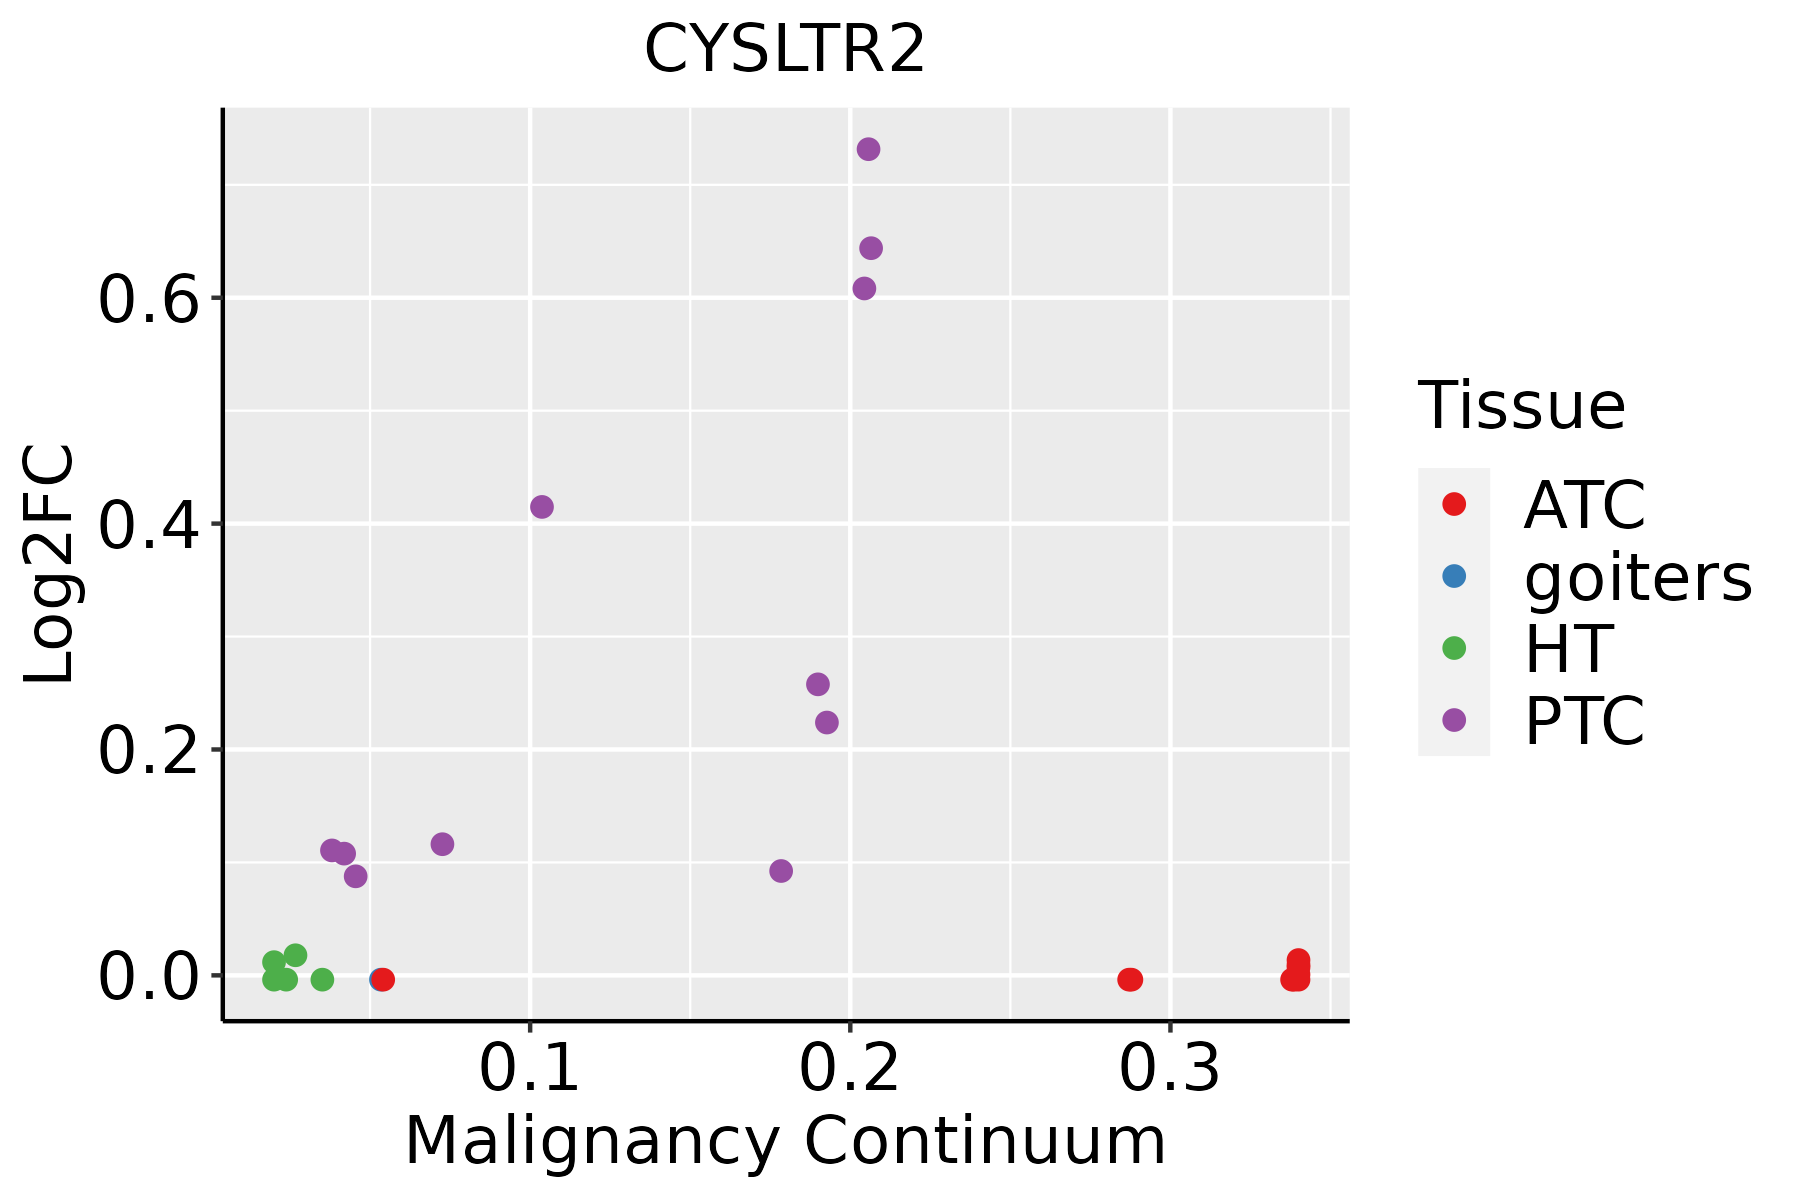 | ATC: Anaplastic thyroid cancer |
| HT: Hashimoto's thyroiditis | ||
| PTC: Papillary thyroid cancer |
| ∗log2FC in expression of this searched gene in stem-like cells from each diseased tissue sample relative to stem-like cells in normal samples in each tissue plotted against the malignancy continuum. Samples are colored based on if they are from different disease stage. |
Top |
Malignant transformation related pathway analysis |
| Find out the enriched GO biological processes and KEGG pathways involved in transition from healthy to precancer to cancer |
| Tissue | Disease Stage | Enriched GO biological Processes |
| Colorectum | AD |  |
| Colorectum | SER |  |
| Colorectum | MSS |  |
| Colorectum | MSI-H |  |
| Colorectum | FAP |  |
| ∗Top 15 enriched GO BP terms are showed in the bar plot of each disease state in each tissue. Each row represents a significant GO biological process which is colored according to the -log10(p.adjust). |
| Page: 1 2 3 4 5 6 7 8 9 |
| GO ID | Tissue | Disease Stage | Description | Gene Ratio | Bg Ratio | pvalue | p.adjust | Count |
| GO:1901653111 | Thyroid | PTC | cellular response to peptide | 169/5968 | 359/18723 | 9.81e-10 | 2.89e-08 | 169 |
| GO:0043434113 | Thyroid | PTC | response to peptide hormone | 188/5968 | 414/18723 | 4.13e-09 | 1.09e-07 | 188 |
| GO:0071375110 | Thyroid | PTC | cellular response to peptide hormone stimulus | 136/5968 | 290/18723 | 5.49e-08 | 1.17e-06 | 136 |
| Page: 1 |
| Pathway ID | Tissue | Disease Stage | Description | Gene Ratio | Bg Ratio | pvalue | p.adjust | qvalue | Count |
| Page: 1 |
Top |
Cell-cell communication analysis |
| Identification of potential cell-cell interactions between two cell types and their ligand-receptor pairs for different disease states |
| Ligand | Receptor | LRpair | Pathway | Tissue | Disease Stage |
| Page: 1 |
Top |
Single-cell gene regulatory network inference analysis |
| Find out the significant the regulons (TFs) and the target genes of each regulon across cell types for different disease states |
| TF | Cell Type | Tissue | Disease Stage | Target Gene | RSS | Regulon Activity |
| ∗The dot plots of a searched regulon are shown for all cell subpopulations in each disease state of each tissue based on the regulon specific score inferred using pySCENIC and by calculating the average expression. |
| Page: 1 |
Top |
Somatic mutation of malignant transformation related genes |
| Annotation of somatic variants for genes involved in malignant transformation |
| Hugo Symbol | Variant Class | Variant Classification | dbSNP RS | HGVSc | HGVSp | HGVSp Short | SWISSPROT | BIOTYPE | SIFT | PolyPhen | Tumor Sample Barcode | Tissue | Histology | Sex | Age | Stage | Therapy Types | Drugs | Outcome |
| CYSLTR2 | SNV | Missense_Mutation | c.62G>A | p.Gly21Asp | p.G21D | Q9NS75 | protein_coding | tolerated(0.49) | benign(0.003) | TCGA-A2-A04X-01 | Breast | breast invasive carcinoma | Female | <65 | I/II | Chemotherapy | adriamycin | SD | |
| CYSLTR2 | SNV | Missense_Mutation | c.411N>A | p.Phe137Leu | p.F137L | Q9NS75 | protein_coding | deleterious(0.02) | probably_damaging(0.926) | TCGA-AR-A1AY-01 | Breast | breast invasive carcinoma | Female | >=65 | I/II | Unspecific | Doxorubicin | SD | |
| CYSLTR2 | SNV | Missense_Mutation | rs148425155 | c.815C>T | p.Thr272Met | p.T272M | Q9NS75 | protein_coding | tolerated(0.11) | benign(0) | TCGA-E2-A1IF-01 | Breast | breast invasive carcinoma | Female | >=65 | I/II | Hormone Therapy | arimidex | SD |
| CYSLTR2 | SNV | Missense_Mutation | rs754435156 | c.209N>T | p.Ser70Phe | p.S70F | Q9NS75 | protein_coding | deleterious(0.01) | benign(0.029) | TCGA-JW-A5VL-01 | Cervix | cervical & endocervical cancer | Female | <65 | I/II | Unknown | Unknown | SD |
| CYSLTR2 | SNV | Missense_Mutation | rs201815757 | c.715N>T | p.Arg239Trp | p.R239W | Q9NS75 | protein_coding | deleterious(0) | possibly_damaging(0.579) | TCGA-AA-3977-01 | Colorectum | colon adenocarcinoma | Male | >=65 | I/II | Unknown | Unknown | SD |
| CYSLTR2 | SNV | Missense_Mutation | c.822N>C | p.Trp274Cys | p.W274C | Q9NS75 | protein_coding | tolerated(0.17) | benign(0.179) | TCGA-AA-A00O-01 | Colorectum | colon adenocarcinoma | Female | >=65 | III/IV | Unknown | Unknown | SD | |
| CYSLTR2 | SNV | Missense_Mutation | c.342N>T | p.Met114Ile | p.M114I | Q9NS75 | protein_coding | tolerated(0.68) | possibly_damaging(0.5) | TCGA-CA-6717-01 | Colorectum | colon adenocarcinoma | Male | <65 | I/II | Chemotherapy | oxaliplatin | CR | |
| CYSLTR2 | SNV | Missense_Mutation | c.776N>A | p.Cys259Tyr | p.C259Y | Q9NS75 | protein_coding | deleterious(0) | probably_damaging(0.995) | TCGA-CK-4951-01 | Colorectum | colon adenocarcinoma | Female | >=65 | I/II | Unknown | Unknown | PD | |
| CYSLTR2 | SNV | Missense_Mutation | c.841N>T | p.Asp281Tyr | p.D281Y | Q9NS75 | protein_coding | deleterious(0.04) | possibly_damaging(0.771) | TCGA-AG-3892-01 | Colorectum | rectum adenocarcinoma | Female | <65 | I/II | Unknown | Unknown | SD | |
| CYSLTR2 | SNV | Missense_Mutation | rs201815757 | c.715N>T | p.Arg239Trp | p.R239W | Q9NS75 | protein_coding | deleterious(0) | possibly_damaging(0.579) | TCGA-EI-7002-01 | Colorectum | rectum adenocarcinoma | Male | <65 | III/IV | Chemotherapy | irinotecan+5-fluorouracilim | SD |
| Page: 1 2 3 4 5 6 |
Top |
Related drugs of malignant transformation related genes |
| Identification of chemicals and drugs interact with genes involved in malignant transfromation |
| (DGIdb 4.0) |
| Entrez ID | Symbol | Category | Interaction Types | Drug Claim Name | Drug Name | PMIDs |
| 57105 | CYSLTR2 | DRUGGABLE GENOME, G PROTEIN COUPLED RECEPTOR | agonist | 135651514 | ||
| 57105 | CYSLTR2 | DRUGGABLE GENOME, G PROTEIN COUPLED RECEPTOR | antagonist | 178100365 | POBILUKAST | |
| 57105 | CYSLTR2 | DRUGGABLE GENOME, G PROTEIN COUPLED RECEPTOR | antagonist | 178102817 | ||
| 57105 | CYSLTR2 | DRUGGABLE GENOME, G PROTEIN COUPLED RECEPTOR | antagonist | 178100355 | ZAFIRLUKAST | |
| 57105 | CYSLTR2 | DRUGGABLE GENOME, G PROTEIN COUPLED RECEPTOR | agonist | 178100418 | ||
| 57105 | CYSLTR2 | DRUGGABLE GENOME, G PROTEIN COUPLED RECEPTOR | antagonist | 178102818 | ||
| 57105 | CYSLTR2 | DRUGGABLE GENOME, G PROTEIN COUPLED RECEPTOR | antagonist | 178102485 | IRALUKAST | |
| 57105 | CYSLTR2 | DRUGGABLE GENOME, G PROTEIN COUPLED RECEPTOR | antagonist | 404859029 | ||
| 57105 | CYSLTR2 | DRUGGABLE GENOME, G PROTEIN COUPLED RECEPTOR | antagonist | 404859027 | ||
| 57105 | CYSLTR2 | DRUGGABLE GENOME, G PROTEIN COUPLED RECEPTOR | agonist | 135651513 |
| Page: 1 2 |

Copyright 2023-Present -The University of Texas Health Science Center at Houston |