
|
|||||
|
 | |
| |
| |
| |
| |
| |
|
Gene: CYP8B1 |
Gene summary for CYP8B1 |
| Gene information | Species | Human | Gene symbol | CYP8B1 | Gene ID | 1582 |
| Gene name | cytochrome P450 family 8 subfamily B member 1 | |
| Gene Alias | CP8B | |
| Cytomap | 3p22.1 | |
| Gene Type | protein-coding | GO ID | GO:0003008 | UniProtAcc | Q9UNU6 |
Top |
Malignant transformation analysis |
| Identification of the aberrant gene expression in precancerous and cancerous lesions by comparing the gene expression of stem-like cells in diseased tissues with normal stem cells |
| Entrez ID | Symbol | Replicates | Species | Organ | Tissue | Adj P-value | Log2FC | Malignancy |
| 1582 | CYP8B1 | NAFLD1 | Human | Liver | NAFLD | 2.22e-11 | 6.73e-01 | -0.04 |
| 1582 | CYP8B1 | HCC1 | Human | Liver | HCC | 1.08e-02 | 1.12e+00 | 0.5336 |
| Page: 1 |
| Tissue | Expression Dynamics | Abbreviation |
| Liver | 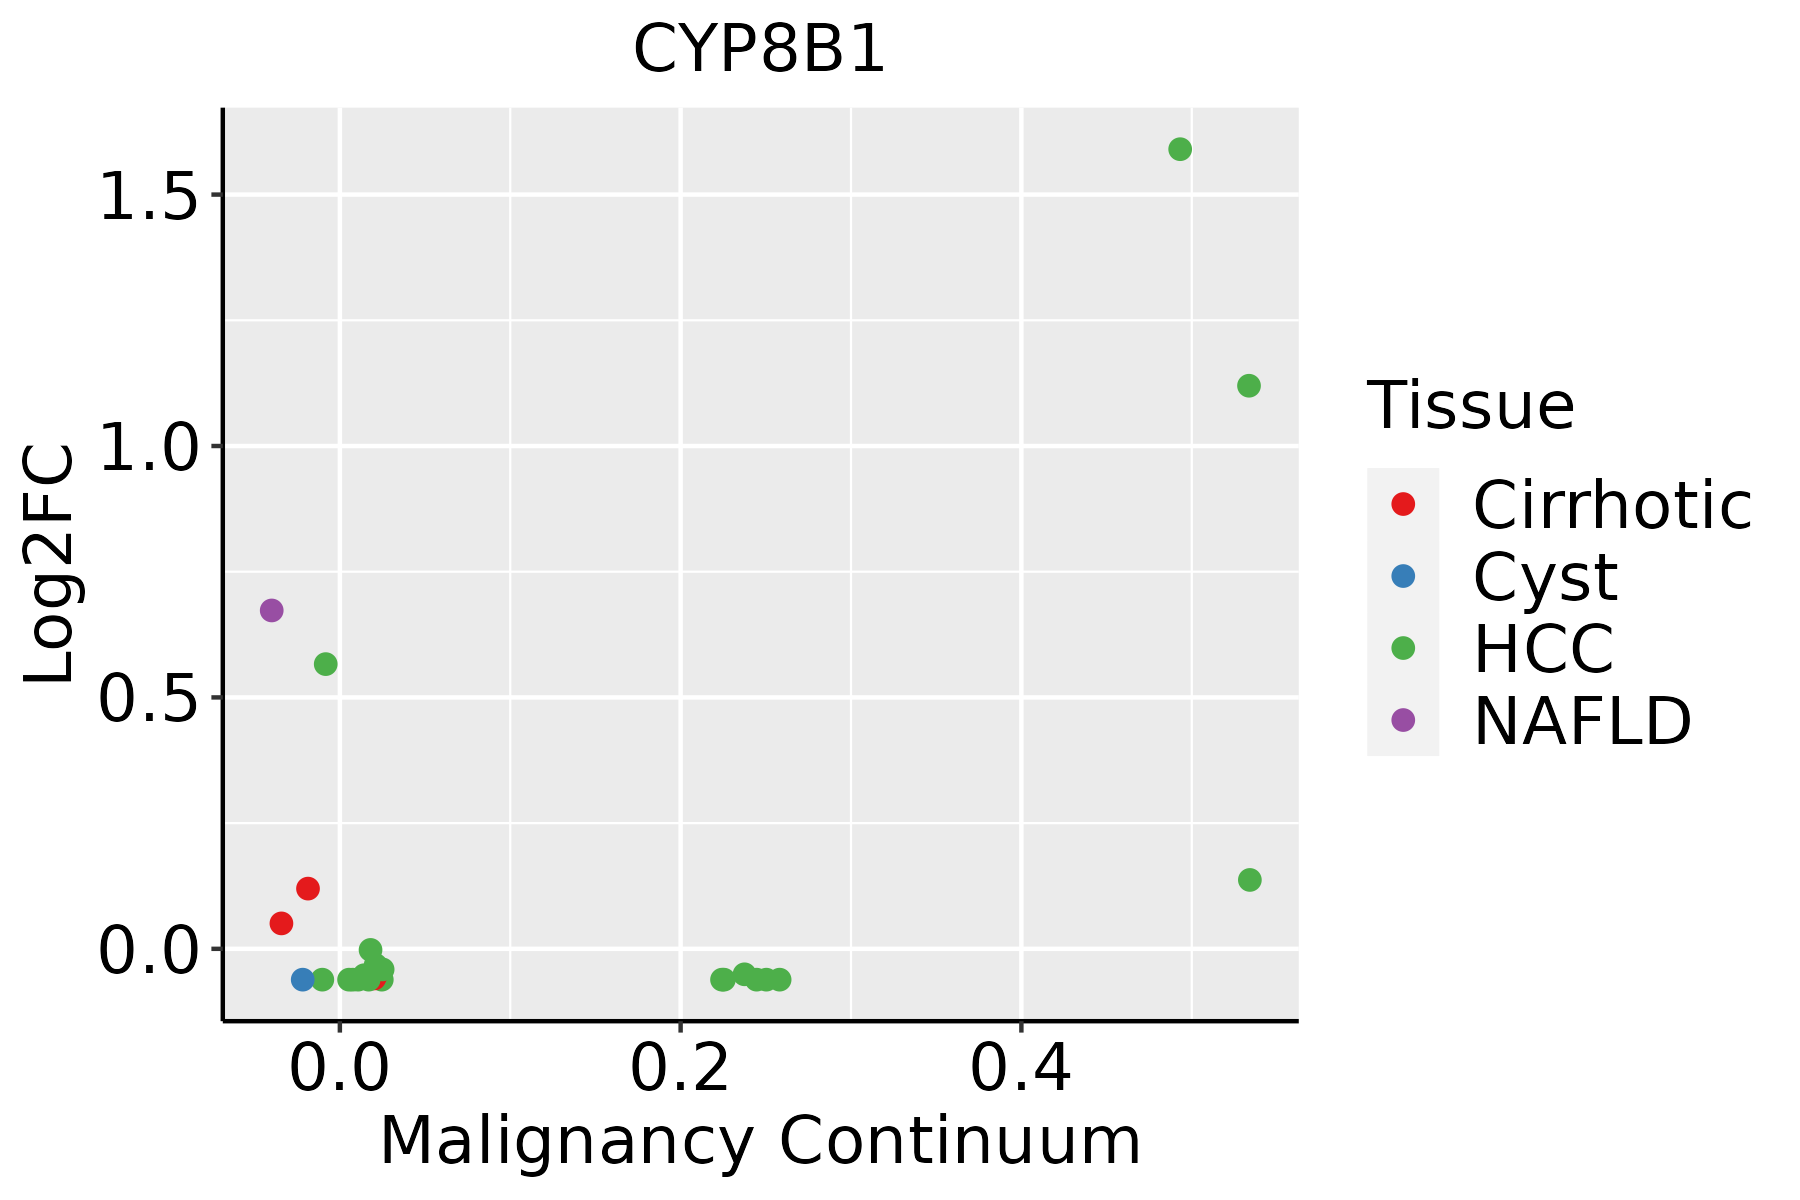 | HCC: Hepatocellular carcinoma |
| NAFLD: Non-alcoholic fatty liver disease |
| ∗log2FC in expression of this searched gene in stem-like cells from each diseased tissue sample relative to stem-like cells in normal samples in each tissue plotted against the malignancy continuum. Samples are colored based on if they are from different disease stage. |
Top |
Malignant transformation related pathway analysis |
| Find out the enriched GO biological processes and KEGG pathways involved in transition from healthy to precancer to cancer |
| Tissue | Disease Stage | Enriched GO biological Processes |
| Colorectum | AD |  |
| Colorectum | SER |  |
| Colorectum | MSS |  |
| Colorectum | MSI-H |  |
| Colorectum | FAP |  |
| ∗Top 15 enriched GO BP terms are showed in the bar plot of each disease state in each tissue. Each row represents a significant GO biological process which is colored according to the -log10(p.adjust). |
| Page: 1 2 3 4 5 6 7 8 9 |
| GO ID | Tissue | Disease Stage | Description | Gene Ratio | Bg Ratio | pvalue | p.adjust | Count |
| GO:00160535 | Liver | NAFLD | organic acid biosynthetic process | 77/1882 | 316/18723 | 1.03e-13 | 6.69e-11 | 77 |
| GO:00463945 | Liver | NAFLD | carboxylic acid biosynthetic process | 75/1882 | 314/18723 | 6.37e-13 | 3.39e-10 | 75 |
| GO:00082023 | Liver | NAFLD | steroid metabolic process | 69/1882 | 319/18723 | 5.90e-10 | 1.28e-07 | 69 |
| GO:00316677 | Liver | NAFLD | response to nutrient levels | 85/1882 | 474/18723 | 8.23e-08 | 7.09e-06 | 85 |
| GO:0008206 | Liver | NAFLD | bile acid metabolic process | 19/1882 | 49/18723 | 9.82e-08 | 7.76e-06 | 19 |
| GO:00108765 | Liver | NAFLD | lipid localization | 79/1882 | 448/18723 | 4.75e-07 | 2.92e-05 | 79 |
| GO:00723303 | Liver | NAFLD | monocarboxylic acid biosynthetic process | 46/1882 | 214/18723 | 5.06e-07 | 3.07e-05 | 46 |
| GO:00303013 | Liver | NAFLD | cholesterol transport | 30/1882 | 117/18723 | 1.08e-06 | 5.40e-05 | 30 |
| GO:00068694 | Liver | NAFLD | lipid transport | 71/1882 | 398/18723 | 1.16e-06 | 5.59e-05 | 71 |
| GO:00159183 | Liver | NAFLD | sterol transport | 32/1882 | 130/18723 | 1.27e-06 | 6.01e-05 | 32 |
| GO:0032373 | Liver | NAFLD | positive regulation of sterol transport | 15/1882 | 38/18723 | 1.68e-06 | 7.43e-05 | 15 |
| GO:0032376 | Liver | NAFLD | positive regulation of cholesterol transport | 15/1882 | 38/18723 | 1.68e-06 | 7.43e-05 | 15 |
| GO:0006699 | Liver | NAFLD | bile acid biosynthetic process | 14/1882 | 36/18723 | 4.59e-06 | 1.75e-04 | 14 |
| GO:0016125 | Liver | NAFLD | sterol metabolic process | 34/1882 | 152/18723 | 6.02e-06 | 2.11e-04 | 34 |
| GO:0015850 | Liver | NAFLD | organic hydroxy compound transport | 50/1882 | 284/18723 | 6.01e-05 | 1.32e-03 | 50 |
| GO:0032371 | Liver | NAFLD | regulation of sterol transport | 20/1882 | 78/18723 | 6.46e-05 | 1.39e-03 | 20 |
| GO:0032374 | Liver | NAFLD | regulation of cholesterol transport | 20/1882 | 78/18723 | 6.46e-05 | 1.39e-03 | 20 |
| GO:00066943 | Liver | NAFLD | steroid biosynthetic process | 34/1882 | 173/18723 | 1.01e-04 | 2.02e-03 | 34 |
| GO:19044781 | Liver | NAFLD | regulation of intestinal absorption | 7/1882 | 13/18723 | 1.02e-04 | 2.02e-03 | 7 |
| GO:0030300 | Liver | NAFLD | regulation of intestinal cholesterol absorption | 6/1882 | 10/18723 | 1.50e-04 | 2.78e-03 | 6 |
| Page: 1 2 3 |
| Pathway ID | Tissue | Disease Stage | Description | Gene Ratio | Bg Ratio | pvalue | p.adjust | qvalue | Count |
| hsa033206 | Liver | NAFLD | PPAR signaling pathway | 25/1043 | 75/8465 | 1.61e-06 | 6.62e-05 | 5.33e-05 | 25 |
| hsa00120 | Liver | NAFLD | Primary bile acid biosynthesis | 9/1043 | 17/8465 | 6.10e-05 | 1.33e-03 | 1.07e-03 | 9 |
| hsa0332011 | Liver | NAFLD | PPAR signaling pathway | 25/1043 | 75/8465 | 1.61e-06 | 6.62e-05 | 5.33e-05 | 25 |
| hsa001201 | Liver | NAFLD | Primary bile acid biosynthesis | 9/1043 | 17/8465 | 6.10e-05 | 1.33e-03 | 1.07e-03 | 9 |
| hsa033204 | Liver | HCC | PPAR signaling pathway | 48/4020 | 75/8465 | 2.83e-03 | 9.37e-03 | 5.21e-03 | 48 |
| hsa033205 | Liver | HCC | PPAR signaling pathway | 48/4020 | 75/8465 | 2.83e-03 | 9.37e-03 | 5.21e-03 | 48 |
| Page: 1 |
Top |
Cell-cell communication analysis |
| Identification of potential cell-cell interactions between two cell types and their ligand-receptor pairs for different disease states |
| Ligand | Receptor | LRpair | Pathway | Tissue | Disease Stage |
| Page: 1 |
Top |
Single-cell gene regulatory network inference analysis |
| Find out the significant the regulons (TFs) and the target genes of each regulon across cell types for different disease states |
| TF | Cell Type | Tissue | Disease Stage | Target Gene | RSS | Regulon Activity |
| ∗The dot plots of a searched regulon are shown for all cell subpopulations in each disease state of each tissue based on the regulon specific score inferred using pySCENIC and by calculating the average expression. |
| Page: 1 |
Top |
Somatic mutation of malignant transformation related genes |
| Annotation of somatic variants for genes involved in malignant transformation |
| Hugo Symbol | Variant Class | Variant Classification | dbSNP RS | HGVSc | HGVSp | HGVSp Short | SWISSPROT | BIOTYPE | SIFT | PolyPhen | Tumor Sample Barcode | Tissue | Histology | Sex | Age | Stage | Therapy Types | Drugs | Outcome |
| CYP8B1 | SNV | Missense_Mutation | rs766151616 | c.1390N>C | p.Glu464Gln | p.E464Q | Q9UNU6 | protein_coding | deleterious(0.02) | probably_damaging(0.982) | TCGA-AC-A23H-01 | Breast | breast invasive carcinoma | Female | >=65 | I/II | Unknown | Unknown | PD |
| CYP8B1 | SNV | Missense_Mutation | c.1181N>T | p.Pro394Leu | p.P394L | Q9UNU6 | protein_coding | deleterious(0) | probably_damaging(0.999) | TCGA-D8-A1JK-01 | Breast | breast invasive carcinoma | Female | >=65 | I/II | Unknown | Unknown | SD | |
| CYP8B1 | SNV | Missense_Mutation | c.242T>G | p.Met81Arg | p.M81R | Q9UNU6 | protein_coding | deleterious(0) | possibly_damaging(0.579) | TCGA-EW-A1PB-01 | Breast | breast invasive carcinoma | Female | >=65 | III/IV | Unknown | Unknown | SD | |
| CYP8B1 | SNV | Missense_Mutation | c.7N>T | p.Leu3Phe | p.L3F | Q9UNU6 | protein_coding | tolerated(0.36) | benign(0.007) | TCGA-EK-A2PG-01 | Cervix | cervical & endocervical cancer | Female | >=65 | I/II | Unknown | Unknown | SD | |
| CYP8B1 | SNV | Missense_Mutation | c.401N>G | p.Asp134Gly | p.D134G | Q9UNU6 | protein_coding | tolerated(0.06) | benign(0.035) | TCGA-A6-3809-01 | Colorectum | colon adenocarcinoma | Female | >=65 | I/II | Unknown | Unknown | SD | |
| CYP8B1 | SNV | Missense_Mutation | novel | c.1406N>G | p.Asp469Gly | p.D469G | Q9UNU6 | protein_coding | tolerated(0.07) | benign(0.069) | TCGA-AA-A00N-01 | Colorectum | colon adenocarcinoma | Male | >=65 | I/II | Unknown | Unknown | PD |
| CYP8B1 | SNV | Missense_Mutation | rs779913482 | c.77N>A | p.Arg26Gln | p.R26Q | Q9UNU6 | protein_coding | deleterious(0) | probably_damaging(0.991) | TCGA-AA-A00N-01 | Colorectum | colon adenocarcinoma | Male | >=65 | I/II | Unknown | Unknown | PD |
| CYP8B1 | SNV | Missense_Mutation | novel | c.416T>G | p.Leu139Arg | p.L139R | Q9UNU6 | protein_coding | deleterious(0) | probably_damaging(0.991) | TCGA-AA-A010-01 | Colorectum | colon adenocarcinoma | Female | <65 | I/II | Chemotherapy | folinic | CR |
| CYP8B1 | SNV | Missense_Mutation | rs771278880 | c.1435N>T | p.Arg479Cys | p.R479C | Q9UNU6 | protein_coding | deleterious(0) | probably_damaging(1) | TCGA-AZ-4315-01 | Colorectum | colon adenocarcinoma | Male | <65 | I/II | Unknown | Unknown | SD |
| CYP8B1 | SNV | Missense_Mutation | novel | c.616N>A | p.Phe206Ile | p.F206I | Q9UNU6 | protein_coding | deleterious(0) | probably_damaging(0.994) | TCGA-CA-6717-01 | Colorectum | colon adenocarcinoma | Male | <65 | I/II | Chemotherapy | oxaliplatin | CR |
| Page: 1 2 3 4 5 6 |
Top |
Related drugs of malignant transformation related genes |
| Identification of chemicals and drugs interact with genes involved in malignant transfromation |
| (DGIdb 4.0) |
| Entrez ID | Symbol | Category | Interaction Types | Drug Claim Name | Drug Name | PMIDs |
| Page: 1 |

Copyright 2023-Present -The University of Texas Health Science Center at Houston |