
|
|||||
|
 | |
| |
| |
| |
| |
| |
|
Gene: CYP51A1 |
Gene summary for CYP51A1 |
| Gene information | Species | Human | Gene symbol | CYP51A1 | Gene ID | 1595 |
| Gene name | cytochrome P450 family 51 subfamily A member 1 | |
| Gene Alias | CP51 | |
| Cytomap | 7q21.2 | |
| Gene Type | protein-coding | GO ID | GO:0006066 | UniProtAcc | A0A0C4DFL7 |
Top |
Malignant transformation analysis |
| Identification of the aberrant gene expression in precancerous and cancerous lesions by comparing the gene expression of stem-like cells in diseased tissues with normal stem cells |
| Entrez ID | Symbol | Replicates | Species | Organ | Tissue | Adj P-value | Log2FC | Malignancy |
| 1595 | CYP51A1 | AEH-subject1 | Human | Endometrium | AEH | 6.40e-03 | 1.80e-01 | -0.3059 |
| 1595 | CYP51A1 | AEH-subject3 | Human | Endometrium | AEH | 1.85e-03 | 1.71e-01 | -0.2576 |
| 1595 | CYP51A1 | AEH-subject4 | Human | Endometrium | AEH | 7.75e-08 | 3.46e-01 | -0.2657 |
| 1595 | CYP51A1 | AEH-subject5 | Human | Endometrium | AEH | 4.58e-37 | 6.82e-01 | -0.2953 |
| 1595 | CYP51A1 | EEC-subject1 | Human | Endometrium | EEC | 5.82e-09 | 3.17e-01 | -0.2682 |
| 1595 | CYP51A1 | EEC-subject3 | Human | Endometrium | EEC | 2.80e-02 | 1.68e-01 | -0.2525 |
| 1595 | CYP51A1 | EEC-subject4 | Human | Endometrium | EEC | 1.79e-14 | 3.76e-01 | -0.2571 |
| 1595 | CYP51A1 | EEC-subject5 | Human | Endometrium | EEC | 2.05e-12 | 3.53e-01 | -0.249 |
| 1595 | CYP51A1 | LZE2T | Human | Esophagus | ESCC | 9.54e-06 | 5.62e-01 | 0.082 |
| 1595 | CYP51A1 | LZE4T | Human | Esophagus | ESCC | 4.82e-28 | 7.71e-01 | 0.0811 |
| 1595 | CYP51A1 | LZE5T | Human | Esophagus | ESCC | 1.40e-06 | 6.52e-01 | 0.0514 |
| 1595 | CYP51A1 | LZE7T | Human | Esophagus | ESCC | 3.42e-17 | 9.79e-01 | 0.0667 |
| 1595 | CYP51A1 | LZE8T | Human | Esophagus | ESCC | 2.36e-06 | 2.55e-01 | 0.067 |
| 1595 | CYP51A1 | LZE20T | Human | Esophagus | ESCC | 1.74e-07 | 2.51e-01 | 0.0662 |
| 1595 | CYP51A1 | LZE21D1 | Human | Esophagus | HGIN | 4.41e-04 | 4.25e-01 | 0.0632 |
| 1595 | CYP51A1 | LZE22D1 | Human | Esophagus | HGIN | 3.26e-02 | 1.63e-01 | 0.0595 |
| 1595 | CYP51A1 | LZE22T | Human | Esophagus | ESCC | 6.95e-12 | 7.78e-01 | 0.068 |
| 1595 | CYP51A1 | LZE24T | Human | Esophagus | ESCC | 2.33e-28 | 6.64e-01 | 0.0596 |
| 1595 | CYP51A1 | LZE21T | Human | Esophagus | ESCC | 2.27e-11 | 6.39e-01 | 0.0655 |
| 1595 | CYP51A1 | LZE6T | Human | Esophagus | ESCC | 9.07e-08 | 2.96e-01 | 0.0845 |
| Page: 1 2 3 4 5 6 |
| Tissue | Expression Dynamics | Abbreviation |
| Endometrium | 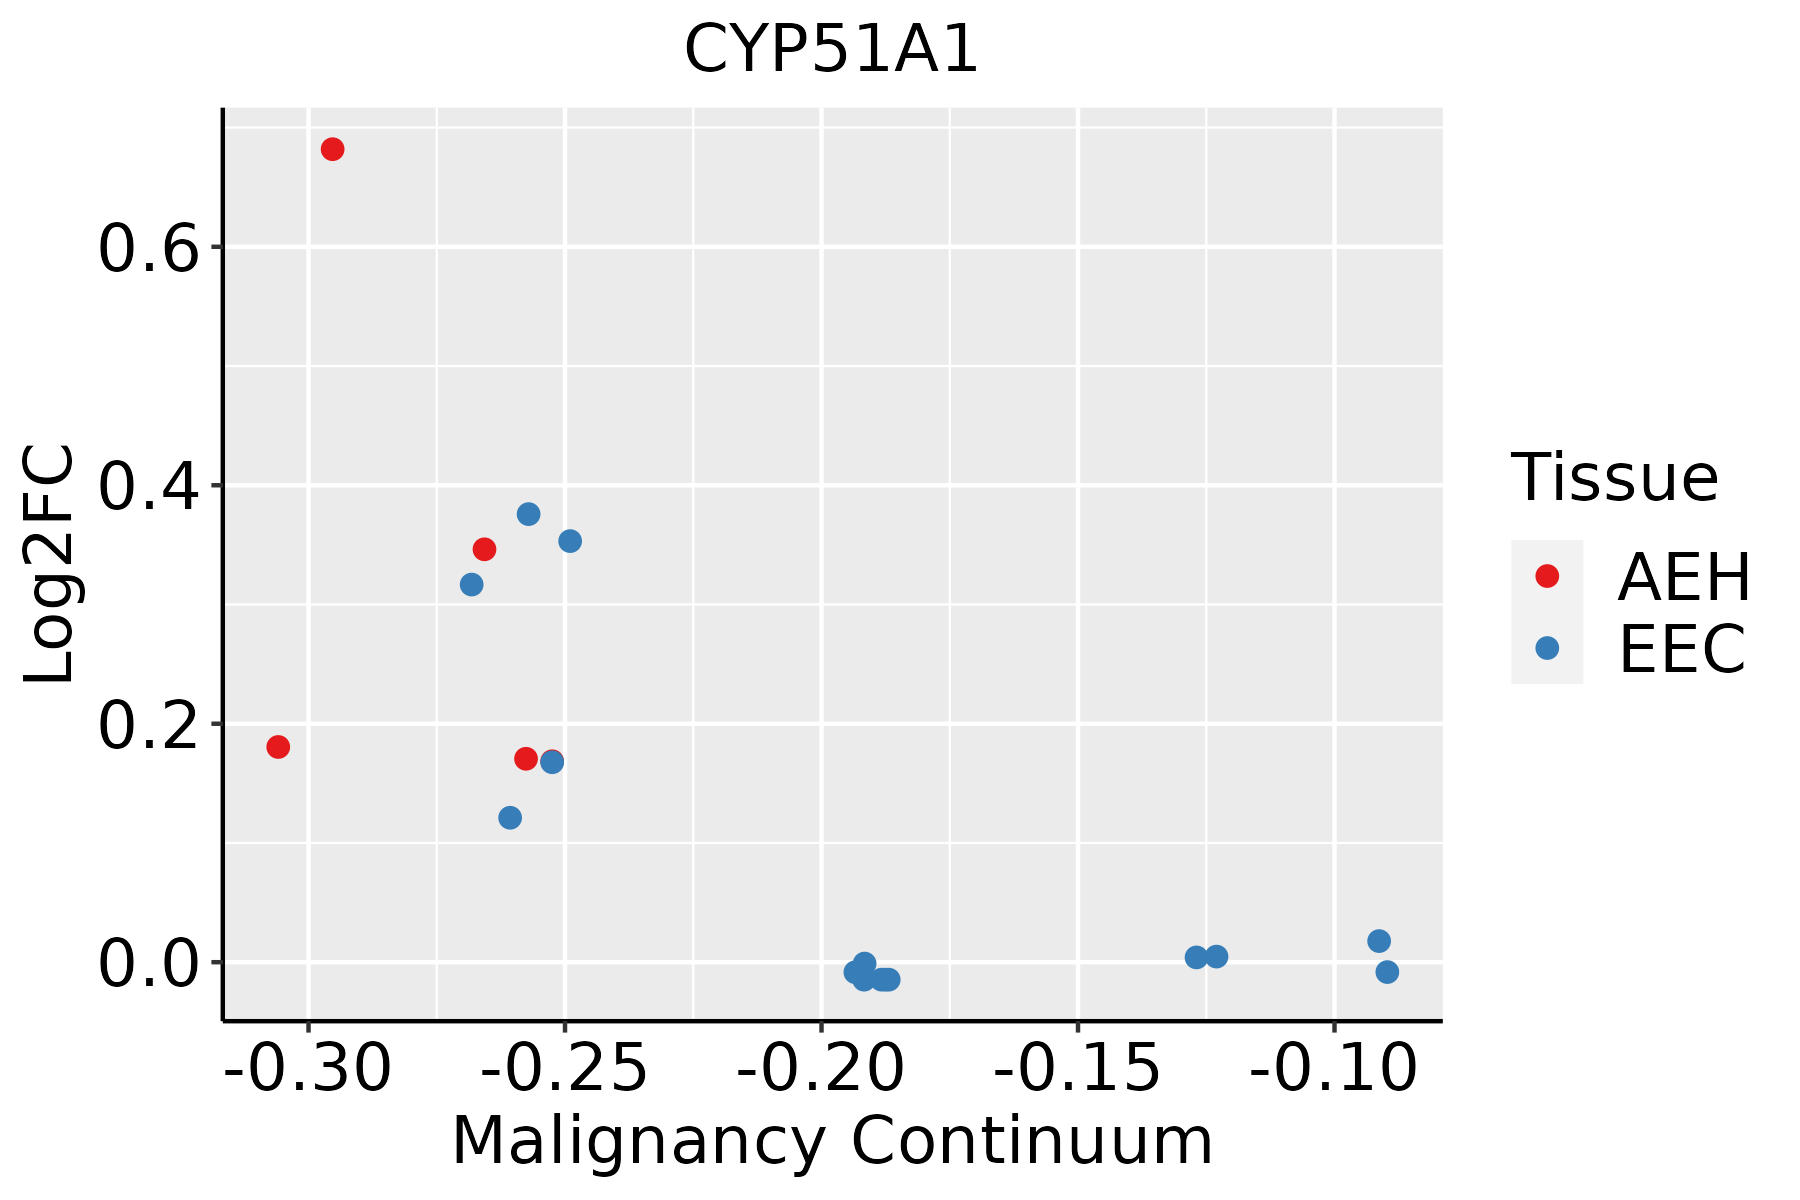 | AEH: Atypical endometrial hyperplasia |
| EEC: Endometrioid Cancer | ||
| Esophagus |  | ESCC: Esophageal squamous cell carcinoma |
| HGIN: High-grade intraepithelial neoplasias | ||
| LGIN: Low-grade intraepithelial neoplasias | ||
| Liver | 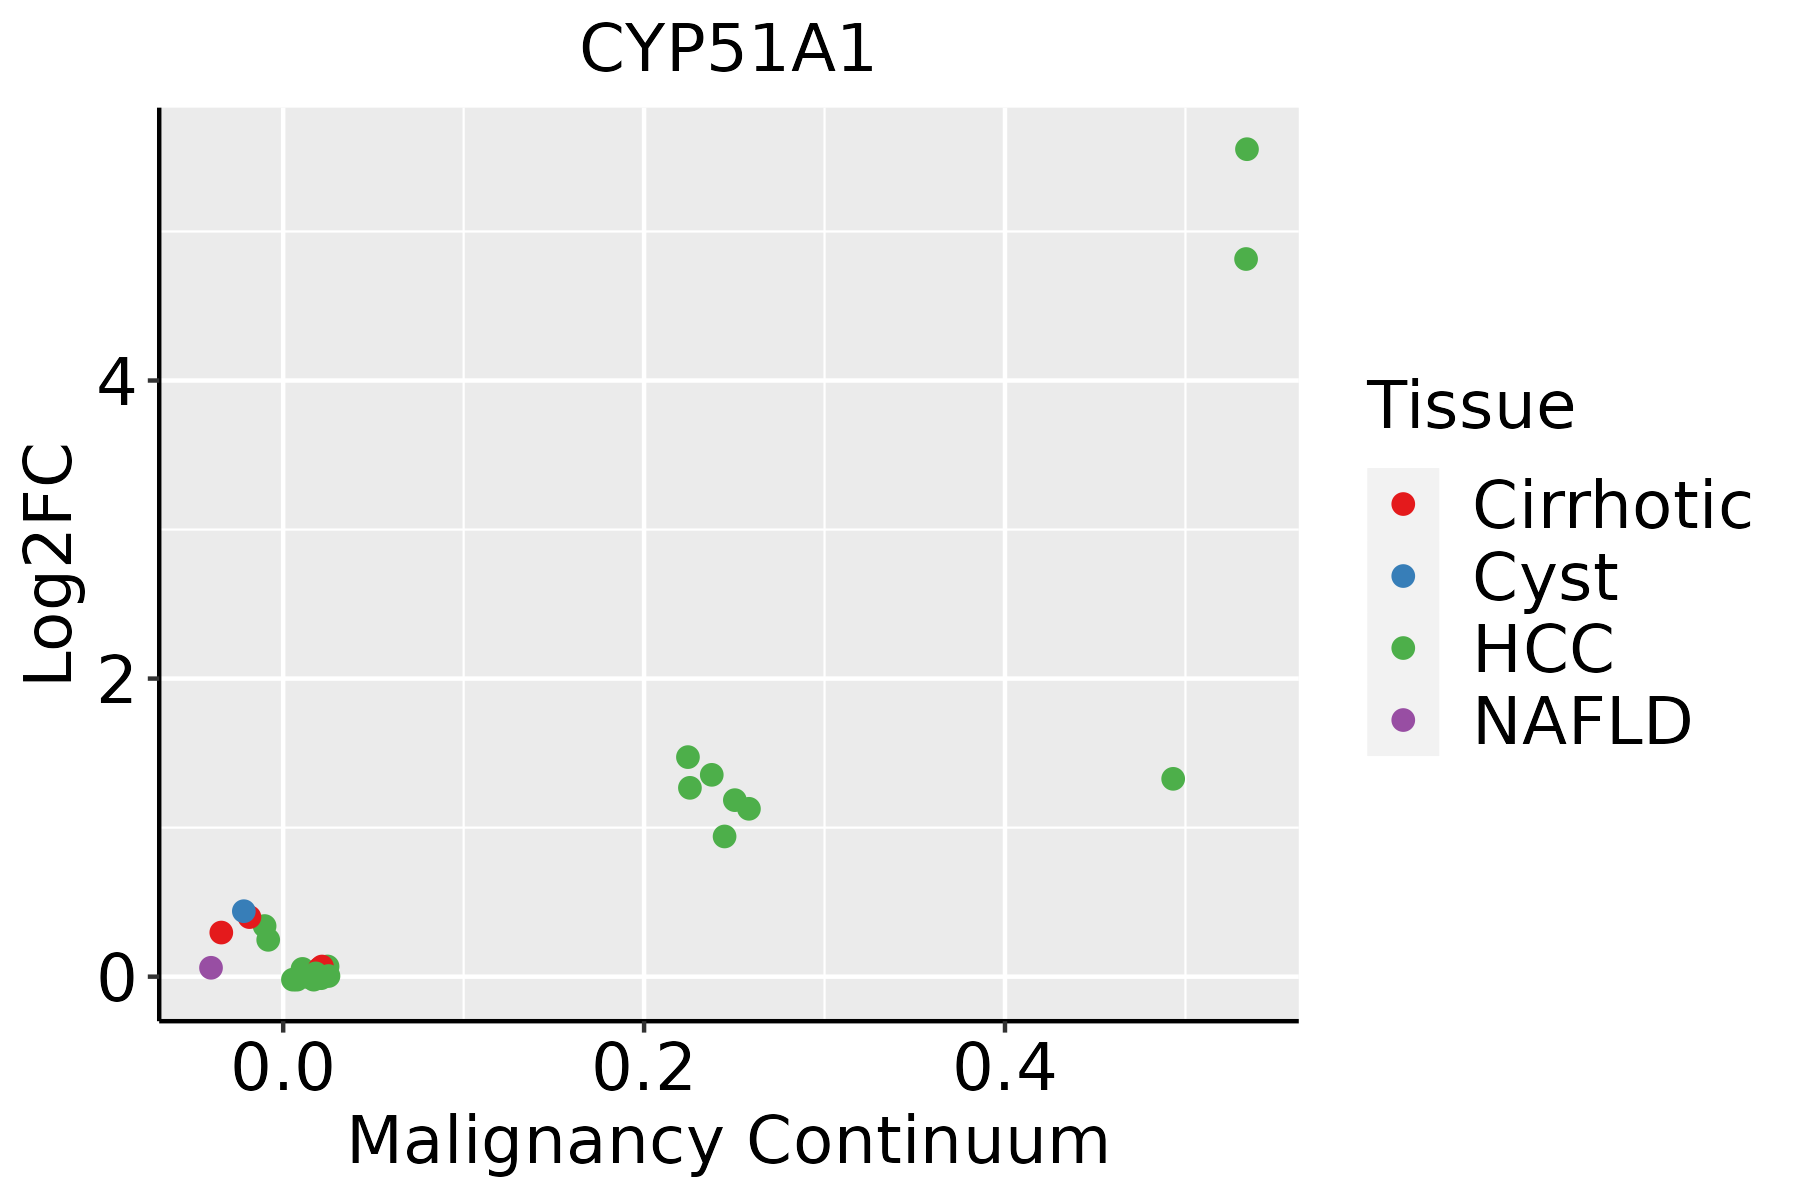 | HCC: Hepatocellular carcinoma |
| NAFLD: Non-alcoholic fatty liver disease | ||
| Lung |  | AAH: Atypical adenomatous hyperplasia |
| AIS: Adenocarcinoma in situ | ||
| IAC: Invasive lung adenocarcinoma | ||
| MIA: Minimally invasive adenocarcinoma | ||
| Thyroid |  | ATC: Anaplastic thyroid cancer |
| HT: Hashimoto's thyroiditis | ||
| PTC: Papillary thyroid cancer |
| ∗log2FC in expression of this searched gene in stem-like cells from each diseased tissue sample relative to stem-like cells in normal samples in each tissue plotted against the malignancy continuum. Samples are colored based on if they are from different disease stage. |
Top |
Malignant transformation related pathway analysis |
| Find out the enriched GO biological processes and KEGG pathways involved in transition from healthy to precancer to cancer |
| Tissue | Disease Stage | Enriched GO biological Processes |
| Colorectum | AD |  |
| Colorectum | SER |  |
| Colorectum | MSS |  |
| Colorectum | MSI-H |  |
| Colorectum | FAP |  |
| ∗Top 15 enriched GO BP terms are showed in the bar plot of each disease state in each tissue. Each row represents a significant GO biological process which is colored according to the -log10(p.adjust). |
| Page: 1 2 3 4 5 6 7 8 9 |
| GO ID | Tissue | Disease Stage | Description | Gene Ratio | Bg Ratio | pvalue | p.adjust | Count |
| GO:004217616 | Endometrium | AEH | regulation of protein catabolic process | 100/2100 | 391/18723 | 9.58e-16 | 3.59e-13 | 100 |
| GO:004217715 | Endometrium | AEH | negative regulation of protein catabolic process | 34/2100 | 121/18723 | 2.67e-07 | 1.17e-05 | 34 |
| GO:000989515 | Endometrium | AEH | negative regulation of catabolic process | 60/2100 | 320/18723 | 4.32e-05 | 7.28e-04 | 60 |
| GO:00510515 | Endometrium | AEH | negative regulation of transport | 79/2100 | 470/18723 | 1.51e-04 | 1.99e-03 | 79 |
| GO:00507087 | Endometrium | AEH | regulation of protein secretion | 49/2100 | 268/18723 | 3.83e-04 | 4.12e-03 | 49 |
| GO:00716927 | Endometrium | AEH | protein localization to extracellular region | 58/2100 | 368/18723 | 4.72e-03 | 3.00e-02 | 58 |
| GO:00093068 | Endometrium | AEH | protein secretion | 56/2100 | 359/18723 | 6.71e-03 | 3.94e-02 | 56 |
| GO:00355928 | Endometrium | AEH | establishment of protein localization to extracellular region | 56/2100 | 360/18723 | 7.10e-03 | 4.09e-02 | 56 |
| GO:00972423 | Endometrium | AEH | amyloid-beta clearance | 10/2100 | 38/18723 | 7.62e-03 | 4.31e-02 | 10 |
| GO:004217617 | Endometrium | EEC | regulation of protein catabolic process | 103/2168 | 391/18723 | 3.54e-16 | 1.52e-13 | 103 |
| GO:004217716 | Endometrium | EEC | negative regulation of protein catabolic process | 35/2168 | 121/18723 | 1.79e-07 | 8.20e-06 | 35 |
| GO:000989516 | Endometrium | EEC | negative regulation of catabolic process | 61/2168 | 320/18723 | 5.76e-05 | 8.97e-04 | 61 |
| GO:005105111 | Endometrium | EEC | negative regulation of transport | 80/2168 | 470/18723 | 2.53e-04 | 2.93e-03 | 80 |
| GO:005070813 | Endometrium | EEC | regulation of protein secretion | 50/2168 | 268/18723 | 4.33e-04 | 4.51e-03 | 50 |
| GO:009724211 | Endometrium | EEC | amyloid-beta clearance | 11/2168 | 38/18723 | 3.00e-03 | 2.10e-02 | 11 |
| GO:007169213 | Endometrium | EEC | protein localization to extracellular region | 59/2168 | 368/18723 | 5.98e-03 | 3.56e-02 | 59 |
| GO:000930614 | Endometrium | EEC | protein secretion | 57/2168 | 359/18723 | 8.30e-03 | 4.57e-02 | 57 |
| GO:003559214 | Endometrium | EEC | establishment of protein localization to extracellular region | 57/2168 | 360/18723 | 8.78e-03 | 4.74e-02 | 57 |
| GO:004217627 | Esophagus | HGIN | regulation of protein catabolic process | 119/2587 | 391/18723 | 8.09e-18 | 2.43e-15 | 119 |
| GO:000989520 | Esophagus | HGIN | negative regulation of catabolic process | 87/2587 | 320/18723 | 1.74e-10 | 1.68e-08 | 87 |
| Page: 1 2 3 4 5 6 |
| Pathway ID | Tissue | Disease Stage | Description | Gene Ratio | Bg Ratio | pvalue | p.adjust | qvalue | Count |
| Page: 1 |
Top |
Cell-cell communication analysis |
| Identification of potential cell-cell interactions between two cell types and their ligand-receptor pairs for different disease states |
| Ligand | Receptor | LRpair | Pathway | Tissue | Disease Stage |
| Page: 1 |
Top |
Single-cell gene regulatory network inference analysis |
| Find out the significant the regulons (TFs) and the target genes of each regulon across cell types for different disease states |
| TF | Cell Type | Tissue | Disease Stage | Target Gene | RSS | Regulon Activity |
| ∗The dot plots of a searched regulon are shown for all cell subpopulations in each disease state of each tissue based on the regulon specific score inferred using pySCENIC and by calculating the average expression. |
| Page: 1 |
Top |
Somatic mutation of malignant transformation related genes |
| Annotation of somatic variants for genes involved in malignant transformation |
| Hugo Symbol | Variant Class | Variant Classification | dbSNP RS | HGVSc | HGVSp | HGVSp Short | SWISSPROT | BIOTYPE | SIFT | PolyPhen | Tumor Sample Barcode | Tissue | Histology | Sex | Age | Stage | Therapy Types | Drugs | Outcome |
| CYP51A1 | SNV | Missense_Mutation | rs746098957 | c.1271G>A | p.Arg424His | p.R424H | protein_coding | tolerated(0.14) | benign(0.389) | TCGA-AN-A046-01 | Breast | breast invasive carcinoma | Female | >=65 | I/II | Unknown | Unknown | SD | |
| CYP51A1 | SNV | Missense_Mutation | rs376034553 | c.1111C>T | p.Arg371Cys | p.R371C | protein_coding | tolerated(0.16) | benign(0.04) | TCGA-AN-A046-01 | Breast | breast invasive carcinoma | Female | >=65 | I/II | Unknown | Unknown | SD | |
| CYP51A1 | SNV | Missense_Mutation | c.1093N>T | p.Asp365Tyr | p.D365Y | protein_coding | deleterious(0) | possibly_damaging(0.639) | TCGA-C8-A26Y-01 | Breast | breast invasive carcinoma | Female | >=65 | I/II | Unknown | Unknown | SD | ||
| CYP51A1 | SNV | Missense_Mutation | novel | c.1395T>G | p.Ile465Met | p.I465M | protein_coding | deleterious(0.05) | probably_damaging(0.927) | TCGA-GI-A2C9-01 | Breast | breast invasive carcinoma | Female | <65 | I/II | Unspecific | SD | ||
| CYP51A1 | SNV | Missense_Mutation | novel | c.1243C>G | p.Gln415Glu | p.Q415E | protein_coding | deleterious(0.01) | benign(0.247) | TCGA-LD-A74U-01 | Breast | breast invasive carcinoma | Female | >=65 | III/IV | Chemotherapy | taxotere | SD | |
| CYP51A1 | deletion | Frame_Shift_Del | novel | c.7delN | p.Ala3ArgfsTer25 | p.A3Rfs*25 | protein_coding | TCGA-EW-A2FV-01 | Breast | breast invasive carcinoma | Female | <65 | III/IV | Chemotherapy | docetaxel | SD | |||
| CYP51A1 | SNV | Missense_Mutation | novel | c.1152G>T | p.Met384Ile | p.M384I | protein_coding | tolerated(0.33) | benign(0.083) | TCGA-A6-6650-01 | Colorectum | colon adenocarcinoma | Female | >=65 | I/II | Unknown | Unknown | SD | |
| CYP51A1 | SNV | Missense_Mutation | rs776540678 | c.1517G>A | p.Arg506Gln | p.R506Q | protein_coding | deleterious(0.04) | benign(0.085) | TCGA-AA-3977-01 | Colorectum | colon adenocarcinoma | Male | >=65 | I/II | Unknown | Unknown | SD | |
| CYP51A1 | SNV | Missense_Mutation | c.1237N>A | p.Val413Ile | p.V413I | protein_coding | tolerated(0.24) | benign(0.013) | TCGA-AD-5900-01 | Colorectum | colon adenocarcinoma | Male | >=65 | I/II | Unknown | Unknown | SD | ||
| CYP51A1 | SNV | Missense_Mutation | rs542915180 | c.1361N>A | p.Arg454His | p.R454H | protein_coding | deleterious(0) | probably_damaging(0.998) | TCGA-AZ-4313-01 | Colorectum | colon adenocarcinoma | Female | <65 | I/II | Unknown | Unknown | SD |
| Page: 1 2 3 4 5 |
Top |
Related drugs of malignant transformation related genes |
| Identification of chemicals and drugs interact with genes involved in malignant transfromation |
| (DGIdb 4.0) |
| Entrez ID | Symbol | Category | Interaction Types | Drug Claim Name | Drug Name | PMIDs |
| 1595 | CYP51A1 | DRUGGABLE GENOME, CYTOCHROME P450, ENZYME | inhibitor | 252827457 | AZALANSTAT | |
| 1595 | CYP51A1 | DRUGGABLE GENOME, CYTOCHROME P450, ENZYME | VT-1129 | |||
| 1595 | CYP51A1 | DRUGGABLE GENOME, CYTOCHROME P450, ENZYME | FLUCONAZOLE | FLUCONAZOLE | 12116245 | |
| 1595 | CYP51A1 | DRUGGABLE GENOME, CYTOCHROME P450, ENZYME | inhibitor | 387065625 |
| Page: 1 |

Copyright 2023-Present -The University of Texas Health Science Center at Houston |