
|
|||||
|
 | |
| |
| |
| |
| |
| |
|
Gene: CYP4X1 |
Gene summary for CYP4X1 |
| Gene information | Species | Human | Gene symbol | CYP4X1 | Gene ID | 260293 |
| Gene name | cytochrome P450 family 4 subfamily X member 1 | |
| Gene Alias | CYPIVX1 | |
| Cytomap | 1p33 | |
| Gene Type | protein-coding | GO ID | GO:0005575 | UniProtAcc | Q8N118 |
Top |
Malignant transformation analysis |
| Identification of the aberrant gene expression in precancerous and cancerous lesions by comparing the gene expression of stem-like cells in diseased tissues with normal stem cells |
| Entrez ID | Symbol | Replicates | Species | Organ | Tissue | Adj P-value | Log2FC | Malignancy |
| 260293 | CYP4X1 | HTA11_866_3004761011 | Human | Colorectum | AD | 8.57e-08 | 3.42e-01 | 0.096 |
| 260293 | CYP4X1 | HTA11_7696_3000711011 | Human | Colorectum | AD | 1.70e-08 | 2.02e-01 | 0.0674 |
| 260293 | CYP4X1 | HTA11_99999970781_79442 | Human | Colorectum | MSS | 3.35e-29 | 7.96e-01 | 0.294 |
| 260293 | CYP4X1 | A002-C-010 | Human | Colorectum | FAP | 5.22e-03 | 2.62e-01 | 0.242 |
| 260293 | CYP4X1 | A002-C-021 | Human | Colorectum | FAP | 5.06e-20 | 5.09e-01 | 0.1171 |
| 260293 | CYP4X1 | LZE8T | Human | Esophagus | ESCC | 1.59e-10 | 4.35e-01 | 0.067 |
| 260293 | CYP4X1 | LZE24T | Human | Esophagus | ESCC | 9.35e-16 | 6.72e-01 | 0.0596 |
| 260293 | CYP4X1 | P2T-E | Human | Esophagus | ESCC | 2.34e-20 | 4.89e-01 | 0.1177 |
| 260293 | CYP4X1 | P4T-E | Human | Esophagus | ESCC | 2.89e-02 | 2.22e-02 | 0.1323 |
| 260293 | CYP4X1 | P8T-E | Human | Esophagus | ESCC | 6.59e-23 | 4.26e-01 | 0.0889 |
| 260293 | CYP4X1 | P16T-E | Human | Esophagus | ESCC | 2.48e-04 | -1.07e-02 | 0.1153 |
| 260293 | CYP4X1 | P20T-E | Human | Esophagus | ESCC | 1.96e-24 | 6.94e-01 | 0.1124 |
| 260293 | CYP4X1 | P22T-E | Human | Esophagus | ESCC | 1.22e-06 | 6.65e-02 | 0.1236 |
| 260293 | CYP4X1 | P23T-E | Human | Esophagus | ESCC | 2.56e-03 | 6.38e-02 | 0.108 |
| 260293 | CYP4X1 | P27T-E | Human | Esophagus | ESCC | 6.83e-13 | 2.93e-01 | 0.1055 |
| 260293 | CYP4X1 | P28T-E | Human | Esophagus | ESCC | 2.45e-02 | -5.20e-02 | 0.1149 |
| 260293 | CYP4X1 | P32T-E | Human | Esophagus | ESCC | 2.34e-02 | -5.66e-02 | 0.1666 |
| 260293 | CYP4X1 | P40T-E | Human | Esophagus | ESCC | 6.26e-04 | 1.54e-01 | 0.109 |
| 260293 | CYP4X1 | P42T-E | Human | Esophagus | ESCC | 8.24e-10 | 4.30e-01 | 0.1175 |
| 260293 | CYP4X1 | P48T-E | Human | Esophagus | ESCC | 3.26e-13 | 2.44e-01 | 0.0959 |
| Page: 1 2 |
| Tissue | Expression Dynamics | Abbreviation |
| Colorectum (GSE201348) |  | FAP: Familial adenomatous polyposis |
| CRC: Colorectal cancer | ||
| Colorectum (HTA11) |  | AD: Adenomas |
| SER: Sessile serrated lesions | ||
| MSI-H: Microsatellite-high colorectal cancer | ||
| MSS: Microsatellite stable colorectal cancer | ||
| Esophagus |  | ESCC: Esophageal squamous cell carcinoma |
| HGIN: High-grade intraepithelial neoplasias | ||
| LGIN: Low-grade intraepithelial neoplasias | ||
| Oral Cavity | 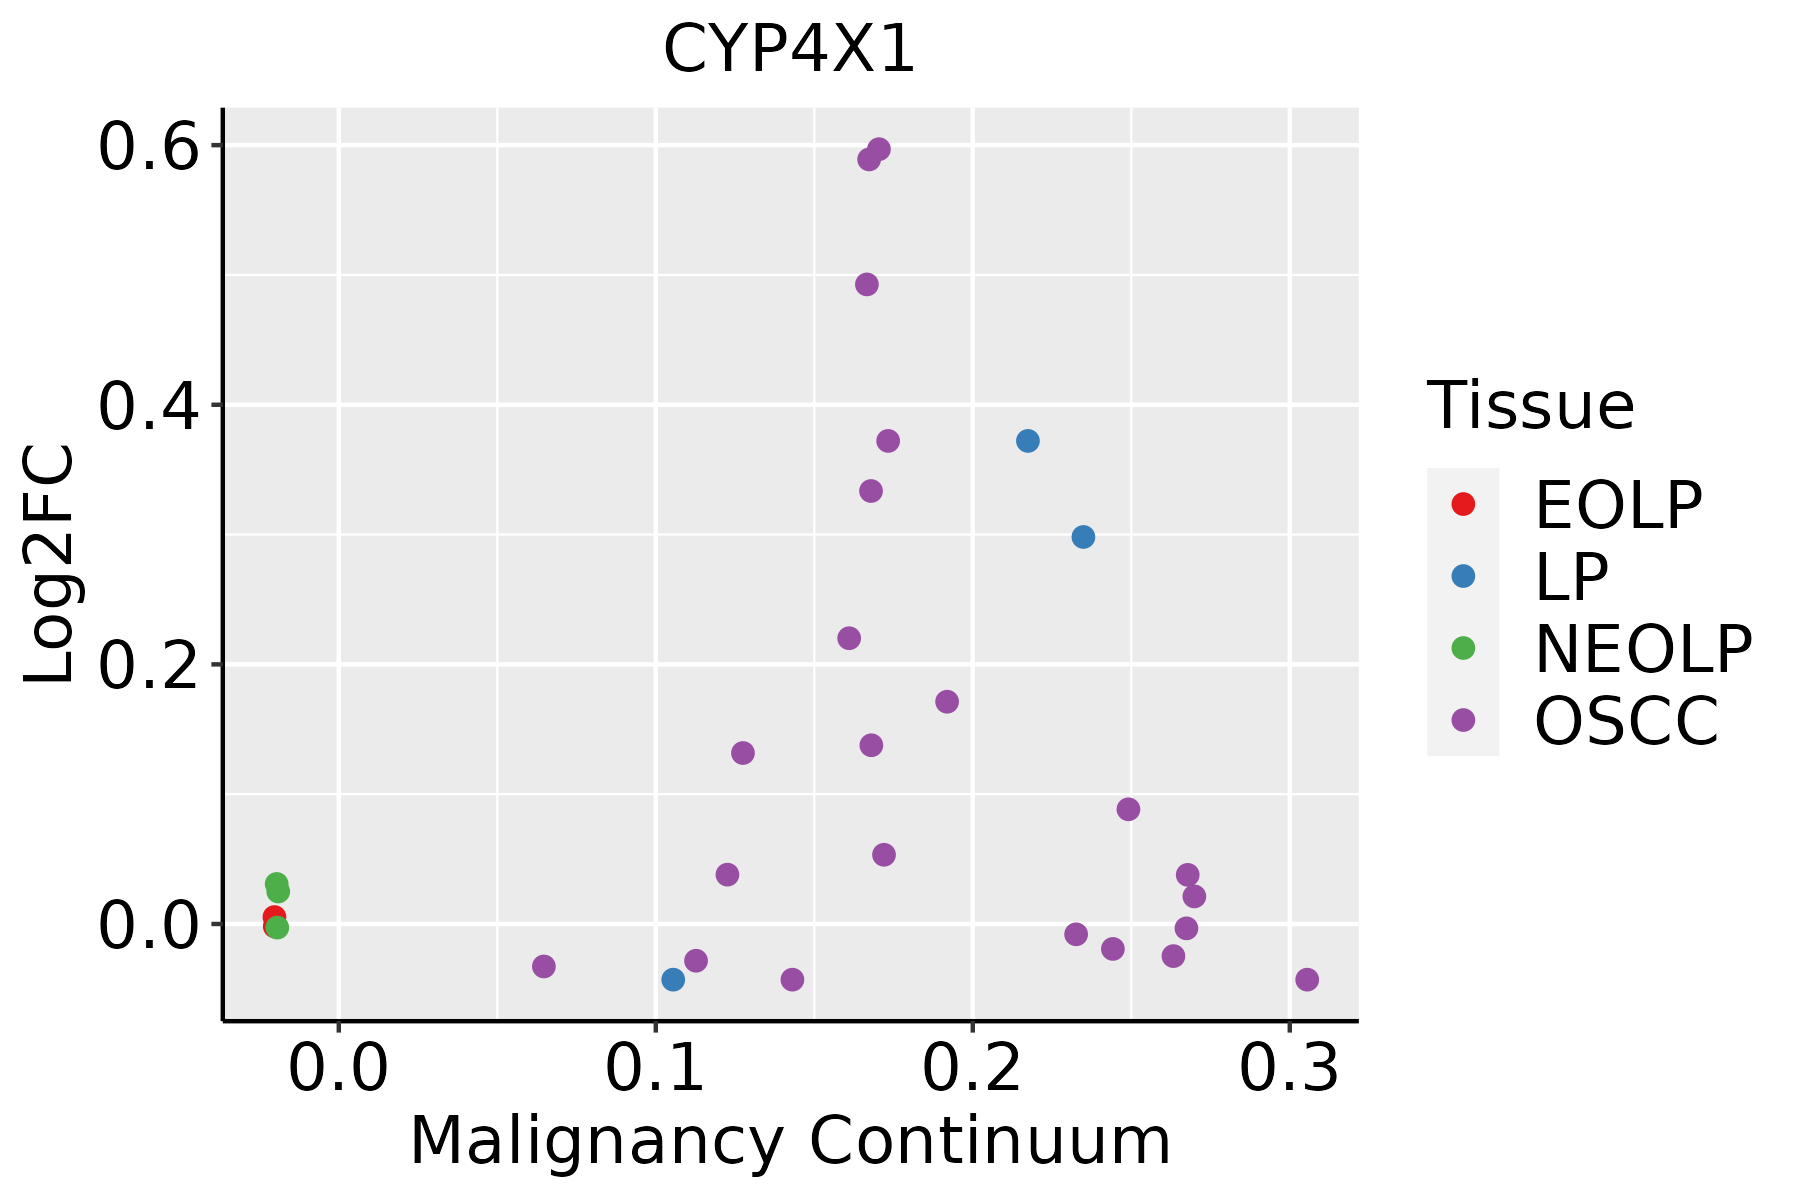 | EOLP: Erosive Oral lichen planus |
| LP: leukoplakia | ||
| NEOLP: Non-erosive oral lichen planus | ||
| OSCC: Oral squamous cell carcinoma |
| ∗log2FC in expression of this searched gene in stem-like cells from each diseased tissue sample relative to stem-like cells in normal samples in each tissue plotted against the malignancy continuum. Samples are colored based on if they are from different disease stage. |
Top |
Malignant transformation related pathway analysis |
| Find out the enriched GO biological processes and KEGG pathways involved in transition from healthy to precancer to cancer |
| Tissue | Disease Stage | Enriched GO biological Processes |
| Colorectum | AD |  |
| Colorectum | SER |  |
| Colorectum | MSS |  |
| Colorectum | MSI-H |  |
| Colorectum | FAP |  |
| ∗Top 15 enriched GO BP terms are showed in the bar plot of each disease state in each tissue. Each row represents a significant GO biological process which is colored according to the -log10(p.adjust). |
| Page: 1 2 3 4 5 6 7 8 9 |
| GO ID | Tissue | Disease Stage | Description | Gene Ratio | Bg Ratio | pvalue | p.adjust | Count |
| Page: 1 |
| Pathway ID | Tissue | Disease Stage | Description | Gene Ratio | Bg Ratio | pvalue | p.adjust | qvalue | Count |
| Page: 1 |
Top |
Cell-cell communication analysis |
| Identification of potential cell-cell interactions between two cell types and their ligand-receptor pairs for different disease states |
| Ligand | Receptor | LRpair | Pathway | Tissue | Disease Stage |
| Page: 1 |
Top |
Single-cell gene regulatory network inference analysis |
| Find out the significant the regulons (TFs) and the target genes of each regulon across cell types for different disease states |
| TF | Cell Type | Tissue | Disease Stage | Target Gene | RSS | Regulon Activity |
| ∗The dot plots of a searched regulon are shown for all cell subpopulations in each disease state of each tissue based on the regulon specific score inferred using pySCENIC and by calculating the average expression. |
| Page: 1 |
Top |
Somatic mutation of malignant transformation related genes |
| Annotation of somatic variants for genes involved in malignant transformation |
| Hugo Symbol | Variant Class | Variant Classification | dbSNP RS | HGVSc | HGVSp | HGVSp Short | SWISSPROT | BIOTYPE | SIFT | PolyPhen | Tumor Sample Barcode | Tissue | Histology | Sex | Age | Stage | Therapy Types | Drugs | Outcome |
| CYP4X1 | SNV | Missense_Mutation | rs778935923 | c.671N>G | p.Phe224Cys | p.F224C | Q8N118 | protein_coding | tolerated(0.15) | possibly_damaging(0.886) | TCGA-BH-A0DZ-01 | Breast | breast invasive carcinoma | Female | <65 | I/II | Chemotherapy | docetaxel | SD |
| CYP4X1 | SNV | Missense_Mutation | rs751651489 | c.836N>G | p.Pro279Arg | p.P279R | Q8N118 | protein_coding | tolerated(0.56) | benign(0.009) | TCGA-BH-A1FC-01 | Breast | breast invasive carcinoma | Female | >=65 | I/II | Unknown | Unknown | SD |
| CYP4X1 | SNV | Missense_Mutation | c.664A>G | p.Ile222Val | p.I222V | Q8N118 | protein_coding | deleterious(0.02) | possibly_damaging(0.574) | TCGA-D8-A1J8-01 | Breast | breast invasive carcinoma | Female | >=65 | I/II | Hormone Therapy | nolvadex | SD | |
| CYP4X1 | SNV | Missense_Mutation | novel | c.349N>A | p.Ser117Thr | p.S117T | Q8N118 | protein_coding | deleterious(0.01) | benign(0) | TCGA-OL-A66K-01 | Breast | breast invasive carcinoma | Female | >=65 | I/II | Unknown | Unknown | SD |
| CYP4X1 | SNV | Missense_Mutation | novel | c.1219N>T | p.Val407Phe | p.V407F | Q8N118 | protein_coding | tolerated(0.75) | benign(0.03) | TCGA-OL-A6VO-01 | Breast | breast invasive carcinoma | Female | <65 | I/II | Chemotherapy | taxotere | CR |
| CYP4X1 | insertion | In_Frame_Ins | novel | c.977_978insAAGAAA | p.Ser326_Trp327insArgAsn | p.S326_W327insRN | Q8N118 | protein_coding | TCGA-A8-A08H-01 | Breast | breast invasive carcinoma | Female | >=65 | I/II | Unknown | Unknown | SD | ||
| CYP4X1 | insertion | In_Frame_Ins | novel | c.978_979insTTCCCTTCAAAACATTTATTTGTAAAATCACTT | p.Ser326_Trp327insPheProSerLysHisLeuPheValLysSerLeu | p.S326_W327insFPSKHLFVKSL | Q8N118 | protein_coding | TCGA-A8-A08H-01 | Breast | breast invasive carcinoma | Female | >=65 | I/II | Unknown | Unknown | SD | ||
| CYP4X1 | insertion | Nonsense_Mutation | novel | c.749_750insTAAGACCTATCGGTCGACCTGAACTTTTAAAATTTC | p.Leu250delinsPheLysThrTyrArgSerThrTerThrPheLysIleSer | p.L250delinsFKTYRST*TFKIS | Q8N118 | protein_coding | TCGA-B6-A0RG-01 | Breast | breast invasive carcinoma | Female | <65 | I/II | Unknown | Unknown | SD | ||
| CYP4X1 | SNV | Missense_Mutation | novel | c.638C>T | p.Ala213Val | p.A213V | Q8N118 | protein_coding | tolerated(0.32) | benign(0.001) | TCGA-2W-A8YY-01 | Cervix | cervical & endocervical cancer | Female | <65 | I/II | Chemotherapy | cisplatin | CR |
| CYP4X1 | SNV | Missense_Mutation | c.160T>C | p.Phe54Leu | p.F54L | Q8N118 | protein_coding | tolerated(1) | benign(0.013) | TCGA-FU-A3HZ-01 | Cervix | cervical & endocervical cancer | Female | <65 | I/II | Chemotherapy | cisplatin | CR |
| Page: 1 2 3 4 5 |
Top |
Related drugs of malignant transformation related genes |
| Identification of chemicals and drugs interact with genes involved in malignant transfromation |
| (DGIdb 4.0) |
| Entrez ID | Symbol | Category | Interaction Types | Drug Claim Name | Drug Name | PMIDs |
| Page: 1 |

Copyright 2023-Present -The University of Texas Health Science Center at Houston |