
|
|||||
|
 | |
| |
| |
| |
| |
| |
|
Gene: CYP4F3 |
Gene summary for CYP4F3 |
| Gene information | Species | Human | Gene symbol | CYP4F3 | Gene ID | 4051 |
| Gene name | cytochrome P450 family 4 subfamily F member 3 | |
| Gene Alias | CPF3 | |
| Cytomap | 19p13.12 | |
| Gene Type | protein-coding | GO ID | GO:0001676 | UniProtAcc | A0A024R7J8 |
Top |
Malignant transformation analysis |
| Identification of the aberrant gene expression in precancerous and cancerous lesions by comparing the gene expression of stem-like cells in diseased tissues with normal stem cells |
| Entrez ID | Symbol | Replicates | Species | Organ | Tissue | Adj P-value | Log2FC | Malignancy |
| 4051 | CYP4F3 | LZE2T | Human | Esophagus | ESCC | 9.54e-06 | 8.15e-01 | 0.082 |
| 4051 | CYP4F3 | LZE4T | Human | Esophagus | ESCC | 6.89e-31 | 9.92e-01 | 0.0811 |
| 4051 | CYP4F3 | LZE7T | Human | Esophagus | ESCC | 1.62e-04 | 3.16e-01 | 0.0667 |
| 4051 | CYP4F3 | LZE21T | Human | Esophagus | ESCC | 9.73e-05 | 2.52e-01 | 0.0655 |
| 4051 | CYP4F3 | P4T-E | Human | Esophagus | ESCC | 1.78e-10 | 2.58e-01 | 0.1323 |
| 4051 | CYP4F3 | P9T-E | Human | Esophagus | ESCC | 5.10e-37 | 8.06e-01 | 0.1131 |
| 4051 | CYP4F3 | P10T-E | Human | Esophagus | ESCC | 1.66e-02 | 9.55e-02 | 0.116 |
| 4051 | CYP4F3 | P15T-E | Human | Esophagus | ESCC | 1.55e-17 | 4.27e-01 | 0.1149 |
| 4051 | CYP4F3 | P22T-E | Human | Esophagus | ESCC | 4.31e-06 | 1.51e-01 | 0.1236 |
| 4051 | CYP4F3 | P28T-E | Human | Esophagus | ESCC | 8.08e-19 | 4.47e-01 | 0.1149 |
| 4051 | CYP4F3 | P30T-E | Human | Esophagus | ESCC | 6.77e-42 | 1.57e+00 | 0.137 |
| 4051 | CYP4F3 | P39T-E | Human | Esophagus | ESCC | 4.12e-11 | 3.14e-01 | 0.0894 |
| 4051 | CYP4F3 | P42T-E | Human | Esophagus | ESCC | 7.97e-06 | 3.33e-01 | 0.1175 |
| 4051 | CYP4F3 | P48T-E | Human | Esophagus | ESCC | 9.56e-08 | 2.54e-01 | 0.0959 |
| 4051 | CYP4F3 | P49T-E | Human | Esophagus | ESCC | 3.75e-07 | 7.88e-01 | 0.1768 |
| 4051 | CYP4F3 | P52T-E | Human | Esophagus | ESCC | 4.44e-08 | 2.52e-01 | 0.1555 |
| 4051 | CYP4F3 | P82T-E | Human | Esophagus | ESCC | 4.14e-03 | 1.65e-01 | 0.1072 |
| 4051 | CYP4F3 | P83T-E | Human | Esophagus | ESCC | 1.27e-09 | 4.07e-01 | 0.1738 |
| 4051 | CYP4F3 | P94T-E | Human | Esophagus | ESCC | 6.05e-03 | 2.93e-01 | 0.0879 |
| 4051 | CYP4F3 | P107T-E | Human | Esophagus | ESCC | 1.37e-03 | 1.50e-01 | 0.171 |
| Page: 1 2 |
| Tissue | Expression Dynamics | Abbreviation |
| Esophagus | 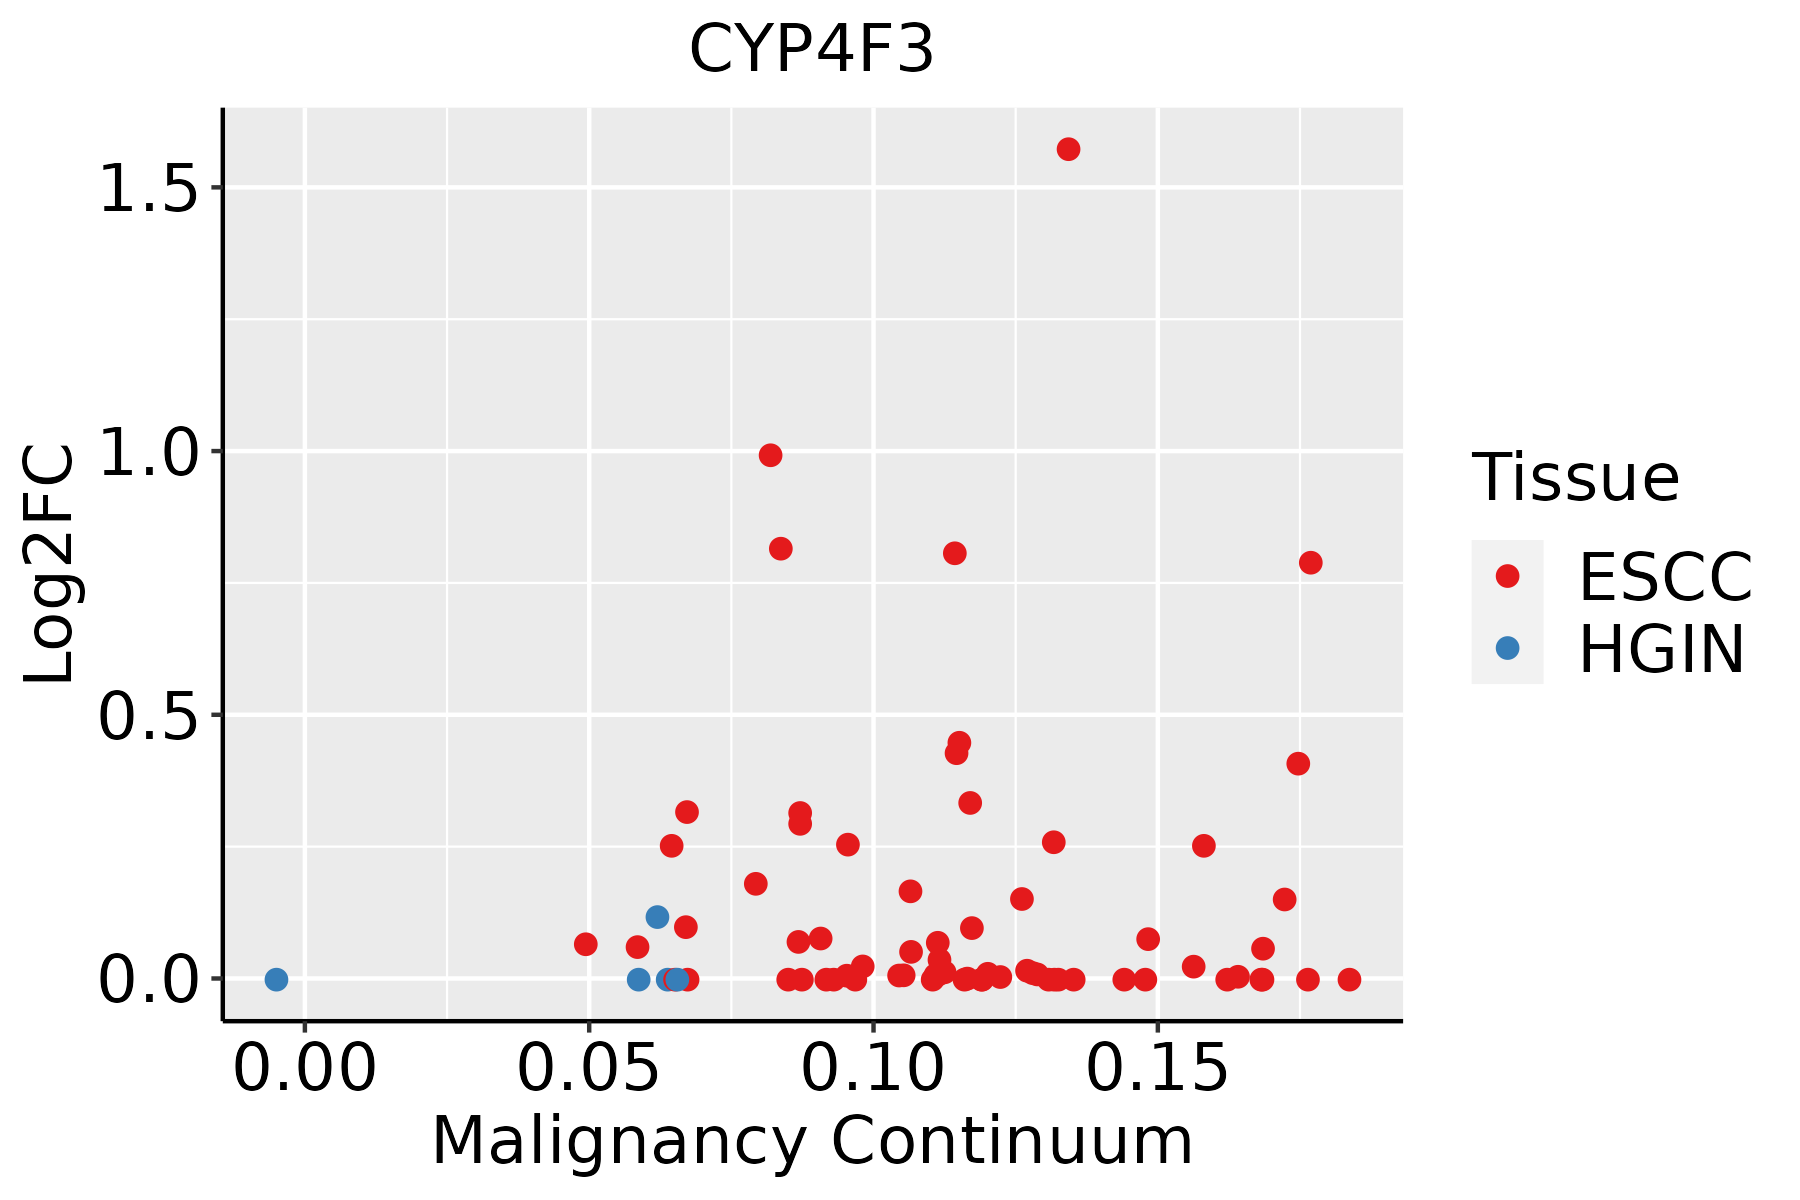 | ESCC: Esophageal squamous cell carcinoma |
| HGIN: High-grade intraepithelial neoplasias | ||
| LGIN: Low-grade intraepithelial neoplasias | ||
| Liver | 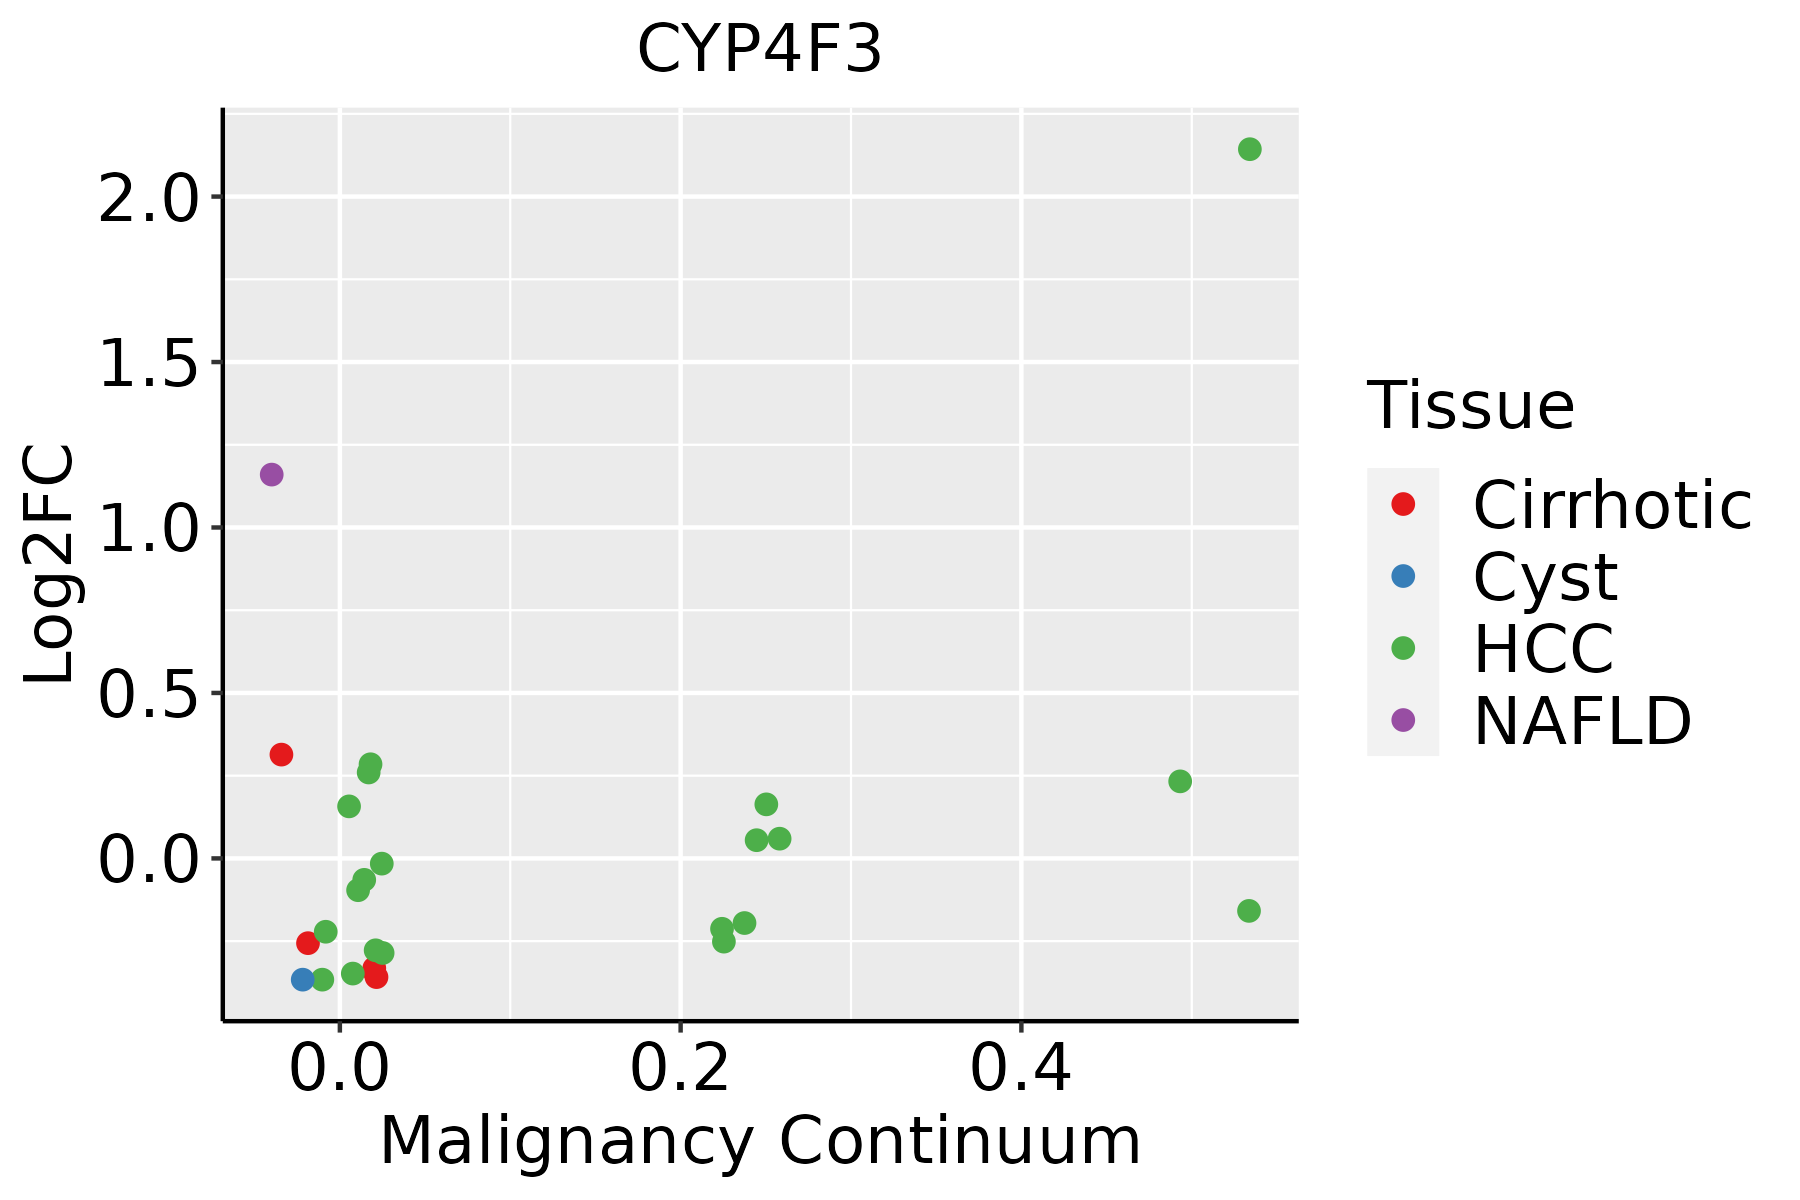 | HCC: Hepatocellular carcinoma |
| NAFLD: Non-alcoholic fatty liver disease | ||
| Oral Cavity |  | EOLP: Erosive Oral lichen planus |
| LP: leukoplakia | ||
| NEOLP: Non-erosive oral lichen planus | ||
| OSCC: Oral squamous cell carcinoma |
| ∗log2FC in expression of this searched gene in stem-like cells from each diseased tissue sample relative to stem-like cells in normal samples in each tissue plotted against the malignancy continuum. Samples are colored based on if they are from different disease stage. |
Top |
Malignant transformation related pathway analysis |
| Find out the enriched GO biological processes and KEGG pathways involved in transition from healthy to precancer to cancer |
| Tissue | Disease Stage | Enriched GO biological Processes |
| Colorectum | AD |  |
| Colorectum | SER |  |
| Colorectum | MSS |  |
| Colorectum | MSI-H |  |
| Colorectum | FAP |  |
| ∗Top 15 enriched GO BP terms are showed in the bar plot of each disease state in each tissue. Each row represents a significant GO biological process which is colored according to the -log10(p.adjust). |
| Page: 1 2 3 4 5 6 7 8 9 |
| GO ID | Tissue | Disease Stage | Description | Gene Ratio | Bg Ratio | pvalue | p.adjust | Count |
| GO:190166112 | Esophagus | ESCC | quinone metabolic process | 34/8552 | 40/18723 | 3.00e-07 | 4.27e-06 | 34 |
| GO:00066318 | Esophagus | ESCC | fatty acid metabolic process | 217/8552 | 390/18723 | 4.21e-05 | 3.39e-04 | 217 |
| GO:00067661 | Esophagus | ESCC | vitamin metabolic process | 67/8552 | 106/18723 | 2.03e-04 | 1.28e-03 | 67 |
| GO:00723297 | Esophagus | ESCC | monocarboxylic acid catabolic process | 74/8552 | 122/18723 | 6.03e-04 | 3.27e-03 | 74 |
| GO:00421805 | Esophagus | ESCC | cellular ketone metabolic process | 120/8552 | 211/18723 | 6.70e-04 | 3.55e-03 | 120 |
| GO:00442827 | Esophagus | ESCC | small molecule catabolic process | 201/8552 | 376/18723 | 1.35e-03 | 6.41e-03 | 201 |
| GO:00160427 | Esophagus | ESCC | lipid catabolic process | 168/8552 | 320/18723 | 7.97e-03 | 2.84e-02 | 168 |
| GO:00463953 | Liver | NAFLD | carboxylic acid catabolic process | 73/1882 | 236/18723 | 4.16e-19 | 1.22e-15 | 73 |
| GO:00160544 | Liver | NAFLD | organic acid catabolic process | 73/1882 | 240/18723 | 1.20e-18 | 2.34e-15 | 73 |
| GO:00442825 | Liver | NAFLD | small molecule catabolic process | 91/1882 | 376/18723 | 8.96e-16 | 1.31e-12 | 91 |
| GO:00066316 | Liver | NAFLD | fatty acid metabolic process | 92/1882 | 390/18723 | 3.38e-15 | 3.29e-12 | 92 |
| GO:00723295 | Liver | NAFLD | monocarboxylic acid catabolic process | 39/1882 | 122/18723 | 2.40e-11 | 8.77e-09 | 39 |
| GO:00160426 | Liver | NAFLD | lipid catabolic process | 63/1882 | 320/18723 | 1.35e-07 | 1.02e-05 | 63 |
| GO:00335596 | Liver | NAFLD | unsaturated fatty acid metabolic process | 24/1882 | 116/18723 | 4.64e-04 | 6.74e-03 | 24 |
| GO:00016763 | Liver | NAFLD | long-chain fatty acid metabolic process | 23/1882 | 112/18723 | 6.73e-04 | 8.66e-03 | 23 |
| GO:01202545 | Liver | NAFLD | olefinic compound metabolic process | 28/1882 | 153/18723 | 1.28e-03 | 1.45e-02 | 28 |
| GO:00421803 | Liver | NAFLD | cellular ketone metabolic process | 35/1882 | 211/18723 | 2.09e-03 | 2.06e-02 | 35 |
| GO:00066906 | Liver | NAFLD | icosanoid metabolic process | 22/1882 | 123/18723 | 5.33e-03 | 4.11e-02 | 22 |
| GO:000663112 | Liver | Cirrhotic | fatty acid metabolic process | 165/4634 | 390/18723 | 1.29e-14 | 1.26e-12 | 165 |
| GO:004428211 | Liver | Cirrhotic | small molecule catabolic process | 151/4634 | 376/18723 | 2.20e-11 | 1.34e-09 | 151 |
| Page: 1 2 3 |
| Pathway ID | Tissue | Disease Stage | Description | Gene Ratio | Bg Ratio | pvalue | p.adjust | qvalue | Count |
| Page: 1 |
Top |
Cell-cell communication analysis |
| Identification of potential cell-cell interactions between two cell types and their ligand-receptor pairs for different disease states |
| Ligand | Receptor | LRpair | Pathway | Tissue | Disease Stage |
| Page: 1 |
Top |
Single-cell gene regulatory network inference analysis |
| Find out the significant the regulons (TFs) and the target genes of each regulon across cell types for different disease states |
| TF | Cell Type | Tissue | Disease Stage | Target Gene | RSS | Regulon Activity |
| ∗The dot plots of a searched regulon are shown for all cell subpopulations in each disease state of each tissue based on the regulon specific score inferred using pySCENIC and by calculating the average expression. |
| Page: 1 |
Top |
Somatic mutation of malignant transformation related genes |
| Annotation of somatic variants for genes involved in malignant transformation |
| Hugo Symbol | Variant Class | Variant Classification | dbSNP RS | HGVSc | HGVSp | HGVSp Short | SWISSPROT | BIOTYPE | SIFT | PolyPhen | Tumor Sample Barcode | Tissue | Histology | Sex | Age | Stage | Therapy Types | Drugs | Outcome |
| CYP4F3 | SNV | Missense_Mutation | c.1467N>G | p.Phe489Leu | p.F489L | Q08477 | protein_coding | deleterious(0.01) | probably_damaging(0.996) | TCGA-D8-A1JA-01 | Breast | breast invasive carcinoma | Female | <65 | III/IV | Chemotherapy | adriamycin | PD | |
| CYP4F3 | SNV | Missense_Mutation | rs746952049 | c.437N>A | p.Arg146His | p.R146H | Q08477 | protein_coding | tolerated(0.25) | benign(0.178) | TCGA-2W-A8YY-01 | Cervix | cervical & endocervical cancer | Female | <65 | I/II | Chemotherapy | cisplatin | CR |
| CYP4F3 | SNV | Missense_Mutation | c.1495N>T | p.Arg499Cys | p.R499C | Q08477 | protein_coding | deleterious(0.03) | benign(0.12) | TCGA-JX-A3Q0-01 | Cervix | cervical & endocervical cancer | Female | <65 | III/IV | Unknown | Unknown | SD | |
| CYP4F3 | SNV | Missense_Mutation | c.1042N>A | p.Pro348Thr | p.P348T | Q08477 | protein_coding | deleterious(0.01) | benign(0.417) | TCGA-A6-6142-01 | Colorectum | colon adenocarcinoma | Female | <65 | I/II | Chemotherapy | fluorouracil | PD | |
| CYP4F3 | SNV | Missense_Mutation | c.1469N>A | p.Arg490His | p.R490H | Q08477 | protein_coding | tolerated(0.07) | benign(0.082) | TCGA-A6-6781-01 | Colorectum | colon adenocarcinoma | Male | <65 | III/IV | Chemotherapy | oxaliplatin | SD | |
| CYP4F3 | SNV | Missense_Mutation | rs113330239 | c.827N>A | p.Arg276His | p.R276H | Q08477 | protein_coding | tolerated(0.2) | benign(0.024) | TCGA-AA-3845-01 | Colorectum | colon adenocarcinoma | Female | >=65 | I/II | Unknown | Unknown | PD |
| CYP4F3 | SNV | Missense_Mutation | c.948G>T | p.Glu316Asp | p.E316D | Q08477 | protein_coding | deleterious(0.01) | benign(0.151) | TCGA-AA-3977-01 | Colorectum | colon adenocarcinoma | Male | >=65 | I/II | Unknown | Unknown | SD | |
| CYP4F3 | SNV | Missense_Mutation | novel | c.1531G>A | p.Gly511Arg | p.G511R | Q08477 | protein_coding | deleterious(0) | probably_damaging(1) | TCGA-AA-3984-01 | Colorectum | colon adenocarcinoma | Female | <65 | I/II | Unknown | Unknown | SD |
| CYP4F3 | SNV | Missense_Mutation | c.394N>A | p.Leu132Met | p.L132M | Q08477 | protein_coding | deleterious(0.01) | probably_damaging(0.993) | TCGA-AA-A02R-01 | Colorectum | colon adenocarcinoma | Female | >=65 | I/II | Unknown | Unknown | PD | |
| CYP4F3 | SNV | Missense_Mutation | novel | c.1356G>T | p.Glu452Asp | p.E452D | Q08477 | protein_coding | tolerated(0.5) | benign(0.001) | TCGA-CA-6717-01 | Colorectum | colon adenocarcinoma | Male | <65 | I/II | Chemotherapy | oxaliplatin | CR |
| Page: 1 2 3 4 5 6 7 |
Top |
Related drugs of malignant transformation related genes |
| Identification of chemicals and drugs interact with genes involved in malignant transfromation |
| (DGIdb 4.0) |
| Entrez ID | Symbol | Category | Interaction Types | Drug Claim Name | Drug Name | PMIDs |
| Page: 1 |

Copyright 2023-Present -The University of Texas Health Science Center at Houston |