
|
|||||
|
 | |
| |
| |
| |
| |
| |
|
Gene: CYP4F12 |
Gene summary for CYP4F12 |
| Gene information | Species | Human | Gene symbol | CYP4F12 | Gene ID | 66002 |
| Gene name | cytochrome P450 family 4 subfamily F member 12 | |
| Gene Alias | CYPIVF12 | |
| Cytomap | 19p13.12 | |
| Gene Type | protein-coding | GO ID | GO:0000038 | UniProtAcc | A0A0A0MR49 |
Top |
Malignant transformation analysis |
| Identification of the aberrant gene expression in precancerous and cancerous lesions by comparing the gene expression of stem-like cells in diseased tissues with normal stem cells |
| Entrez ID | Symbol | Replicates | Species | Organ | Tissue | Adj P-value | Log2FC | Malignancy |
| 66002 | CYP4F12 | Pat01-B | Human | Stomach | GC | 1.94e-15 | 3.32e-01 | 0.5754 |
| 66002 | CYP4F12 | Pat02-B | Human | Stomach | GC | 1.87e-04 | 1.39e-01 | 0.0368 |
| 66002 | CYP4F12 | Pat03-B | Human | Stomach | GC | 2.39e-17 | 3.83e-01 | 0.3693 |
| 66002 | CYP4F12 | Pat04-B | Human | Stomach | GC | 1.47e-02 | 1.52e-01 | -0.1483 |
| 66002 | CYP4F12 | Pat06-B | Human | Stomach | GC | 2.49e-06 | 1.32e-01 | -0.1961 |
| 66002 | CYP4F12 | Pat17-B | Human | Stomach | GC | 4.27e-06 | 2.08e-01 | 0.3109 |
| 66002 | CYP4F12 | Pat22-B | Human | Stomach | GC | 1.67e-09 | 1.99e-01 | -0.1042 |
| 66002 | CYP4F12 | Pat25-A | Human | Stomach | CAG with IM | 9.39e-08 | 1.46e-01 | -0.1648 |
| 66002 | CYP4F12 | SIM_1 | Human | Stomach | SIM | 8.40e-04 | 2.05e-01 | 0.3573 |
| Page: 1 |
| Tissue | Expression Dynamics | Abbreviation |
| GC | 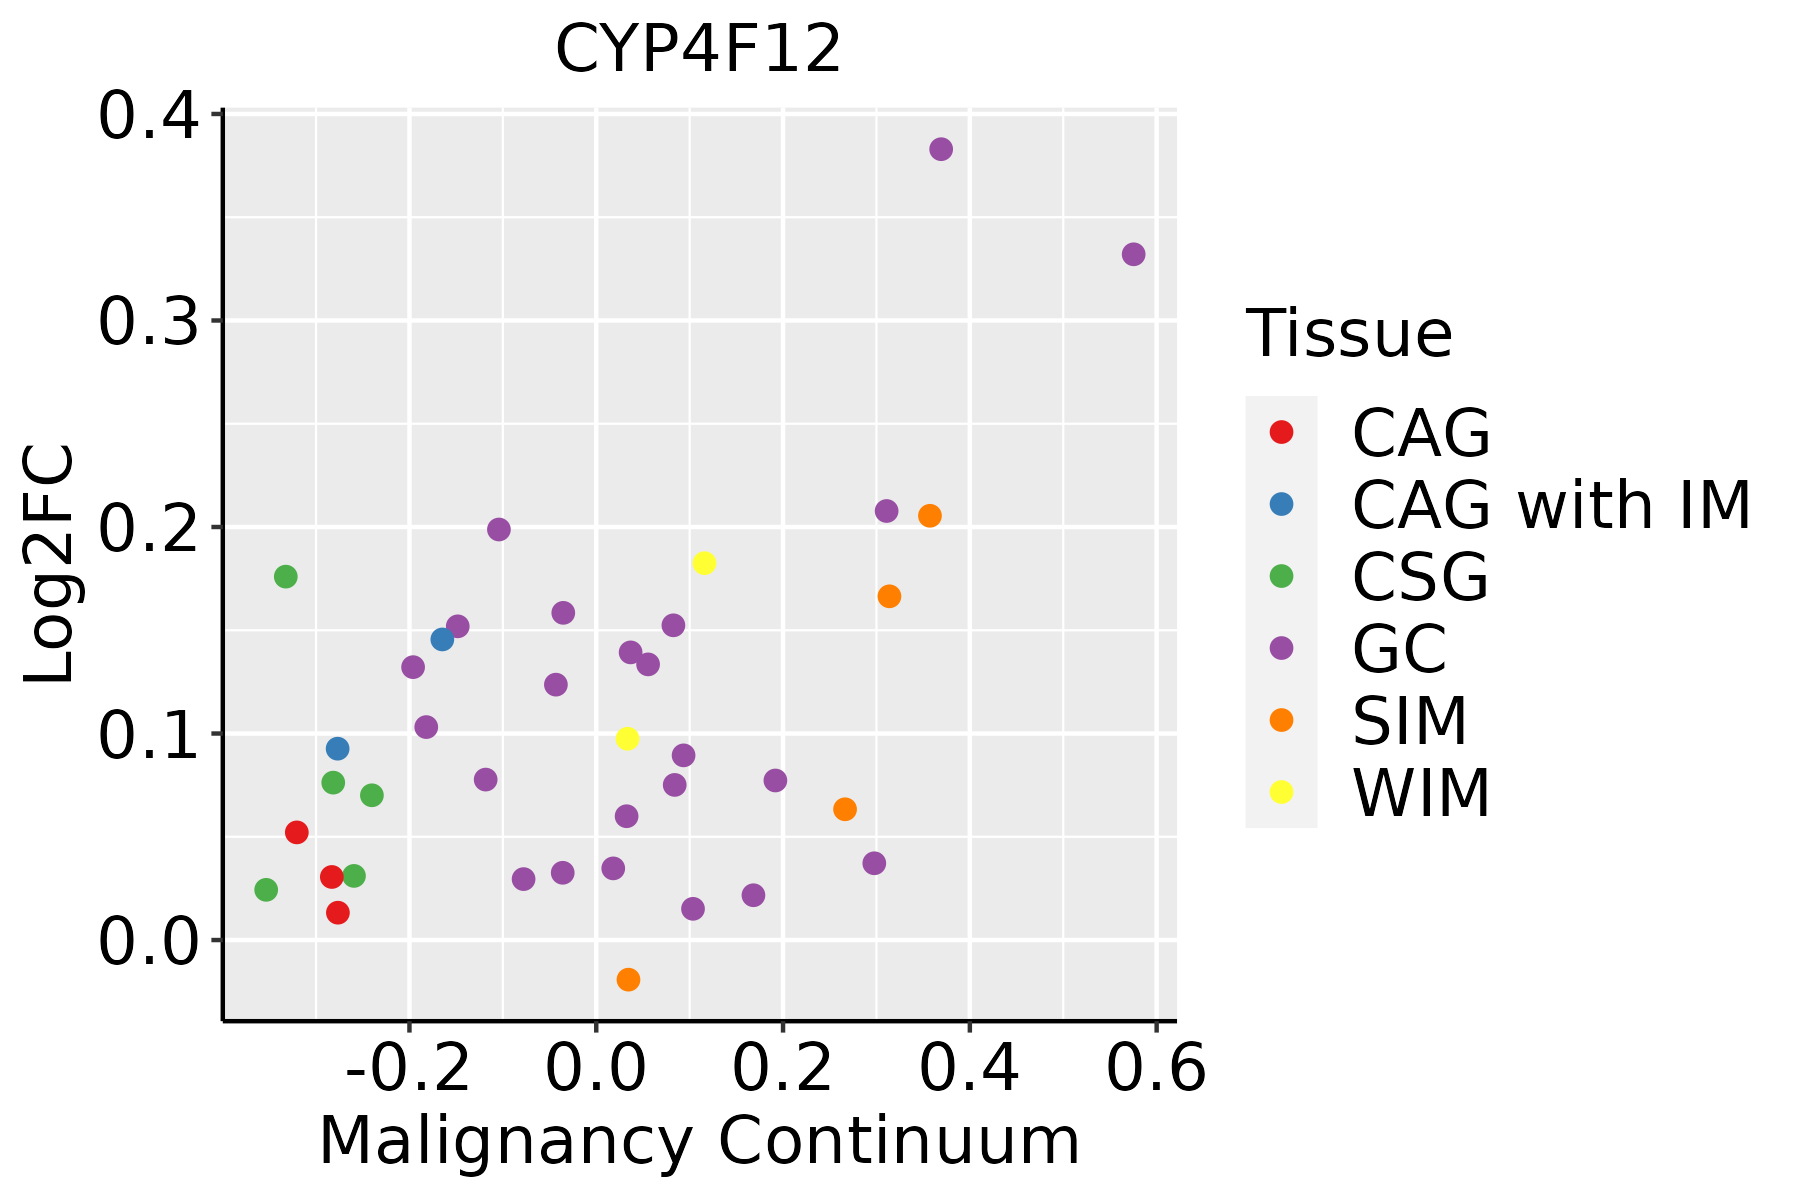 | CAG: Chronic atrophic gastritis |
| CAG with IM: Chronic atrophic gastritis with intestinal metaplasia | ||
| CSG: Chronic superficial gastritis | ||
| GC: Gastric cancer | ||
| SIM: Severe intestinal metaplasia | ||
| WIM: Wild intestinal metaplasia |
| ∗log2FC in expression of this searched gene in stem-like cells from each diseased tissue sample relative to stem-like cells in normal samples in each tissue plotted against the malignancy continuum. Samples are colored based on if they are from different disease stage. |
Top |
Malignant transformation related pathway analysis |
| Find out the enriched GO biological processes and KEGG pathways involved in transition from healthy to precancer to cancer |
| Tissue | Disease Stage | Enriched GO biological Processes |
| Colorectum | AD |  |
| Colorectum | SER |  |
| Colorectum | MSS |  |
| Colorectum | MSI-H |  |
| Colorectum | FAP |  |
| ∗Top 15 enriched GO BP terms are showed in the bar plot of each disease state in each tissue. Each row represents a significant GO biological process which is colored according to the -log10(p.adjust). |
| Page: 1 2 3 4 5 6 7 8 9 |
| GO ID | Tissue | Disease Stage | Description | Gene Ratio | Bg Ratio | pvalue | p.adjust | Count |
| GO:00066315 | Stomach | GC | fatty acid metabolic process | 55/1159 | 390/18723 | 8.63e-09 | 8.38e-07 | 55 |
| GO:00094106 | Stomach | GC | response to xenobiotic stimulus | 61/1159 | 462/18723 | 1.68e-08 | 1.43e-06 | 61 |
| GO:0033559 | Stomach | GC | unsaturated fatty acid metabolic process | 24/1159 | 116/18723 | 1.43e-07 | 8.35e-06 | 24 |
| GO:0006690 | Stomach | GC | icosanoid metabolic process | 24/1159 | 123/18723 | 4.49e-07 | 2.32e-05 | 24 |
| GO:0120254 | Stomach | GC | olefinic compound metabolic process | 25/1159 | 153/18723 | 7.68e-06 | 2.77e-04 | 25 |
| GO:00160425 | Stomach | GC | lipid catabolic process | 41/1159 | 320/18723 | 7.84e-06 | 2.80e-04 | 41 |
| GO:0006805 | Stomach | GC | xenobiotic metabolic process | 19/1159 | 111/18723 | 4.79e-05 | 1.15e-03 | 19 |
| GO:00442824 | Stomach | GC | small molecule catabolic process | 40/1159 | 376/18723 | 5.92e-04 | 8.09e-03 | 40 |
| GO:0071466 | Stomach | GC | cellular response to xenobiotic stimulus | 23/1159 | 177/18723 | 6.01e-04 | 8.17e-03 | 23 |
| GO:0042180 | Stomach | GC | cellular ketone metabolic process | 26/1159 | 211/18723 | 6.25e-04 | 8.37e-03 | 26 |
| GO:00508786 | Stomach | GC | regulation of body fluid levels | 40/1159 | 379/18723 | 6.92e-04 | 9.20e-03 | 40 |
| GO:0019369 | Stomach | GC | arachidonic acid metabolic process | 11/1159 | 59/18723 | 8.75e-04 | 1.09e-02 | 11 |
| GO:00030143 | Stomach | GC | renal system process | 16/1159 | 110/18723 | 1.19e-03 | 1.37e-02 | 16 |
| GO:00723294 | Stomach | GC | monocarboxylic acid catabolic process | 17/1159 | 122/18723 | 1.38e-03 | 1.52e-02 | 17 |
| GO:0001676 | Stomach | GC | long-chain fatty acid metabolic process | 16/1159 | 112/18723 | 1.44e-03 | 1.57e-02 | 16 |
| GO:0003073 | Stomach | GC | regulation of systemic arterial blood pressure | 14/1159 | 96/18723 | 2.29e-03 | 2.21e-02 | 14 |
| GO:0008217 | Stomach | GC | regulation of blood pressure | 22/1159 | 186/18723 | 2.66e-03 | 2.46e-02 | 22 |
| GO:00335591 | Stomach | CAG with IM | unsaturated fatty acid metabolic process | 23/1050 | 116/18723 | 1.00e-07 | 6.93e-06 | 23 |
| GO:000941011 | Stomach | CAG with IM | response to xenobiotic stimulus | 54/1050 | 462/18723 | 2.55e-07 | 1.60e-05 | 54 |
| GO:00066901 | Stomach | CAG with IM | icosanoid metabolic process | 22/1050 | 123/18723 | 1.21e-06 | 5.85e-05 | 22 |
| Page: 1 2 |
| Pathway ID | Tissue | Disease Stage | Description | Gene Ratio | Bg Ratio | pvalue | p.adjust | qvalue | Count |
| Page: 1 |
Top |
Cell-cell communication analysis |
| Identification of potential cell-cell interactions between two cell types and their ligand-receptor pairs for different disease states |
| Ligand | Receptor | LRpair | Pathway | Tissue | Disease Stage |
| Page: 1 |
Top |
Single-cell gene regulatory network inference analysis |
| Find out the significant the regulons (TFs) and the target genes of each regulon across cell types for different disease states |
| TF | Cell Type | Tissue | Disease Stage | Target Gene | RSS | Regulon Activity |
| ∗The dot plots of a searched regulon are shown for all cell subpopulations in each disease state of each tissue based on the regulon specific score inferred using pySCENIC and by calculating the average expression. |
| Page: 1 |
Top |
Somatic mutation of malignant transformation related genes |
| Annotation of somatic variants for genes involved in malignant transformation |
| Hugo Symbol | Variant Class | Variant Classification | dbSNP RS | HGVSc | HGVSp | HGVSp Short | SWISSPROT | BIOTYPE | SIFT | PolyPhen | Tumor Sample Barcode | Tissue | Histology | Sex | Age | Stage | Therapy Types | Drugs | Outcome |
| CYP4F12 | SNV | Missense_Mutation | rs761587768 | c.1282N>T | p.His428Tyr | p.H428Y | protein_coding | deleterious(0) | probably_damaging(0.996) | TCGA-AN-A0AM-01 | Breast | breast invasive carcinoma | Female | <65 | I/II | Unknown | Unknown | SD | |
| CYP4F12 | SNV | Missense_Mutation | c.1383N>G | p.Phe461Leu | p.F461L | protein_coding | deleterious(0) | probably_damaging(0.909) | TCGA-AN-A0AM-01 | Breast | breast invasive carcinoma | Female | <65 | I/II | Unknown | Unknown | SD | ||
| CYP4F12 | SNV | Missense_Mutation | c.491T>C | p.Ile164Thr | p.I164T | protein_coding | deleterious(0.03) | benign(0.019) | TCGA-AO-A128-01 | Breast | breast invasive carcinoma | Female | <65 | I/II | Chemotherapy | doxorubicin | SD | ||
| CYP4F12 | SNV | Missense_Mutation | novel | c.316A>C | p.Thr106Pro | p.T106P | protein_coding | deleterious(0.01) | possibly_damaging(0.588) | TCGA-BH-A0BR-01 | Breast | breast invasive carcinoma | Female | <65 | I/II | Unknown | Unknown | SD | |
| CYP4F12 | insertion | Frame_Shift_Ins | novel | c.1310_1311insCG | p.Glu438ValfsTer42 | p.E438Vfs*42 | protein_coding | TCGA-A8-A093-01 | Breast | breast invasive carcinoma | Female | <65 | I/II | Hormone Therapy | tamoxiphen | SD | |||
| CYP4F12 | insertion | Frame_Shift_Ins | novel | c.1312_1313insGAGTTTATTTTGTGAT | p.Glu438GlyfsTer14 | p.E438Gfs*14 | protein_coding | TCGA-A8-A093-01 | Breast | breast invasive carcinoma | Female | <65 | I/II | Hormone Therapy | tamoxiphen | SD | |||
| CYP4F12 | SNV | Missense_Mutation | rs780373753 | c.137N>A | p.Arg46His | p.R46H | protein_coding | tolerated(0.18) | benign(0.007) | TCGA-2W-A8YY-01 | Cervix | cervical & endocervical cancer | Female | <65 | I/II | Chemotherapy | cisplatin | CR | |
| CYP4F12 | SNV | Missense_Mutation | novel | c.203C>T | p.Thr68Ile | p.T68I | protein_coding | tolerated(0.34) | benign(0.063) | TCGA-DS-A1OA-01 | Cervix | cervical & endocervical cancer | Female | >=65 | I/II | Chemotherapy | carboplatin | PD | |
| CYP4F12 | SNV | Missense_Mutation | novel | c.205C>G | p.Pro69Ala | p.P69A | protein_coding | tolerated(0.09) | benign(0.195) | TCGA-DS-A1OA-01 | Cervix | cervical & endocervical cancer | Female | >=65 | I/II | Chemotherapy | carboplatin | PD | |
| CYP4F12 | SNV | Missense_Mutation | c.1168N>T | p.Arg390Trp | p.R390W | protein_coding | deleterious(0) | benign(0.365) | TCGA-EK-A2RL-01 | Cervix | cervical & endocervical cancer | Female | <65 | I/II | Chemotherapy | taxol | PD |
| Page: 1 2 3 4 5 6 7 8 |
Top |
Related drugs of malignant transformation related genes |
| Identification of chemicals and drugs interact with genes involved in malignant transfromation |
| (DGIdb 4.0) |
| Entrez ID | Symbol | Category | Interaction Types | Drug Claim Name | Drug Name | PMIDs |
| Page: 1 |

Copyright 2023-Present -The University of Texas Health Science Center at Houston |