
|
|||||
|
 | |
| |
| |
| |
| |
| |
|
Gene: CYP4F11 |
Gene summary for CYP4F11 |
| Gene information | Species | Human | Gene symbol | CYP4F11 | Gene ID | 57834 |
| Gene name | cytochrome P450 family 4 subfamily F member 11 | |
| Gene Alias | CYPIVF11 | |
| Cytomap | 19p13.12 | |
| Gene Type | protein-coding | GO ID | GO:0001676 | UniProtAcc | Q9HBI6 |
Top |
Malignant transformation analysis |
| Identification of the aberrant gene expression in precancerous and cancerous lesions by comparing the gene expression of stem-like cells in diseased tissues with normal stem cells |
| Entrez ID | Symbol | Replicates | Species | Organ | Tissue | Adj P-value | Log2FC | Malignancy |
| 57834 | CYP4F11 | LZE2D | Human | Esophagus | HGIN | 3.64e-03 | 5.76e-01 | 0.0642 |
| 57834 | CYP4F11 | LZE2T | Human | Esophagus | ESCC | 5.44e-10 | 1.09e+00 | 0.082 |
| 57834 | CYP4F11 | LZE4T | Human | Esophagus | ESCC | 9.53e-29 | 8.65e-01 | 0.0811 |
| 57834 | CYP4F11 | LZE7T | Human | Esophagus | ESCC | 2.56e-05 | 2.92e-01 | 0.0667 |
| 57834 | CYP4F11 | LZE22T | Human | Esophagus | ESCC | 1.57e-03 | 2.71e-01 | 0.068 |
| 57834 | CYP4F11 | LZE24T | Human | Esophagus | ESCC | 9.19e-06 | 1.55e-01 | 0.0596 |
| 57834 | CYP4F11 | LZE21T | Human | Esophagus | ESCC | 1.57e-07 | 3.78e-01 | 0.0655 |
| 57834 | CYP4F11 | P1T-E | Human | Esophagus | ESCC | 4.62e-03 | 1.56e-01 | 0.0875 |
| 57834 | CYP4F11 | P4T-E | Human | Esophagus | ESCC | 1.75e-05 | 1.67e-01 | 0.1323 |
| 57834 | CYP4F11 | P9T-E | Human | Esophagus | ESCC | 3.99e-67 | 1.53e+00 | 0.1131 |
| 57834 | CYP4F11 | P10T-E | Human | Esophagus | ESCC | 7.92e-69 | 1.09e+00 | 0.116 |
| 57834 | CYP4F11 | P12T-E | Human | Esophagus | ESCC | 9.53e-09 | 3.34e-01 | 0.1122 |
| 57834 | CYP4F11 | P15T-E | Human | Esophagus | ESCC | 6.36e-56 | 1.53e+00 | 0.1149 |
| 57834 | CYP4F11 | P20T-E | Human | Esophagus | ESCC | 8.24e-04 | 1.05e-01 | 0.1124 |
| 57834 | CYP4F11 | P21T-E | Human | Esophagus | ESCC | 6.56e-15 | 3.41e-01 | 0.1617 |
| 57834 | CYP4F11 | P22T-E | Human | Esophagus | ESCC | 3.87e-34 | 6.29e-01 | 0.1236 |
| 57834 | CYP4F11 | P27T-E | Human | Esophagus | ESCC | 8.40e-04 | 1.20e-01 | 0.1055 |
| 57834 | CYP4F11 | P28T-E | Human | Esophagus | ESCC | 2.93e-15 | 4.02e-01 | 0.1149 |
| 57834 | CYP4F11 | P30T-E | Human | Esophagus | ESCC | 1.82e-53 | 2.33e+00 | 0.137 |
| 57834 | CYP4F11 | P31T-E | Human | Esophagus | ESCC | 2.13e-27 | 5.44e-01 | 0.1251 |
| Page: 1 2 3 |
| Tissue | Expression Dynamics | Abbreviation |
| Esophagus | 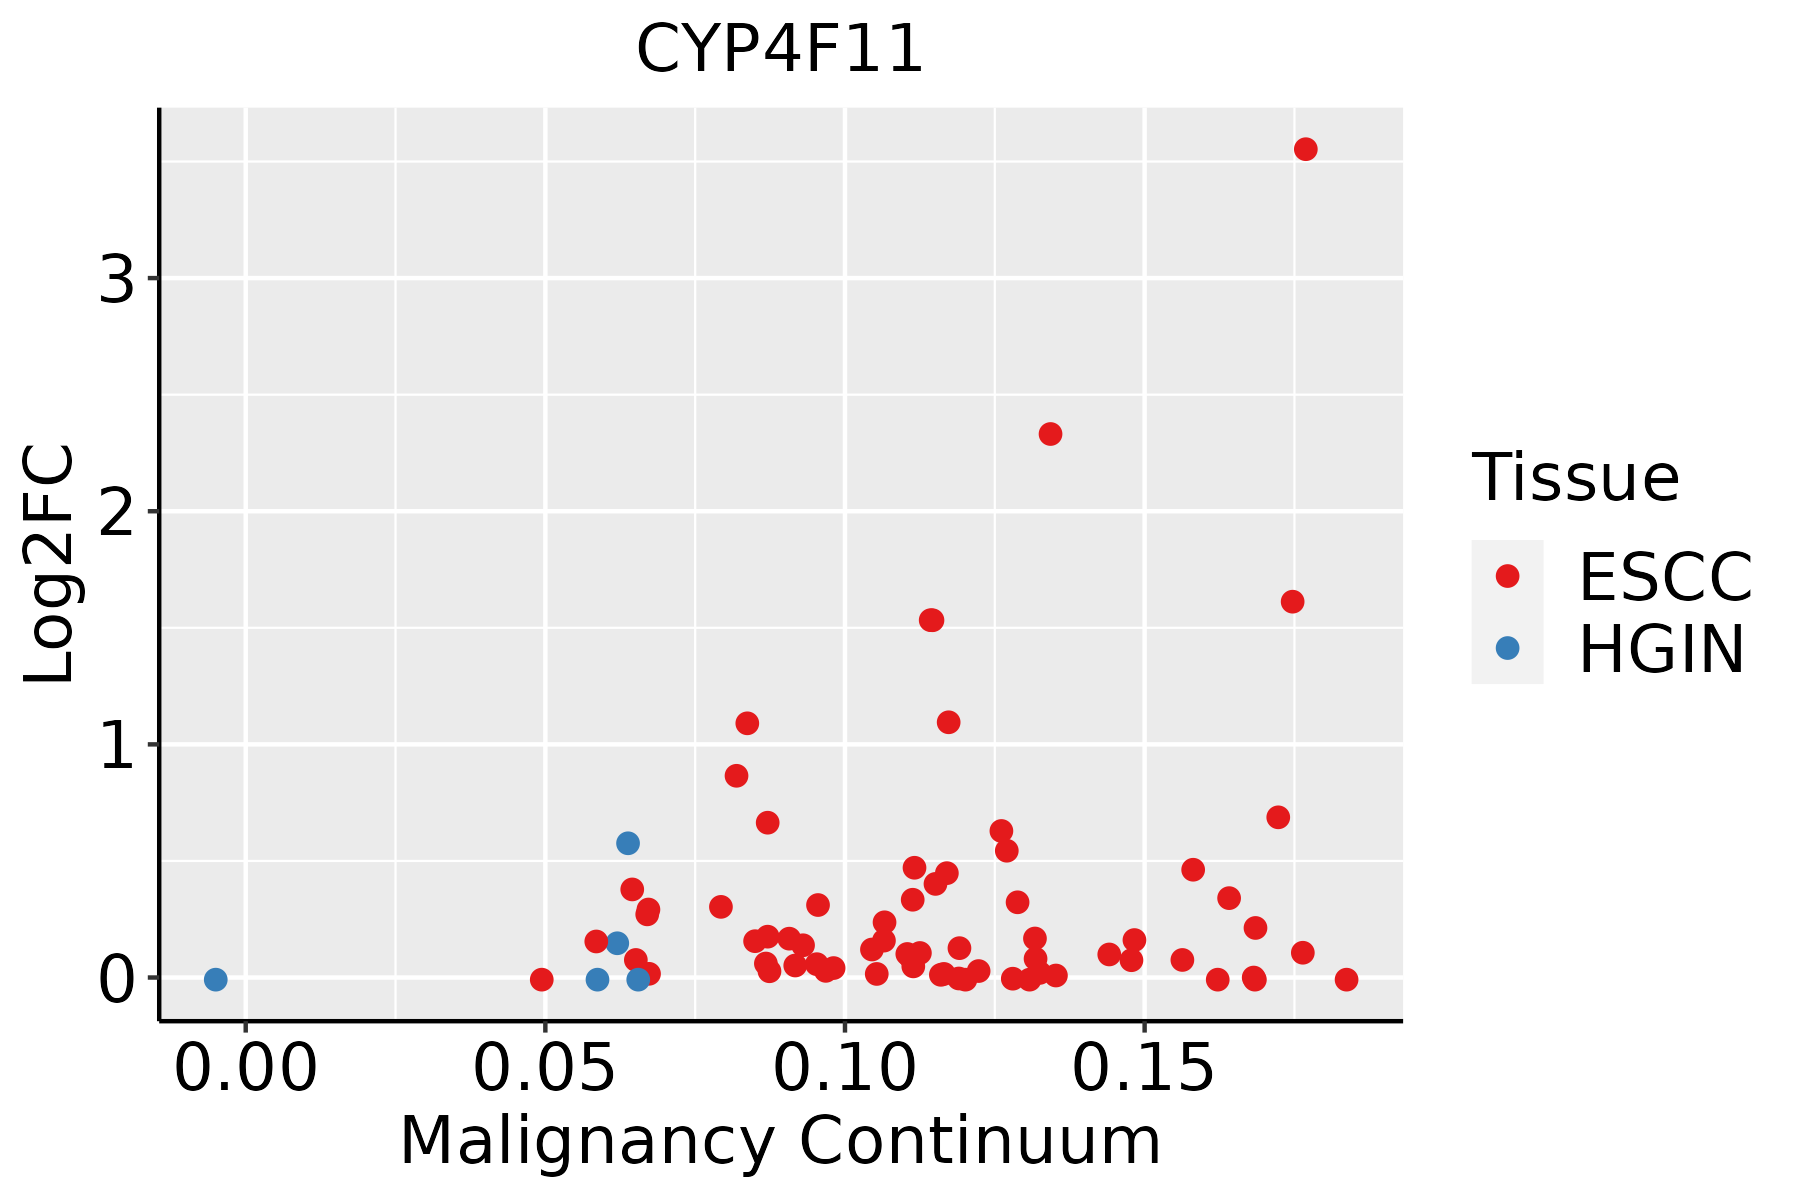 | ESCC: Esophageal squamous cell carcinoma |
| HGIN: High-grade intraepithelial neoplasias | ||
| LGIN: Low-grade intraepithelial neoplasias | ||
| Oral Cavity | 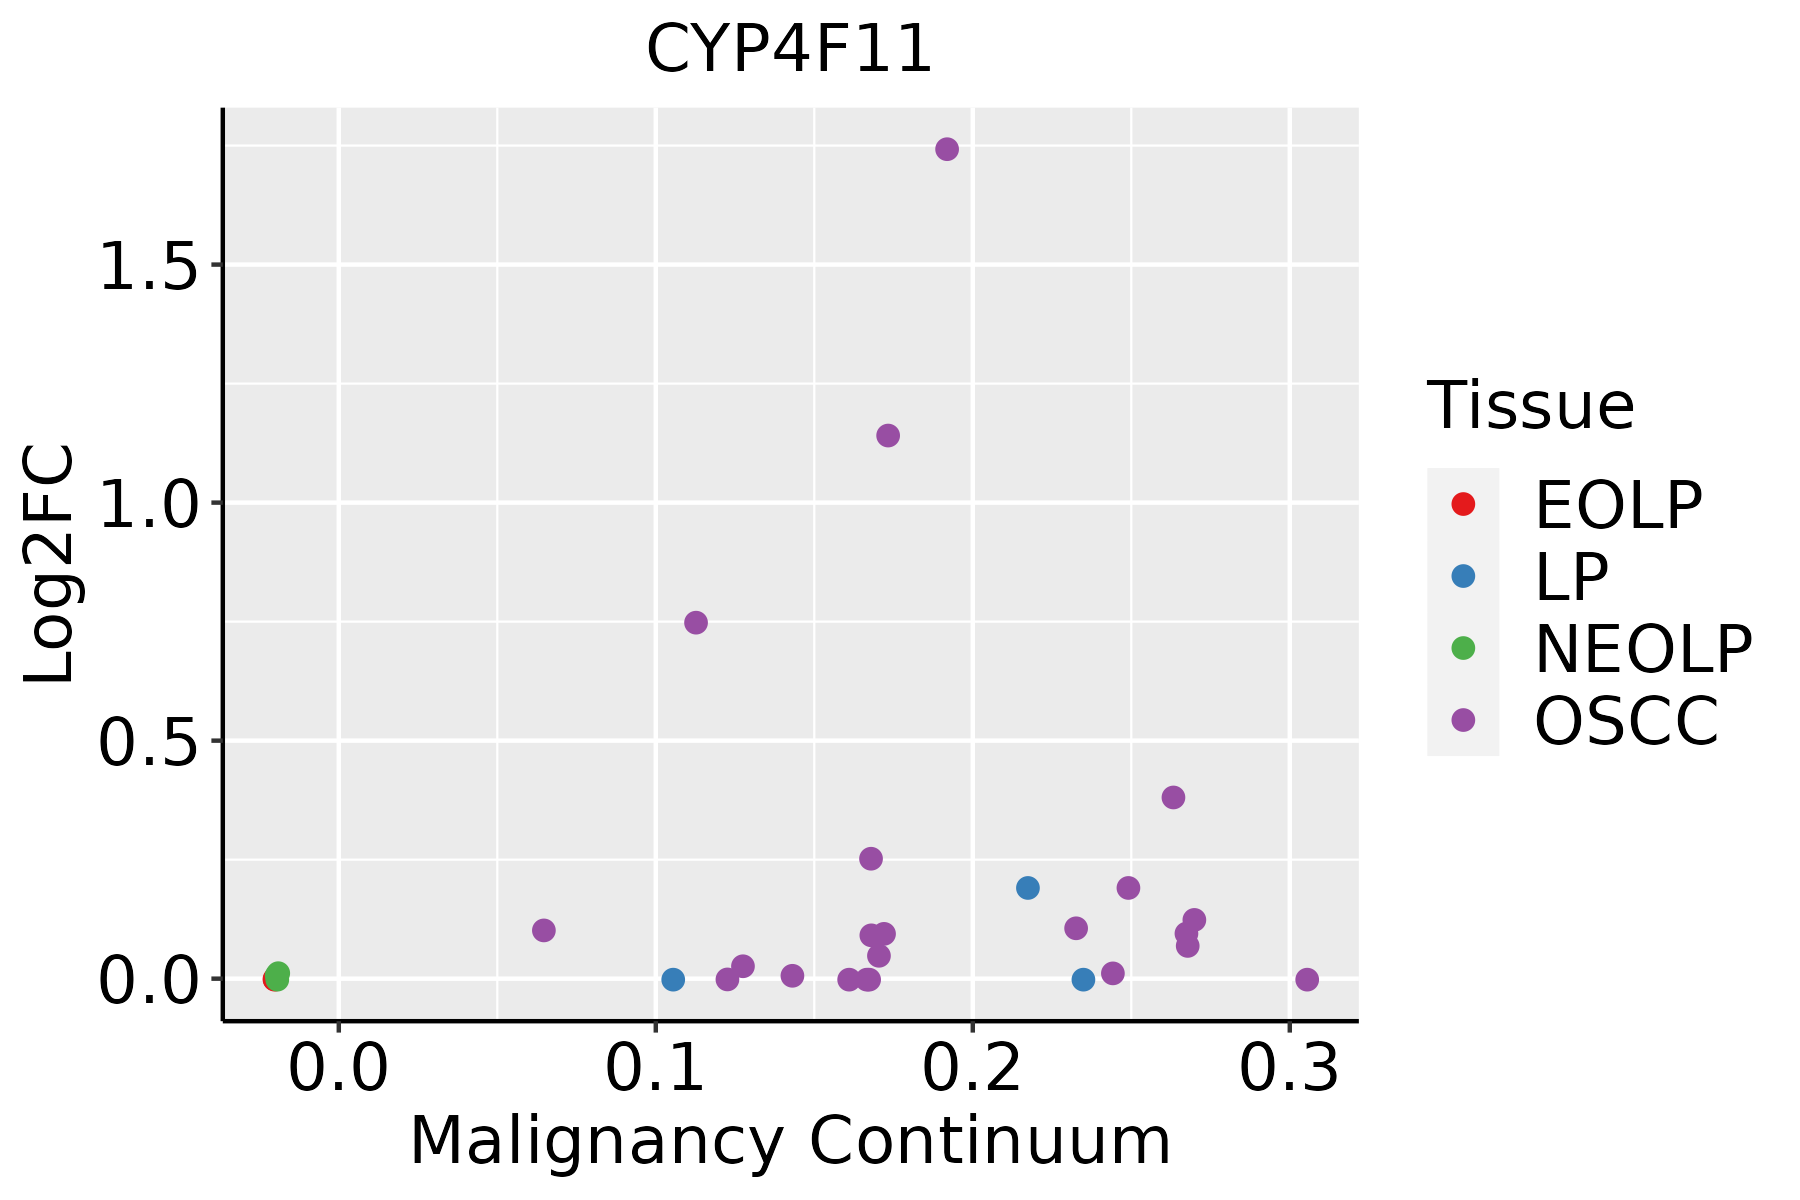 | EOLP: Erosive Oral lichen planus |
| LP: leukoplakia | ||
| NEOLP: Non-erosive oral lichen planus | ||
| OSCC: Oral squamous cell carcinoma |
| ∗log2FC in expression of this searched gene in stem-like cells from each diseased tissue sample relative to stem-like cells in normal samples in each tissue plotted against the malignancy continuum. Samples are colored based on if they are from different disease stage. |
Top |
Malignant transformation related pathway analysis |
| Find out the enriched GO biological processes and KEGG pathways involved in transition from healthy to precancer to cancer |
| Tissue | Disease Stage | Enriched GO biological Processes |
| Colorectum | AD |  |
| Colorectum | SER |  |
| Colorectum | MSS |  |
| Colorectum | MSI-H |  |
| Colorectum | FAP |  |
| ∗Top 15 enriched GO BP terms are showed in the bar plot of each disease state in each tissue. Each row represents a significant GO biological process which is colored according to the -log10(p.adjust). |
| Page: 1 2 3 4 5 6 7 8 9 |
| GO ID | Tissue | Disease Stage | Description | Gene Ratio | Bg Ratio | pvalue | p.adjust | Count |
| GO:19016614 | Esophagus | HGIN | quinone metabolic process | 13/2587 | 40/18723 | 2.04e-03 | 2.13e-02 | 13 |
| GO:190166112 | Esophagus | ESCC | quinone metabolic process | 34/8552 | 40/18723 | 3.00e-07 | 4.27e-06 | 34 |
| GO:004206027 | Esophagus | ESCC | wound healing | 243/8552 | 422/18723 | 4.62e-07 | 6.25e-06 | 243 |
| GO:00066318 | Esophagus | ESCC | fatty acid metabolic process | 217/8552 | 390/18723 | 4.21e-05 | 3.39e-04 | 217 |
| GO:00463948 | Esophagus | ESCC | carboxylic acid biosynthetic process | 175/8552 | 314/18723 | 1.98e-04 | 1.26e-03 | 175 |
| GO:00067661 | Esophagus | ESCC | vitamin metabolic process | 67/8552 | 106/18723 | 2.03e-04 | 1.28e-03 | 67 |
| GO:00160538 | Esophagus | ESCC | organic acid biosynthetic process | 175/8552 | 316/18723 | 3.04e-04 | 1.82e-03 | 175 |
| GO:00723297 | Esophagus | ESCC | monocarboxylic acid catabolic process | 74/8552 | 122/18723 | 6.03e-04 | 3.27e-03 | 74 |
| GO:00421805 | Esophagus | ESCC | cellular ketone metabolic process | 120/8552 | 211/18723 | 6.70e-04 | 3.55e-03 | 120 |
| GO:00442827 | Esophagus | ESCC | small molecule catabolic process | 201/8552 | 376/18723 | 1.35e-03 | 6.41e-03 | 201 |
| GO:00160427 | Esophagus | ESCC | lipid catabolic process | 168/8552 | 320/18723 | 7.97e-03 | 2.84e-02 | 168 |
| GO:004206020 | Oral cavity | OSCC | wound healing | 237/7305 | 422/18723 | 4.51e-13 | 2.18e-11 | 237 |
| GO:19016613 | Oral cavity | OSCC | quinone metabolic process | 32/7305 | 40/18723 | 1.40e-07 | 2.34e-06 | 32 |
| GO:00421804 | Oral cavity | OSCC | cellular ketone metabolic process | 111/7305 | 211/18723 | 3.94e-05 | 3.45e-04 | 111 |
| GO:00160537 | Oral cavity | OSCC | organic acid biosynthetic process | 155/7305 | 316/18723 | 1.64e-04 | 1.13e-03 | 155 |
| GO:00463947 | Oral cavity | OSCC | carboxylic acid biosynthetic process | 154/7305 | 314/18723 | 1.73e-04 | 1.19e-03 | 154 |
| GO:00066317 | Oral cavity | OSCC | fatty acid metabolic process | 186/7305 | 390/18723 | 2.65e-04 | 1.69e-03 | 186 |
| GO:00723296 | Oral cavity | OSCC | monocarboxylic acid catabolic process | 66/7305 | 122/18723 | 5.02e-04 | 2.95e-03 | 66 |
| GO:005087819 | Oral cavity | OSCC | regulation of body fluid levels | 179/7305 | 379/18723 | 6.19e-04 | 3.50e-03 | 179 |
| GO:00442826 | Oral cavity | OSCC | small molecule catabolic process | 174/7305 | 376/18723 | 2.25e-03 | 1.00e-02 | 174 |
| Page: 1 2 |
| Pathway ID | Tissue | Disease Stage | Description | Gene Ratio | Bg Ratio | pvalue | p.adjust | qvalue | Count |
| Page: 1 |
Top |
Cell-cell communication analysis |
| Identification of potential cell-cell interactions between two cell types and their ligand-receptor pairs for different disease states |
| Ligand | Receptor | LRpair | Pathway | Tissue | Disease Stage |
| Page: 1 |
Top |
Single-cell gene regulatory network inference analysis |
| Find out the significant the regulons (TFs) and the target genes of each regulon across cell types for different disease states |
| TF | Cell Type | Tissue | Disease Stage | Target Gene | RSS | Regulon Activity |
| ∗The dot plots of a searched regulon are shown for all cell subpopulations in each disease state of each tissue based on the regulon specific score inferred using pySCENIC and by calculating the average expression. |
| Page: 1 |
Top |
Somatic mutation of malignant transformation related genes |
| Annotation of somatic variants for genes involved in malignant transformation |
| Hugo Symbol | Variant Class | Variant Classification | dbSNP RS | HGVSc | HGVSp | HGVSp Short | SWISSPROT | BIOTYPE | SIFT | PolyPhen | Tumor Sample Barcode | Tissue | Histology | Sex | Age | Stage | Therapy Types | Drugs | Outcome |
| CYP4F11 | SNV | Missense_Mutation | c.372N>G | p.Phe124Leu | p.F124L | Q9HBI6 | protein_coding | tolerated(0.11) | benign(0.12) | TCGA-5L-AAT1-01 | Breast | breast invasive carcinoma | Female | <65 | III/IV | Hormone Therapy | letrozol | SD | |
| CYP4F11 | SNV | Missense_Mutation | c.718N>G | p.Leu240Val | p.L240V | Q9HBI6 | protein_coding | tolerated(0.41) | benign(0.291) | TCGA-A2-A0T0-01 | Breast | breast invasive carcinoma | Female | <65 | I/II | Chemotherapy | taxotere | SD | |
| CYP4F11 | SNV | Missense_Mutation | rs771510465 | c.445N>T | p.Arg149Trp | p.R149W | Q9HBI6 | protein_coding | deleterious(0) | possibly_damaging(0.555) | TCGA-B6-A0IJ-01 | Breast | breast invasive carcinoma | Female | <65 | I/II | Unknown | Unknown | SD |
| CYP4F11 | SNV | Missense_Mutation | c.745N>G | p.Leu249Val | p.L249V | Q9HBI6 | protein_coding | deleterious(0.01) | possibly_damaging(0.603) | TCGA-BH-A0B5-01 | Breast | breast invasive carcinoma | Female | <65 | III/IV | Chemotherapy | adriamycin | CR | |
| CYP4F11 | SNV | Missense_Mutation | novel | c.922N>A | p.Glu308Lys | p.E308K | Q9HBI6 | protein_coding | deleterious(0.04) | benign(0.327) | TCGA-BH-A0B6-01 | Breast | breast invasive carcinoma | Female | <65 | I/II | Unknown | Unknown | SD |
| CYP4F11 | SNV | Missense_Mutation | rs765039646 | c.559G>A | p.Ala187Thr | p.A187T | Q9HBI6 | protein_coding | tolerated(1) | benign(0.006) | TCGA-D8-A142-01 | Breast | breast invasive carcinoma | Female | >=65 | I/II | Chemotherapy | cyclophosphamid | SD |
| CYP4F11 | SNV | Missense_Mutation | c.251N>G | p.Tyr84Cys | p.Y84C | Q9HBI6 | protein_coding | deleterious(0.02) | benign(0.164) | TCGA-E9-A1R0-01 | Breast | breast invasive carcinoma | Female | <65 | I/II | Chemotherapy | cyclophosphamide | SD | |
| CYP4F11 | SNV | Missense_Mutation | c.946G>A | p.Glu316Lys | p.E316K | Q9HBI6 | protein_coding | tolerated(0.11) | benign(0.181) | TCGA-EK-A2PL-01 | Cervix | cervical & endocervical cancer | Female | <65 | III/IV | Unknown | Unknown | SD | |
| CYP4F11 | SNV | Missense_Mutation | rs376221111 | c.1030N>T | p.Leu344Phe | p.L344F | Q9HBI6 | protein_coding | deleterious(0.01) | probably_damaging(0.99) | TCGA-EK-A2PM-01 | Cervix | cervical & endocervical cancer | Female | >=65 | I/II | Unknown | Unknown | SD |
| CYP4F11 | SNV | Missense_Mutation | c.1045G>A | p.Glu349Lys | p.E349K | Q9HBI6 | protein_coding | deleterious(0.01) | benign(0.35) | TCGA-AA-A00N-01 | Colorectum | colon adenocarcinoma | Male | >=65 | I/II | Unknown | Unknown | PD |
| Page: 1 2 3 4 5 6 7 8 |
Top |
Related drugs of malignant transformation related genes |
| Identification of chemicals and drugs interact with genes involved in malignant transfromation |
| (DGIdb 4.0) |
| Entrez ID | Symbol | Category | Interaction Types | Drug Claim Name | Drug Name | PMIDs |
| 57834 | CYP4F11 | DRUGGABLE GENOME, ENZYME, CYTOCHROME P450 | warfarin | WARFARIN | 28620303 |
| Page: 1 |

Copyright 2023-Present -The University of Texas Health Science Center at Houston |