| Tissue | Expression Dynamics | Abbreviation |
| Colorectum (GSE201348) |  | FAP: Familial adenomatous polyposis |
| CRC: Colorectal cancer |
| Colorectum (HTA11) |  | AD: Adenomas |
| SER: Sessile serrated lesions |
| MSI-H: Microsatellite-high colorectal cancer |
| MSS: Microsatellite stable colorectal cancer |
| Esophagus | 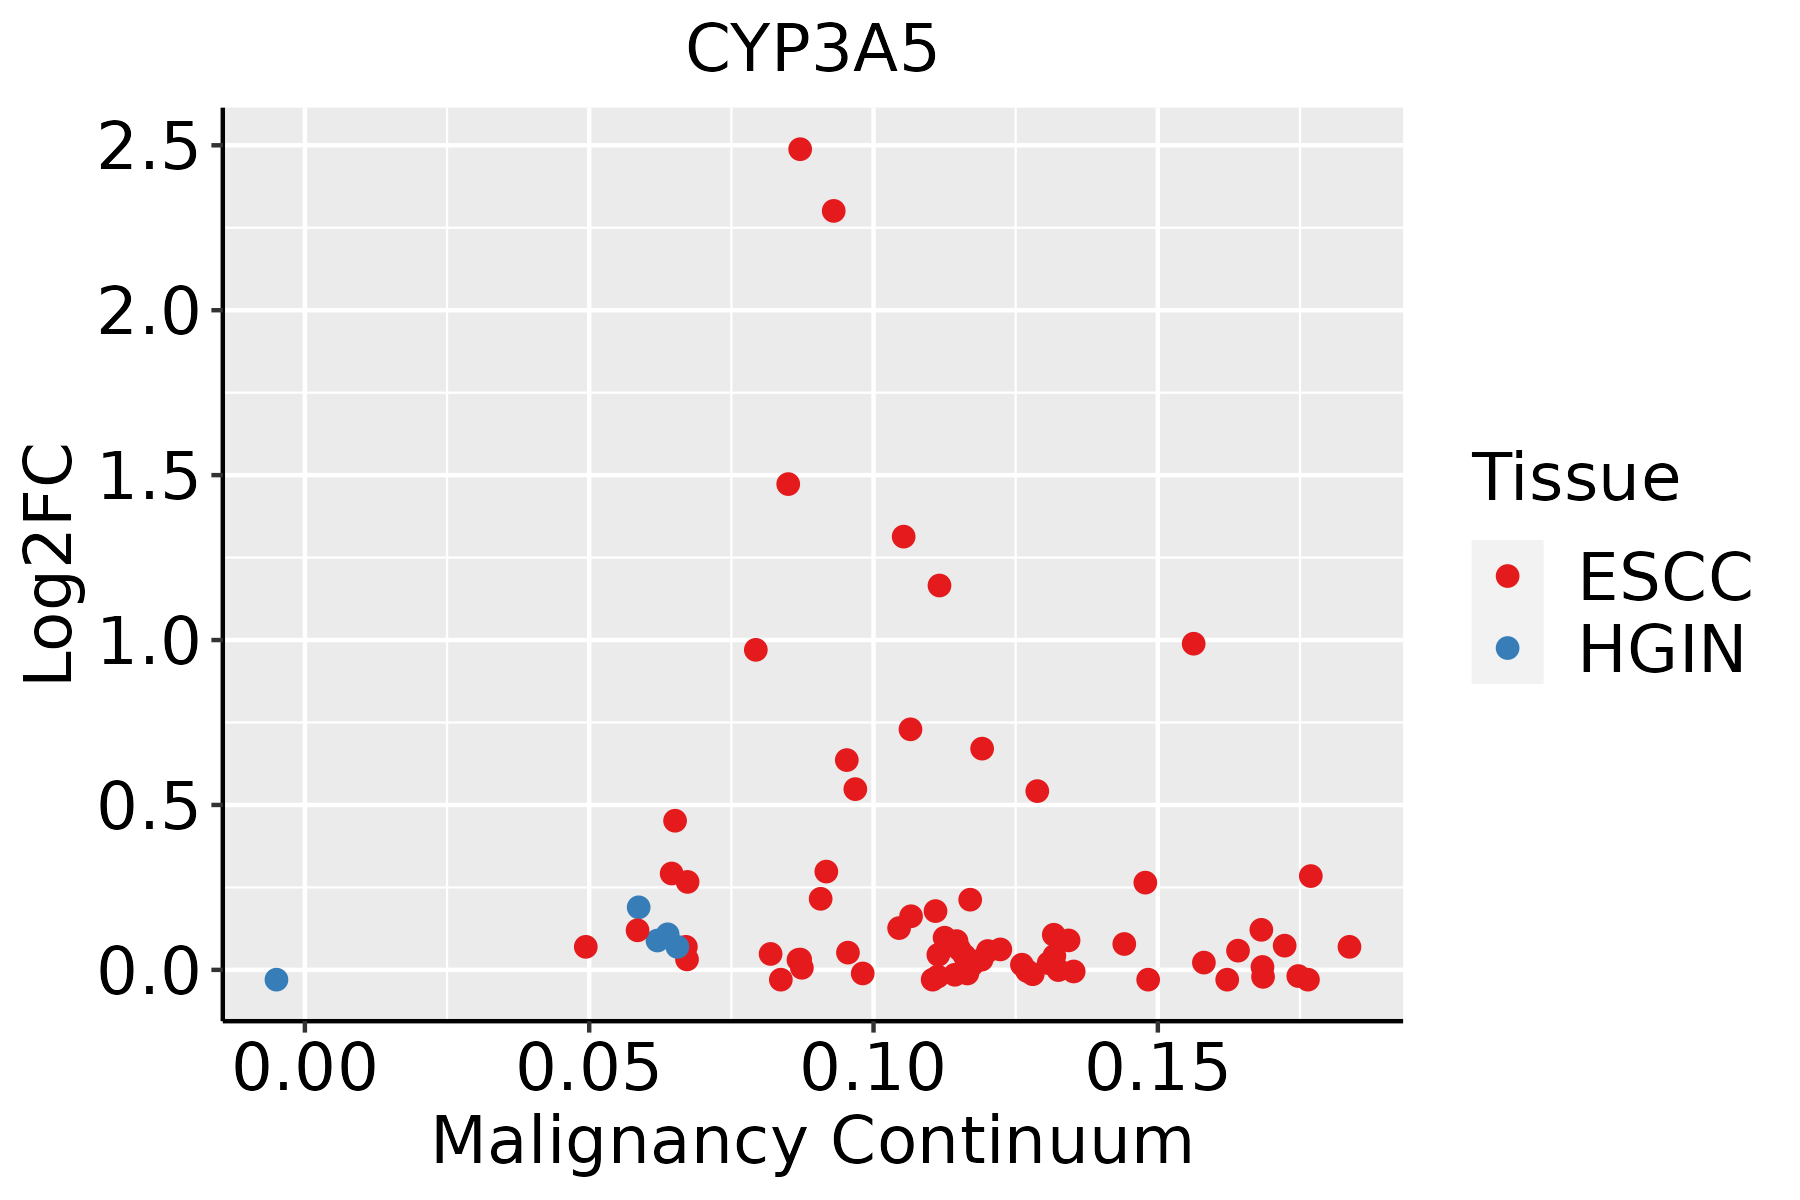 | ESCC: Esophageal squamous cell carcinoma |
| HGIN: High-grade intraepithelial neoplasias |
| LGIN: Low-grade intraepithelial neoplasias |
| GC |  | CAG: Chronic atrophic gastritis |
| CAG with IM: Chronic atrophic gastritis with intestinal metaplasia |
| CSG: Chronic superficial gastritis |
| GC: Gastric cancer |
| SIM: Severe intestinal metaplasia |
| WIM: Wild intestinal metaplasia |
| Liver | 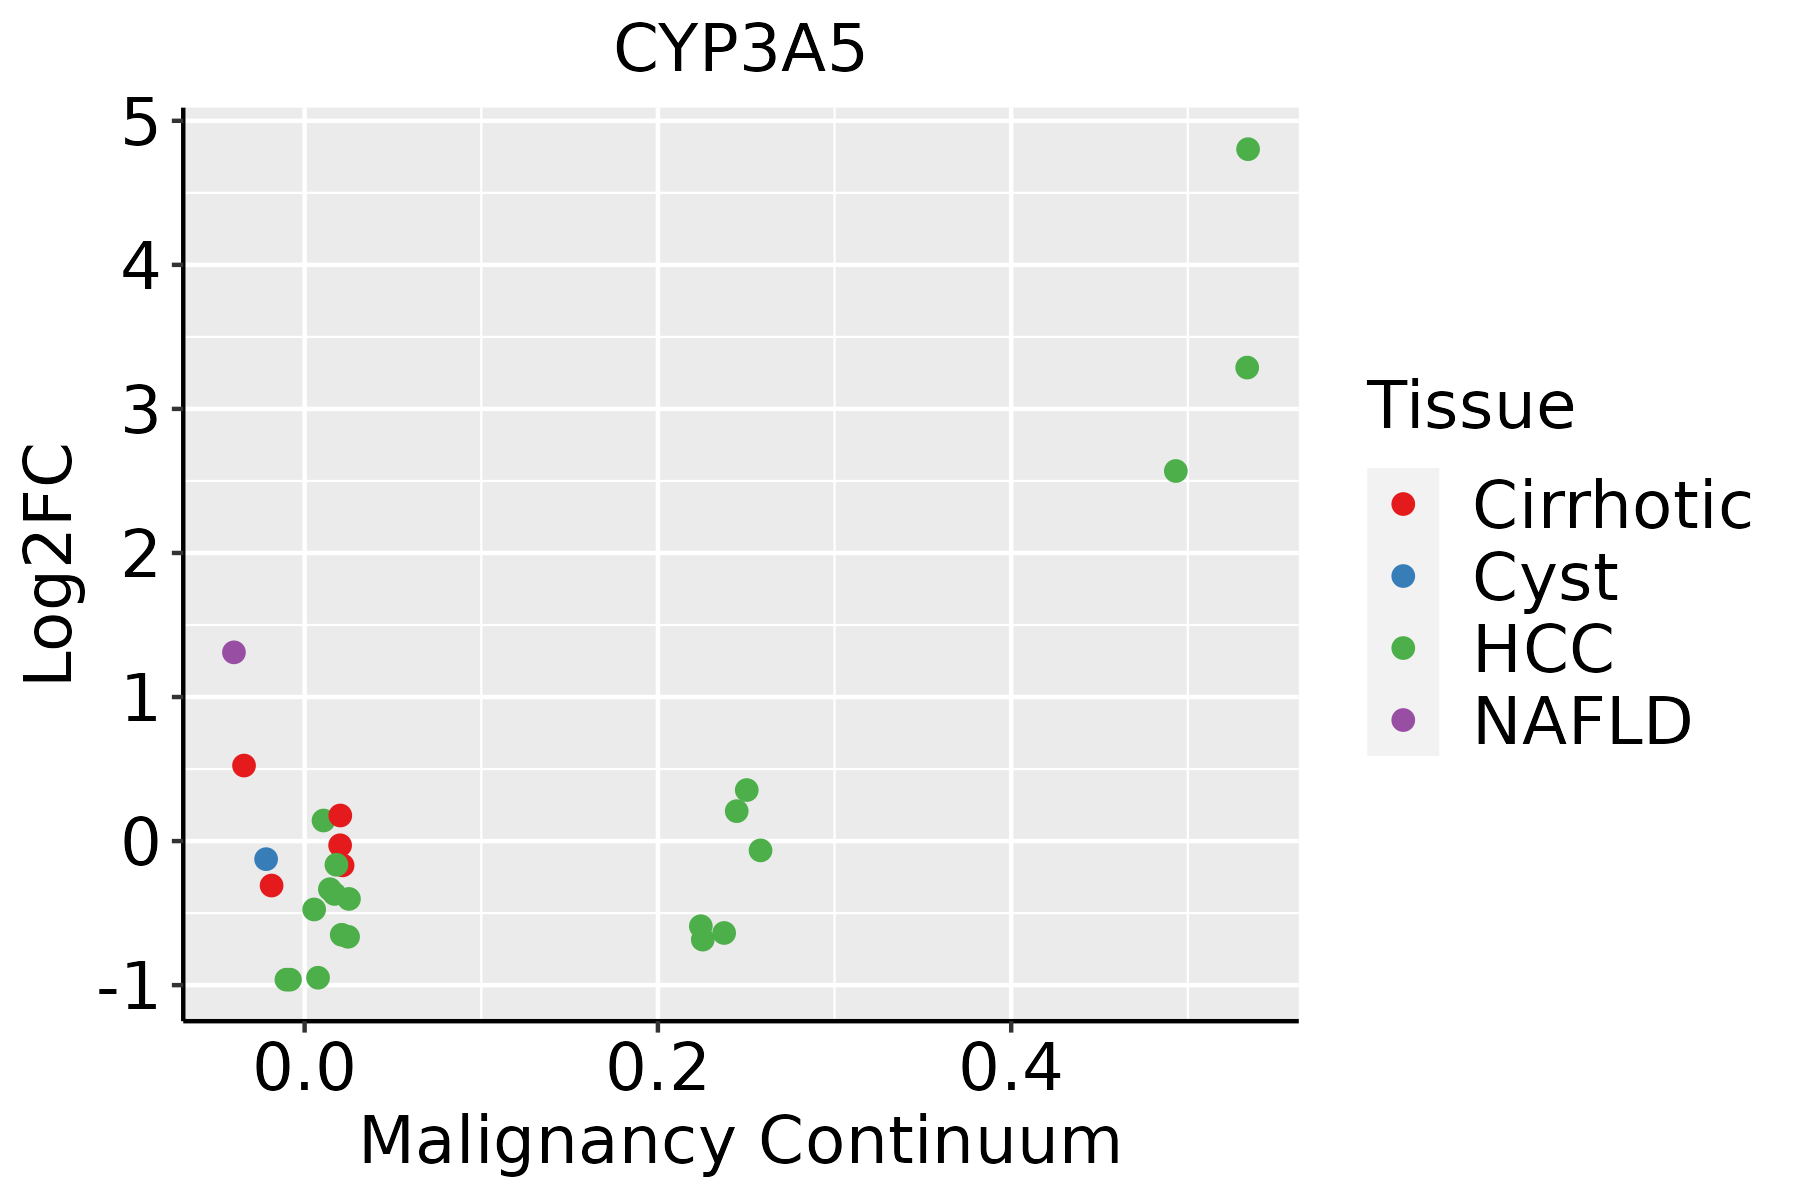 | HCC: Hepatocellular carcinoma |
| NAFLD: Non-alcoholic fatty liver disease |
| Lung | 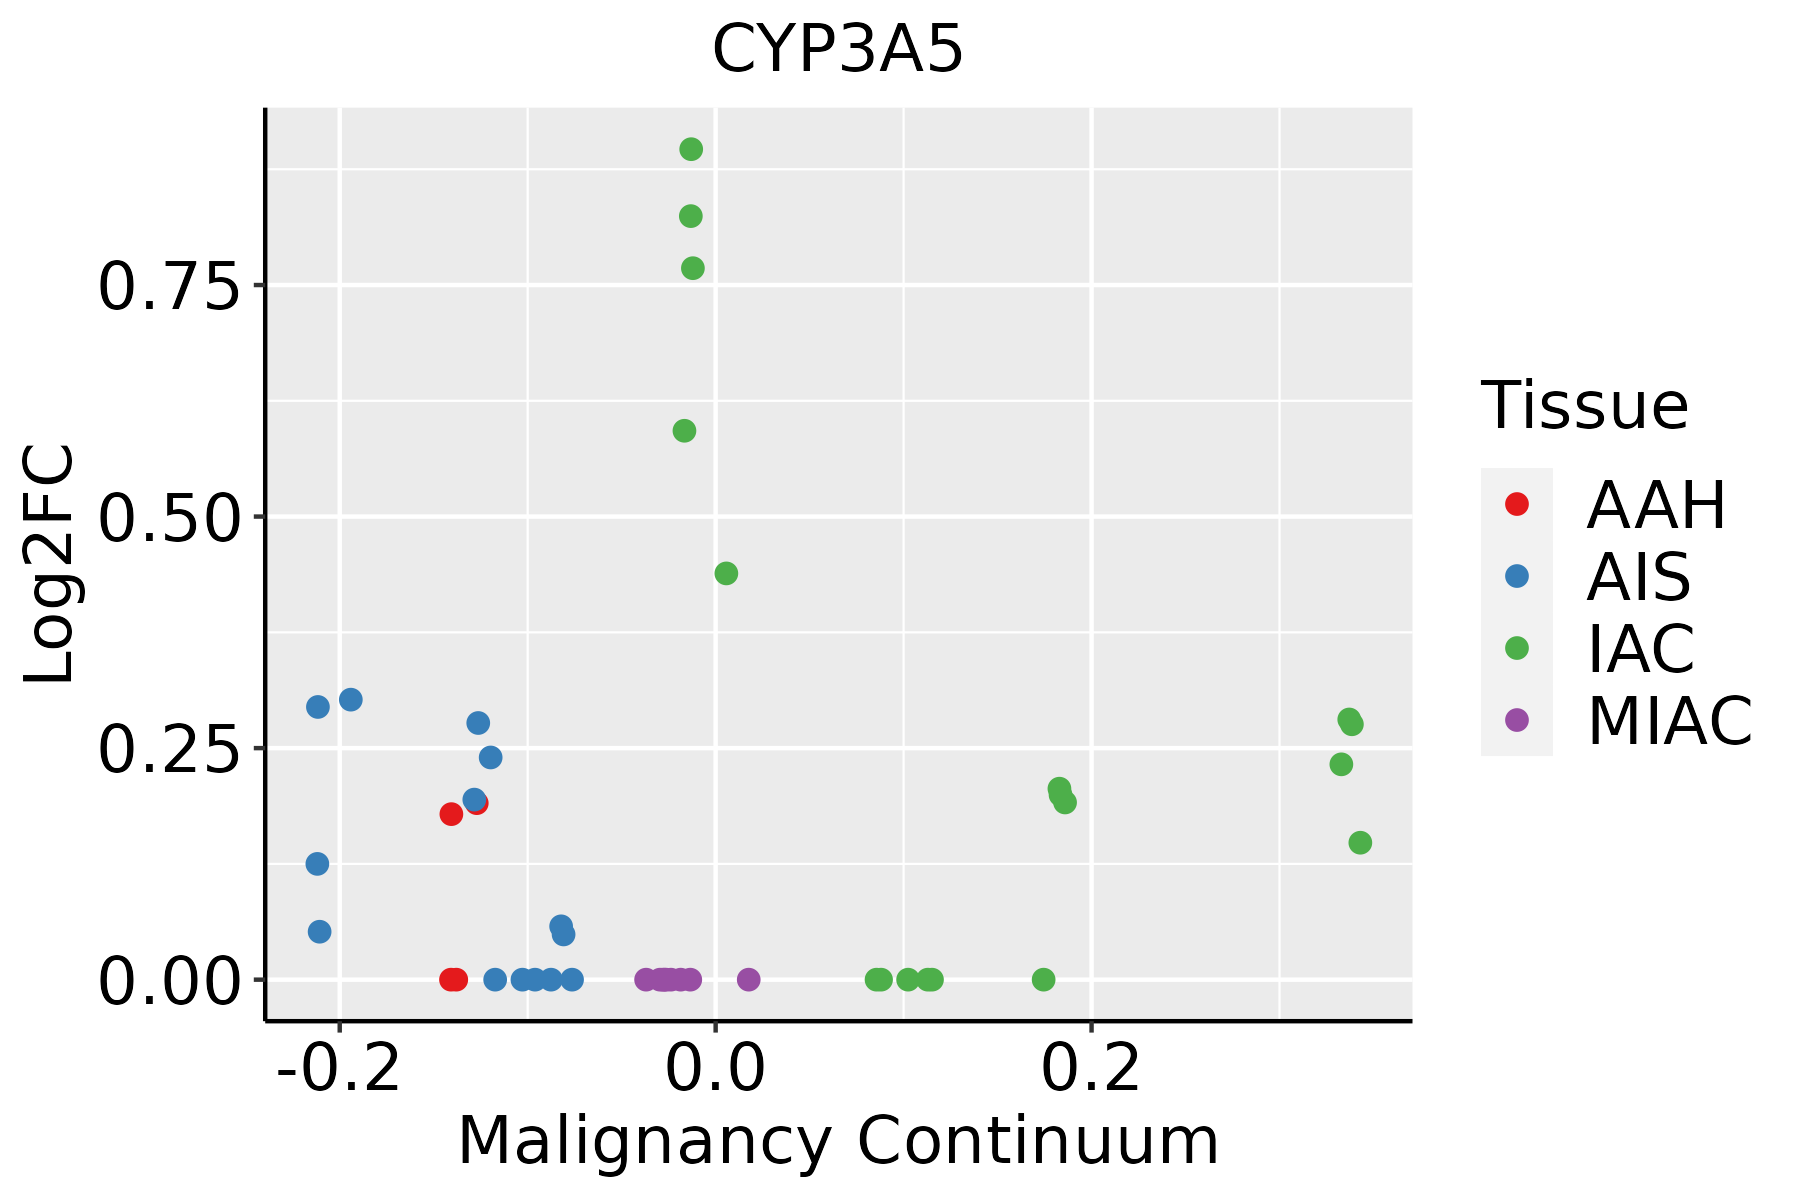 | AAH: Atypical adenomatous hyperplasia |
| AIS: Adenocarcinoma in situ |
| IAC: Invasive lung adenocarcinoma |
| MIA: Minimally invasive adenocarcinoma |
| Prostate | 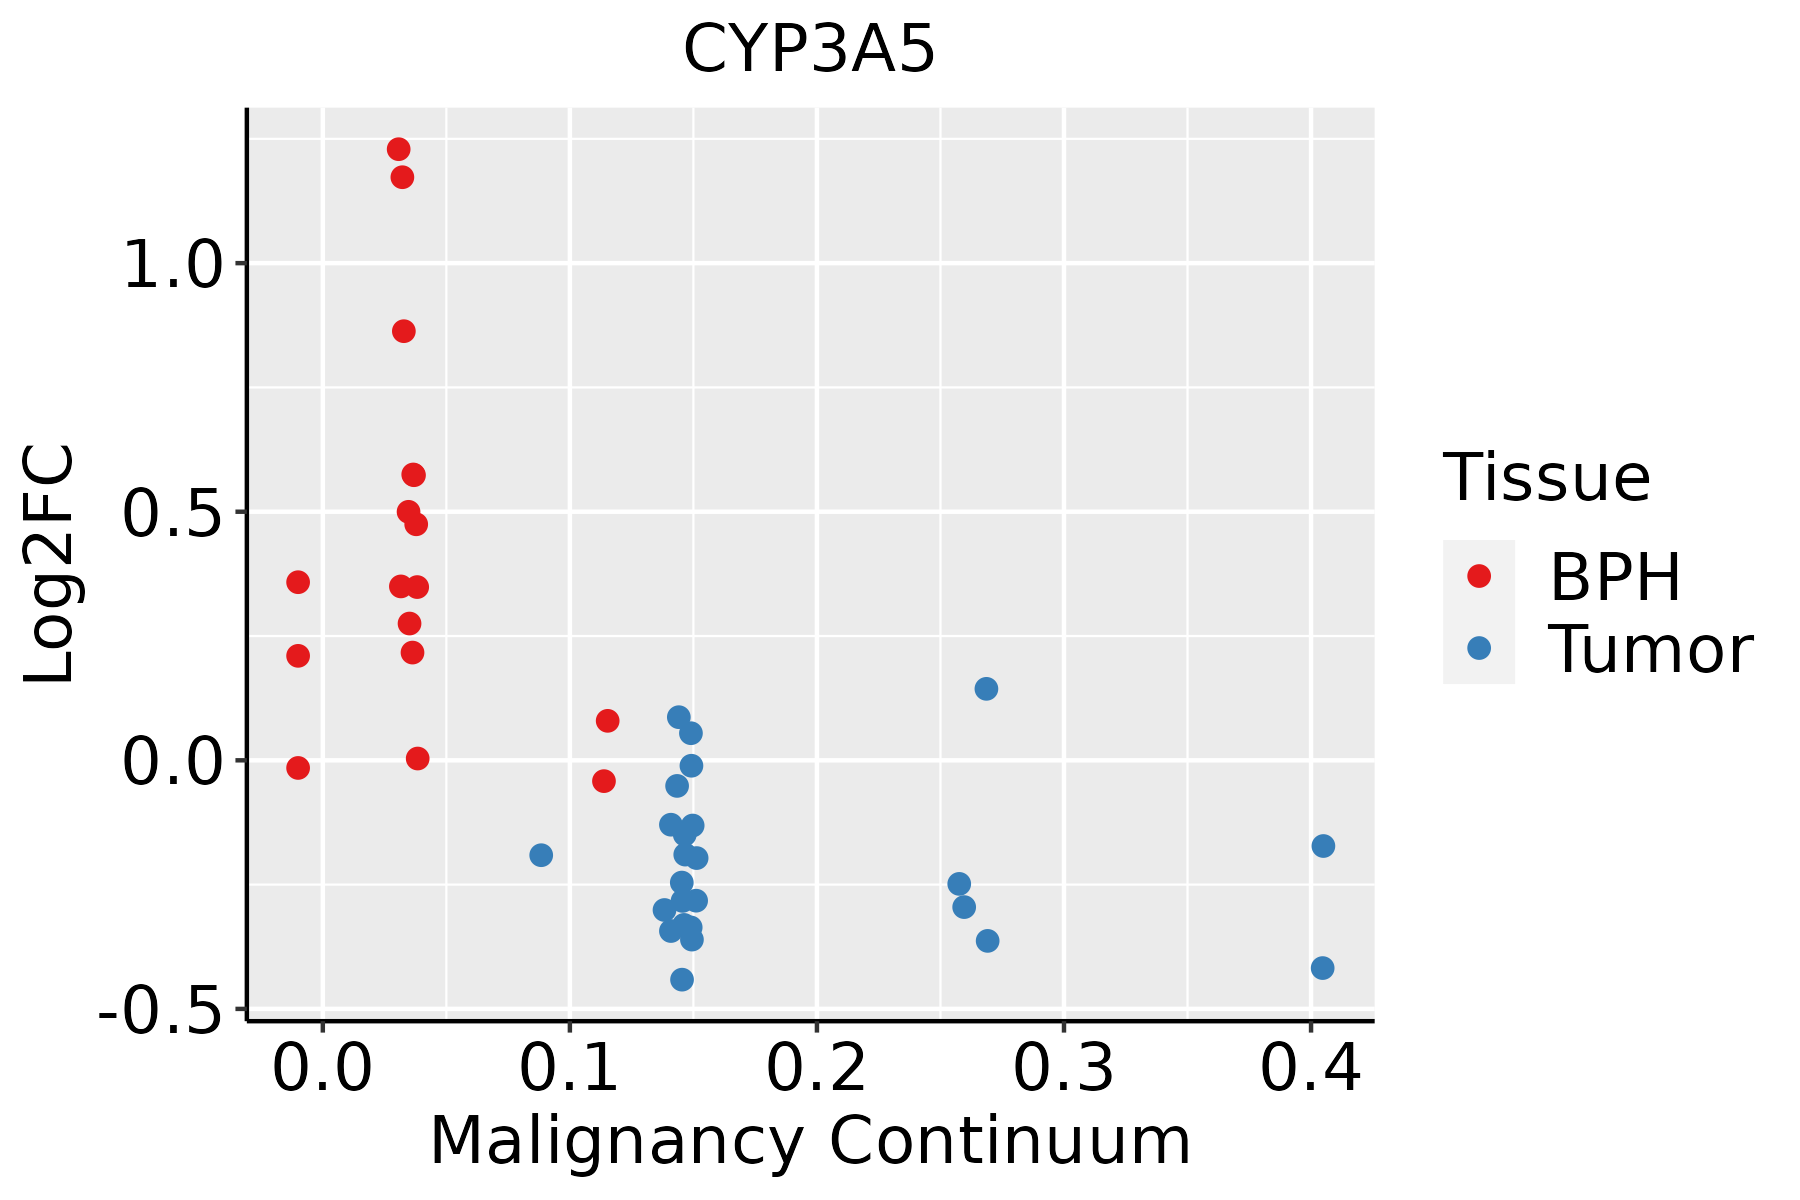 | BPH: Benign Prostatic Hyperplasia |
| GO ID | Tissue | Disease Stage | Description | Gene Ratio | Bg Ratio | pvalue | p.adjust | Count |
| GO:0044270 | Colorectum | AD | cellular nitrogen compound catabolic process | 147/3918 | 451/18723 | 3.35e-09 | 2.23e-07 | 147 |
| GO:0006066 | Colorectum | AD | alcohol metabolic process | 106/3918 | 353/18723 | 3.02e-05 | 5.57e-04 | 106 |
| GO:0030258 | Colorectum | AD | lipid modification | 67/3918 | 212/18723 | 1.66e-04 | 2.27e-03 | 67 |
| GO:0009410 | Colorectum | AD | response to xenobiotic stimulus | 128/3918 | 462/18723 | 2.69e-04 | 3.31e-03 | 128 |
| GO:0034308 | Colorectum | AD | primary alcohol metabolic process | 35/3918 | 102/18723 | 1.16e-03 | 1.05e-02 | 35 |
| GO:0008202 | Colorectum | AD | steroid metabolic process | 85/3918 | 319/18723 | 8.07e-03 | 4.75e-02 | 85 |
| GO:00442702 | Colorectum | MSS | cellular nitrogen compound catabolic process | 141/3467 | 451/18723 | 2.95e-11 | 3.83e-09 | 141 |
| GO:00060662 | Colorectum | MSS | alcohol metabolic process | 92/3467 | 353/18723 | 2.57e-04 | 3.46e-03 | 92 |
| GO:00302582 | Colorectum | MSS | lipid modification | 57/3467 | 212/18723 | 1.64e-03 | 1.49e-02 | 57 |
| GO:00094101 | Colorectum | MSS | response to xenobiotic stimulus | 110/3467 | 462/18723 | 2.36e-03 | 1.92e-02 | 110 |
| GO:00442704 | Colorectum | FAP | cellular nitrogen compound catabolic process | 101/2622 | 451/18723 | 7.42e-07 | 3.44e-05 | 101 |
| GO:00302583 | Colorectum | FAP | lipid modification | 52/2622 | 212/18723 | 2.84e-05 | 6.49e-04 | 52 |
| GO:00094102 | Colorectum | FAP | response to xenobiotic stimulus | 87/2622 | 462/18723 | 2.15e-03 | 1.77e-02 | 87 |
| GO:00060663 | Colorectum | FAP | alcohol metabolic process | 69/2622 | 353/18723 | 2.29e-03 | 1.85e-02 | 69 |
| GO:00442705 | Colorectum | CRC | cellular nitrogen compound catabolic process | 78/2078 | 451/18723 | 4.48e-05 | 1.07e-03 | 78 |
| GO:00302584 | Colorectum | CRC | lipid modification | 41/2078 | 212/18723 | 2.73e-04 | 4.38e-03 | 41 |
| GO:00060664 | Colorectum | CRC | alcohol metabolic process | 57/2078 | 353/18723 | 2.37e-03 | 2.27e-02 | 57 |
| GO:00094103 | Colorectum | CRC | response to xenobiotic stimulus | 69/2078 | 462/18723 | 6.34e-03 | 4.61e-02 | 69 |
| GO:004427019 | Esophagus | ESCC | cellular nitrogen compound catabolic process | 288/8552 | 451/18723 | 3.03e-15 | 1.79e-13 | 288 |
| GO:00060668 | Esophagus | ESCC | alcohol metabolic process | 202/8552 | 353/18723 | 7.32e-06 | 7.26e-05 | 202 |
| Hugo Symbol | Variant Class | Variant Classification | dbSNP RS | HGVSc | HGVSp | HGVSp Short | SWISSPROT | BIOTYPE | SIFT | PolyPhen | Tumor Sample Barcode | Tissue | Histology | Sex | Age | Stage | Therapy Types | Drugs | Outcome |
| CYP3A5 | SNV | Missense_Mutation | novel | c.1031C>T | p.Pro344Leu | p.P344L | P20815 | protein_coding | tolerated(0.14) | benign(0.05) | TCGA-A2-A4RW-01 | Breast | breast invasive carcinoma | Female | <65 | III/IV | Unknown | Unknown | SD |
| CYP3A5 | SNV | Missense_Mutation | novel | c.1502N>C | p.Gly501Ala | p.G501A | P20815 | protein_coding | tolerated(0.16) | possibly_damaging(0.506) | TCGA-A7-A6VY-01 | Breast | breast invasive carcinoma | Female | <65 | I/II | Chemotherapy | cyclophosphamide | CR |
| CYP3A5 | SNV | Missense_Mutation | | c.1395N>C | p.Lys465Asn | p.K465N | P20815 | protein_coding | deleterious(0.03) | benign(0.027) | TCGA-AO-A128-01 | Breast | breast invasive carcinoma | Female | <65 | I/II | Chemotherapy | doxorubicin | SD |
| CYP3A5 | insertion | In_Frame_Ins | novel | c.386_387insCCACAAGAC | p.Ile129_Arg130insHisLysThr | p.I129_R130insHKT | P20815 | protein_coding | | | TCGA-A8-A08H-01 | Breast | breast invasive carcinoma | Female | >=65 | I/II | Unknown | Unknown | SD |
| CYP3A5 | insertion | Frame_Shift_Ins | novel | c.384_385insCTCTCTCAACA | p.Ile129LeufsTer33 | p.I129Lfs*33 | P20815 | protein_coding | | | TCGA-A8-A08H-01 | Breast | breast invasive carcinoma | Female | >=65 | I/II | Unknown | Unknown | SD |
| CYP3A5 | SNV | Missense_Mutation | novel | c.838A>C | p.Asn280His | p.N280H | P20815 | protein_coding | deleterious(0.02) | benign(0.2) | TCGA-2W-A8YY-01 | Cervix | cervical & endocervical cancer | Female | <65 | I/II | Chemotherapy | cisplatin | CR |
| CYP3A5 | SNV | Missense_Mutation | novel | c.210A>C | p.Lys70Asn | p.K70N | P20815 | protein_coding | tolerated(0.09) | benign(0.11) | TCGA-2W-A8YY-01 | Cervix | cervical & endocervical cancer | Female | <65 | I/II | Chemotherapy | cisplatin | CR |
| CYP3A5 | SNV | Missense_Mutation | | c.652N>G | p.Pro218Ala | p.P218A | P20815 | protein_coding | deleterious(0) | possibly_damaging(0.752) | TCGA-JW-A5VL-01 | Cervix | cervical & endocervical cancer | Female | <65 | I/II | Unknown | Unknown | SD |
| CYP3A5 | SNV | Missense_Mutation | novel | c.877N>G | p.Leu293Val | p.L293V | P20815 | protein_coding | tolerated(0.29) | benign(0) | TCGA-VS-A958-01 | Cervix | cervical & endocervical cancer | Female | <65 | I/II | Chemotherapy | cisplatin | CR |
| CYP3A5 | SNV | Missense_Mutation | | c.742T>G | p.Phe248Val | p.F248V | P20815 | protein_coding | deleterious(0) | probably_damaging(0.988) | TCGA-AA-3977-01 | Colorectum | colon adenocarcinoma | Male | >=65 | I/II | Unknown | Unknown | SD |
| Entrez ID | Symbol | Category | Interaction Types | Drug Claim Name | Drug Name | PMIDs |
| 1577 | CYP3A5 | ENZYME, CYTOCHROME P450, DRUGGABLE GENOME, CLINICALLY ACTIONABLE | | fluticasone propionate | | 18695978 |
| 1577 | CYP3A5 | ENZYME, CYTOCHROME P450, DRUGGABLE GENOME, CLINICALLY ACTIONABLE | | haloperidol | HALOPERIDOL | 27023437,18695978 |
| 1577 | CYP3A5 | ENZYME, CYTOCHROME P450, DRUGGABLE GENOME, CLINICALLY ACTIONABLE | | TESMILIFENE | TESMILIFENE | |
| 1577 | CYP3A5 | ENZYME, CYTOCHROME P450, DRUGGABLE GENOME, CLINICALLY ACTIONABLE | | diazepam | DIAZEPAM | 18695978 |
| 1577 | CYP3A5 | ENZYME, CYTOCHROME P450, DRUGGABLE GENOME, CLINICALLY ACTIONABLE | | rosuvastatin | ROSUVASTATIN | 20207952 |
| 1577 | CYP3A5 | ENZYME, CYTOCHROME P450, DRUGGABLE GENOME, CLINICALLY ACTIONABLE | | cilostazol | CILOSTAZOL | |
| 1577 | CYP3A5 | ENZYME, CYTOCHROME P450, DRUGGABLE GENOME, CLINICALLY ACTIONABLE | | buprenorphine | BUPRENORPHINE | 18695978 |
| 1577 | CYP3A5 | ENZYME, CYTOCHROME P450, DRUGGABLE GENOME, CLINICALLY ACTIONABLE | | tramadol | TRAMADOL | 18695978 |
| 1577 | CYP3A5 | ENZYME, CYTOCHROME P450, DRUGGABLE GENOME, CLINICALLY ACTIONABLE | | apixaban | APIXABAN | 28678049,29457840 |
| 1577 | CYP3A5 | ENZYME, CYTOCHROME P450, DRUGGABLE GENOME, CLINICALLY ACTIONABLE | | meperidine | MEPERIDINE | 18695978 |


