
|
|||||
|
 | |
| |
| |
| |
| |
| |
|
Gene: CYP2W1 |
Gene summary for CYP2W1 |
| Gene information | Species | Human | Gene symbol | CYP2W1 | Gene ID | 54905 |
| Gene name | cytochrome P450 family 2 subfamily W member 1 | |
| Gene Alias | CYP2W1 | |
| Cytomap | 7p22.3 | |
| Gene Type | protein-coding | GO ID | GO:0001523 | UniProtAcc | Q8TAV3 |
Top |
Malignant transformation analysis |
| Identification of the aberrant gene expression in precancerous and cancerous lesions by comparing the gene expression of stem-like cells in diseased tissues with normal stem cells |
| Entrez ID | Symbol | Replicates | Species | Organ | Tissue | Adj P-value | Log2FC | Malignancy |
| 54905 | CYP2W1 | HTA11_99999973899_84307 | Human | Colorectum | MSS | 1.44e-03 | 3.65e-01 | 0.2585 |
| 54905 | CYP2W1 | HTA11_99999974143_84620 | Human | Colorectum | MSS | 3.15e-28 | 7.77e-01 | 0.3005 |
| 54905 | CYP2W1 | CRC-1-8810 | Human | Colorectum | CRC | 3.72e-15 | 5.94e-01 | 0.6257 |
| 54905 | CYP2W1 | CRC-3-11773 | Human | Colorectum | CRC | 2.72e-33 | 9.63e-01 | 0.2564 |
| 54905 | CYP2W1 | P2T-E | Human | Esophagus | ESCC | 9.67e-18 | 3.36e-01 | 0.1177 |
| 54905 | CYP2W1 | P4T-E | Human | Esophagus | ESCC | 4.27e-09 | 2.54e-01 | 0.1323 |
| 54905 | CYP2W1 | P8T-E | Human | Esophagus | ESCC | 3.97e-04 | 1.55e-01 | 0.0889 |
| 54905 | CYP2W1 | P10T-E | Human | Esophagus | ESCC | 5.94e-62 | 1.01e+00 | 0.116 |
| 54905 | CYP2W1 | P12T-E | Human | Esophagus | ESCC | 2.27e-21 | 4.53e-01 | 0.1122 |
| 54905 | CYP2W1 | P22T-E | Human | Esophagus | ESCC | 3.50e-02 | 8.07e-02 | 0.1236 |
| 54905 | CYP2W1 | P27T-E | Human | Esophagus | ESCC | 3.75e-03 | 9.29e-02 | 0.1055 |
| 54905 | CYP2W1 | P74T-E | Human | Esophagus | ESCC | 5.32e-11 | 3.31e-01 | 0.1479 |
| 54905 | CYP2W1 | P75T-E | Human | Esophagus | ESCC | 3.75e-03 | 5.98e-01 | 0.1125 |
| 54905 | CYP2W1 | P82T-E | Human | Esophagus | ESCC | 1.40e-05 | 4.37e-01 | 0.1072 |
| 54905 | CYP2W1 | P89T-E | Human | Esophagus | ESCC | 3.85e-03 | 2.48e-01 | 0.1752 |
| 54905 | CYP2W1 | P130T-E | Human | Esophagus | ESCC | 1.97e-10 | 2.77e-01 | 0.1676 |
| Page: 1 |
| Tissue | Expression Dynamics | Abbreviation |
| Colorectum (GSE201348) |  | FAP: Familial adenomatous polyposis |
| CRC: Colorectal cancer | ||
| Colorectum (HTA11) | 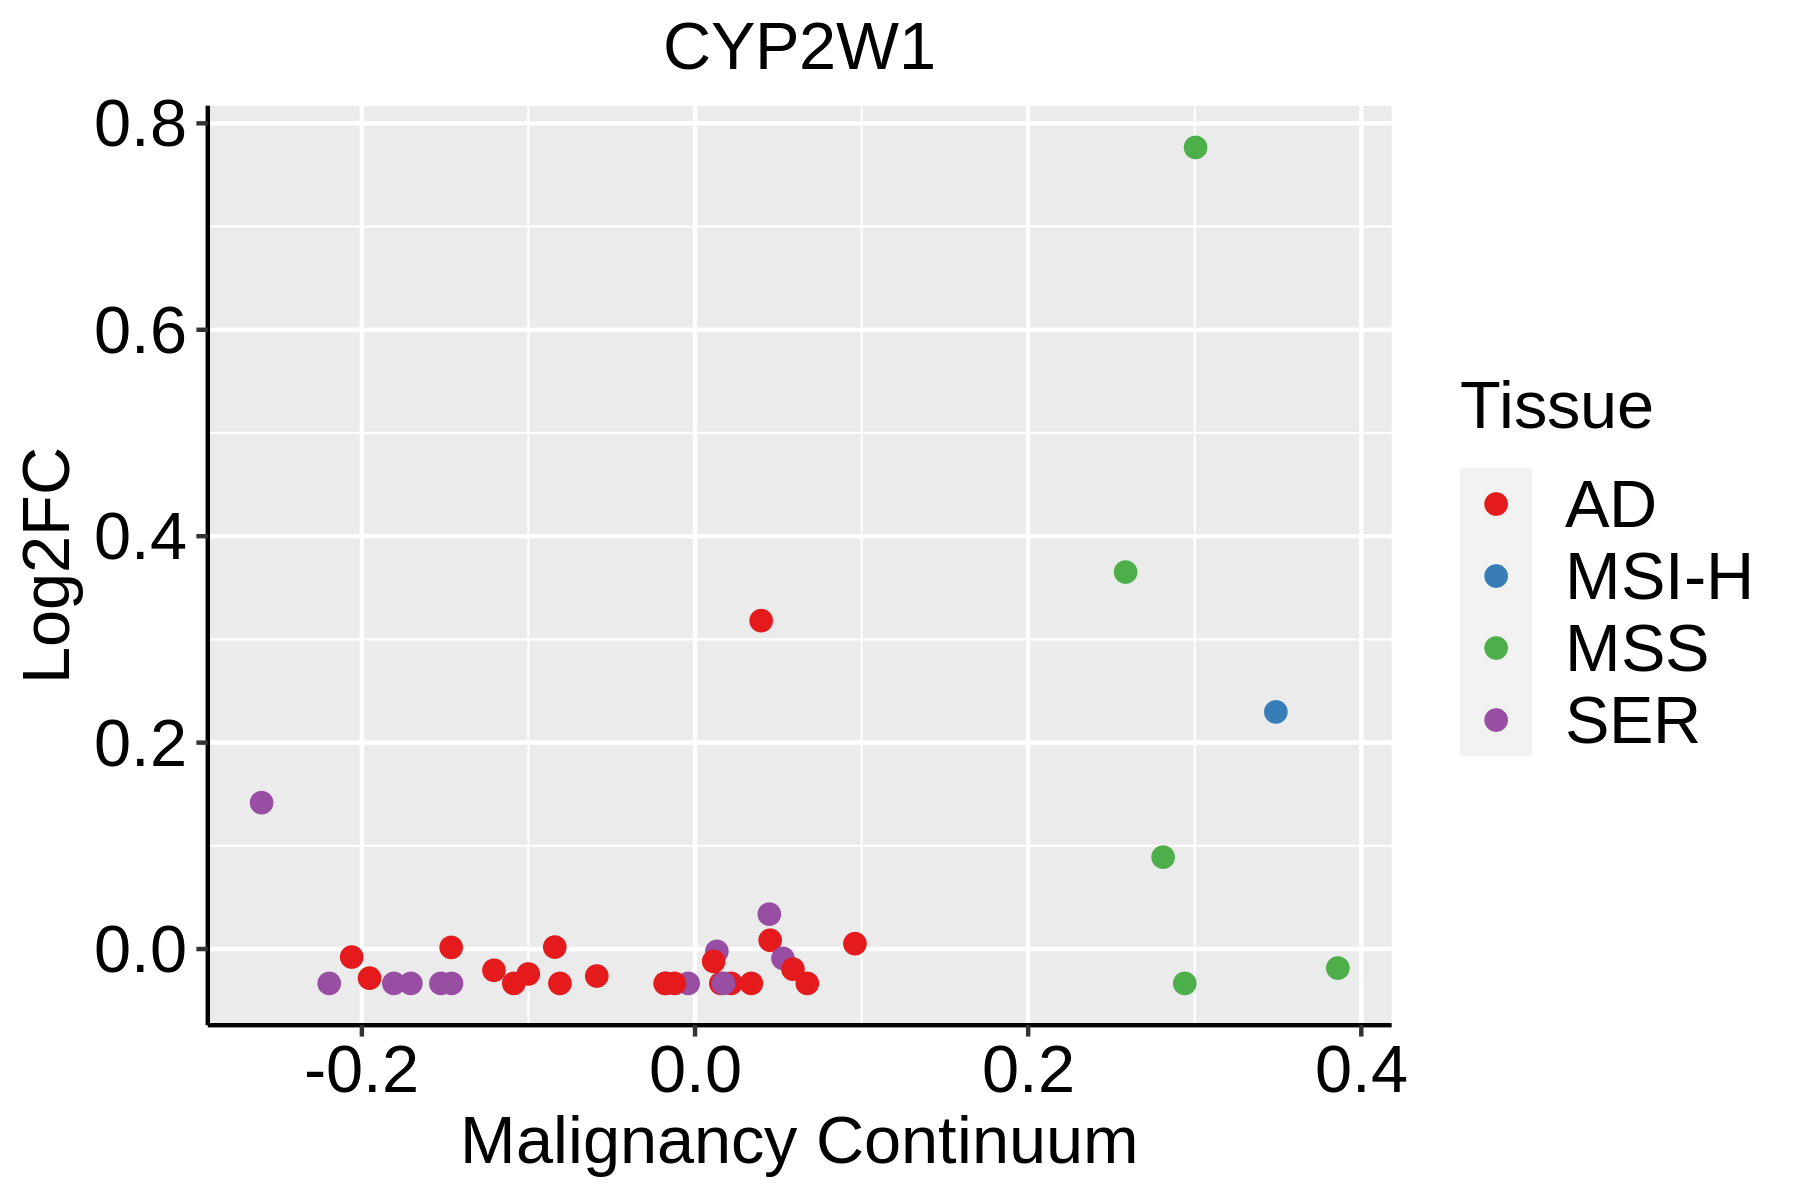 | AD: Adenomas |
| SER: Sessile serrated lesions | ||
| MSI-H: Microsatellite-high colorectal cancer | ||
| MSS: Microsatellite stable colorectal cancer | ||
| Esophagus |  | ESCC: Esophageal squamous cell carcinoma |
| HGIN: High-grade intraepithelial neoplasias | ||
| LGIN: Low-grade intraepithelial neoplasias |
| ∗log2FC in expression of this searched gene in stem-like cells from each diseased tissue sample relative to stem-like cells in normal samples in each tissue plotted against the malignancy continuum. Samples are colored based on if they are from different disease stage. |
Top |
Malignant transformation related pathway analysis |
| Find out the enriched GO biological processes and KEGG pathways involved in transition from healthy to precancer to cancer |
| Tissue | Disease Stage | Enriched GO biological Processes |
| Colorectum | AD |  |
| Colorectum | SER |  |
| Colorectum | MSS |  |
| Colorectum | MSI-H |  |
| Colorectum | FAP |  |
| ∗Top 15 enriched GO BP terms are showed in the bar plot of each disease state in each tissue. Each row represents a significant GO biological process which is colored according to the -log10(p.adjust). |
| Page: 1 2 3 4 5 6 7 8 9 |
| GO ID | Tissue | Disease Stage | Description | Gene Ratio | Bg Ratio | pvalue | p.adjust | Count |
| GO:00442822 | Colorectum | MSS | small molecule catabolic process | 94/3467 | 376/18723 | 9.85e-04 | 9.86e-03 | 94 |
| GO:00094101 | Colorectum | MSS | response to xenobiotic stimulus | 110/3467 | 462/18723 | 2.36e-03 | 1.92e-02 | 110 |
| GO:00723292 | Colorectum | MSS | monocarboxylic acid catabolic process | 35/3467 | 122/18723 | 3.97e-03 | 2.90e-02 | 35 |
| GO:00160542 | Colorectum | MSS | organic acid catabolic process | 61/3467 | 240/18723 | 4.72e-03 | 3.31e-02 | 61 |
| GO:00160422 | Colorectum | MSS | lipid catabolic process | 77/3467 | 320/18723 | 7.43e-03 | 4.71e-02 | 77 |
| GO:00066443 | Colorectum | CRC | phospholipid metabolic process | 65/2078 | 383/18723 | 3.21e-04 | 4.95e-03 | 65 |
| GO:00160424 | Colorectum | CRC | lipid catabolic process | 53/2078 | 320/18723 | 1.89e-03 | 1.93e-02 | 53 |
| GO:00442423 | Colorectum | CRC | cellular lipid catabolic process | 37/2078 | 214/18723 | 4.16e-03 | 3.40e-02 | 37 |
| GO:00094103 | Colorectum | CRC | response to xenobiotic stimulus | 69/2078 | 462/18723 | 6.34e-03 | 4.61e-02 | 69 |
| GO:00066446 | Esophagus | ESCC | phospholipid metabolic process | 218/8552 | 383/18723 | 5.37e-06 | 5.59e-05 | 218 |
| GO:000941020 | Esophagus | ESCC | response to xenobiotic stimulus | 253/8552 | 462/18723 | 4.55e-05 | 3.58e-04 | 253 |
| GO:00067661 | Esophagus | ESCC | vitamin metabolic process | 67/8552 | 106/18723 | 2.03e-04 | 1.28e-03 | 67 |
| GO:00723297 | Esophagus | ESCC | monocarboxylic acid catabolic process | 74/8552 | 122/18723 | 6.03e-04 | 3.27e-03 | 74 |
| GO:00442427 | Esophagus | ESCC | cellular lipid catabolic process | 121/8552 | 214/18723 | 8.63e-04 | 4.43e-03 | 121 |
| GO:00442827 | Esophagus | ESCC | small molecule catabolic process | 201/8552 | 376/18723 | 1.35e-03 | 6.41e-03 | 201 |
| GO:00160427 | Esophagus | ESCC | lipid catabolic process | 168/8552 | 320/18723 | 7.97e-03 | 2.84e-02 | 168 |
| Page: 1 |
| Pathway ID | Tissue | Disease Stage | Description | Gene Ratio | Bg Ratio | pvalue | p.adjust | qvalue | Count |
| Page: 1 |
Top |
Cell-cell communication analysis |
| Identification of potential cell-cell interactions between two cell types and their ligand-receptor pairs for different disease states |
| Ligand | Receptor | LRpair | Pathway | Tissue | Disease Stage |
| Page: 1 |
Top |
Single-cell gene regulatory network inference analysis |
| Find out the significant the regulons (TFs) and the target genes of each regulon across cell types for different disease states |
| TF | Cell Type | Tissue | Disease Stage | Target Gene | RSS | Regulon Activity |
| ∗The dot plots of a searched regulon are shown for all cell subpopulations in each disease state of each tissue based on the regulon specific score inferred using pySCENIC and by calculating the average expression. |
| Page: 1 |
Top |
Somatic mutation of malignant transformation related genes |
| Annotation of somatic variants for genes involved in malignant transformation |
| Hugo Symbol | Variant Class | Variant Classification | dbSNP RS | HGVSc | HGVSp | HGVSp Short | SWISSPROT | BIOTYPE | SIFT | PolyPhen | Tumor Sample Barcode | Tissue | Histology | Sex | Age | Stage | Therapy Types | Drugs | Outcome |
| CYP2W1 | SNV | Missense_Mutation | c.601N>G | p.Leu201Val | p.L201V | Q8TAV3 | protein_coding | deleterious(0.02) | possibly_damaging(0.893) | TCGA-BH-A0WA-01 | Breast | breast invasive carcinoma | Female | >=65 | I/II | Unknown | Unknown | SD | |
| CYP2W1 | SNV | Missense_Mutation | c.676C>A | p.Leu226Met | p.L226M | Q8TAV3 | protein_coding | deleterious(0.03) | possibly_damaging(0.803) | TCGA-AA-3947-01 | Colorectum | colon adenocarcinoma | Female | <65 | I/II | Unknown | Unknown | SD | |
| CYP2W1 | SNV | Missense_Mutation | c.544N>T | p.Leu182Phe | p.L182F | Q8TAV3 | protein_coding | deleterious(0.04) | probably_damaging(0.979) | TCGA-AA-A01P-01 | Colorectum | colon adenocarcinoma | Female | >=65 | III/IV | Unknown | Unknown | PD | |
| CYP2W1 | SNV | Missense_Mutation | c.5N>A | p.Ala2Asp | p.A2D | Q8TAV3 | protein_coding | deleterious_low_confidence(0.02) | benign(0.108) | TCGA-AD-5900-01 | Colorectum | colon adenocarcinoma | Male | >=65 | I/II | Unknown | Unknown | SD | |
| CYP2W1 | SNV | Missense_Mutation | c.194C>T | p.Pro65Leu | p.P65L | Q8TAV3 | protein_coding | deleterious(0) | possibly_damaging(0.783) | TCGA-CM-4752-01 | Colorectum | colon adenocarcinoma | Male | <65 | I/II | Unknown | Unknown | SD | |
| CYP2W1 | SNV | Missense_Mutation | novel | c.184N>T | p.Arg62Cys | p.R62C | Q8TAV3 | protein_coding | deleterious(0.02) | possibly_damaging(0.806) | TCGA-EI-6507-01 | Colorectum | rectum adenocarcinoma | Male | <65 | I/II | Unknown | Unknown | SD |
| CYP2W1 | SNV | Missense_Mutation | novel | c.632N>T | p.Ser211Phe | p.S211F | Q8TAV3 | protein_coding | deleterious(0.03) | probably_damaging(0.948) | TCGA-EI-6917-01 | Colorectum | rectum adenocarcinoma | Male | <65 | III/IV | Chemotherapy | 5fluorouracil+oxaciplatina+l-folinian | SD |
| CYP2W1 | SNV | Missense_Mutation | c.560G>A | p.Arg187Gln | p.R187Q | Q8TAV3 | protein_coding | deleterious(0) | probably_damaging(0.999) | TCGA-F5-6814-01 | Colorectum | rectum adenocarcinoma | Male | <65 | I/II | Unknown | Unknown | SD | |
| CYP2W1 | SNV | Missense_Mutation | rs551358645 | c.763N>A | p.Val255Met | p.V255M | Q8TAV3 | protein_coding | tolerated(0.08) | benign(0.001) | TCGA-AJ-A3OK-01 | Endometrium | uterine corpus endometrioid carcinoma | Female | >=65 | I/II | Chemotherapy | carboplatin | CR |
| CYP2W1 | SNV | Missense_Mutation | rs535558848 | c.205N>A | p.Val69Met | p.V69M | Q8TAV3 | protein_coding | deleterious(0) | probably_damaging(0.975) | TCGA-AJ-A3OL-01 | Endometrium | uterine corpus endometrioid carcinoma | Female | <65 | III/IV | Chemotherapy | carboplatin | PD |
| Page: 1 2 3 4 5 |
Top |
Related drugs of malignant transformation related genes |
| Identification of chemicals and drugs interact with genes involved in malignant transfromation |
| (DGIdb 4.0) |
| Entrez ID | Symbol | Category | Interaction Types | Drug Claim Name | Drug Name | PMIDs |
| Page: 1 |

Copyright 2023-Present -The University of Texas Health Science Center at Houston |