
|
|||||
|
 | |
| |
| |
| |
| |
| |
|
Gene: CYP2S1 |
Gene summary for CYP2S1 |
| Gene information | Species | Human | Gene symbol | CYP2S1 | Gene ID | 29785 |
| Gene name | cytochrome P450 family 2 subfamily S member 1 | |
| Gene Alias | CYPIIS1 | |
| Cytomap | 19q13.2 | |
| Gene Type | protein-coding | GO ID | GO:0001523 | UniProtAcc | Q96SQ9 |
Top |
Malignant transformation analysis |
| Identification of the aberrant gene expression in precancerous and cancerous lesions by comparing the gene expression of stem-like cells in diseased tissues with normal stem cells |
| Entrez ID | Symbol | Replicates | Species | Organ | Tissue | Adj P-value | Log2FC | Malignancy |
| 29785 | CYP2S1 | LZE4T | Human | Esophagus | ESCC | 2.05e-18 | 7.52e-01 | 0.0811 |
| 29785 | CYP2S1 | LZE7T | Human | Esophagus | ESCC | 2.53e-10 | 5.75e-01 | 0.0667 |
| 29785 | CYP2S1 | LZE8T | Human | Esophagus | ESCC | 8.11e-14 | 5.42e-01 | 0.067 |
| 29785 | CYP2S1 | LZE22D1 | Human | Esophagus | HGIN | 2.35e-02 | 3.09e-01 | 0.0595 |
| 29785 | CYP2S1 | LZE22T | Human | Esophagus | ESCC | 6.66e-10 | 4.30e-01 | 0.068 |
| 29785 | CYP2S1 | LZE24T | Human | Esophagus | ESCC | 3.41e-19 | 7.26e-01 | 0.0596 |
| 29785 | CYP2S1 | LZE22D3 | Human | Esophagus | HGIN | 3.43e-02 | 8.08e-01 | 0.0653 |
| 29785 | CYP2S1 | LZE21T | Human | Esophagus | ESCC | 1.86e-09 | 8.15e-01 | 0.0655 |
| 29785 | CYP2S1 | P1T-E | Human | Esophagus | ESCC | 4.94e-07 | 5.43e-01 | 0.0875 |
| 29785 | CYP2S1 | P2T-E | Human | Esophagus | ESCC | 2.29e-10 | 9.34e-02 | 0.1177 |
| 29785 | CYP2S1 | P4T-E | Human | Esophagus | ESCC | 1.86e-34 | 9.19e-01 | 0.1323 |
| 29785 | CYP2S1 | P5T-E | Human | Esophagus | ESCC | 1.24e-57 | 1.29e+00 | 0.1327 |
| 29785 | CYP2S1 | P8T-E | Human | Esophagus | ESCC | 5.15e-44 | 1.07e+00 | 0.0889 |
| 29785 | CYP2S1 | P9T-E | Human | Esophagus | ESCC | 1.07e-21 | 6.18e-01 | 0.1131 |
| 29785 | CYP2S1 | P10T-E | Human | Esophagus | ESCC | 1.41e-21 | 4.37e-01 | 0.116 |
| 29785 | CYP2S1 | P11T-E | Human | Esophagus | ESCC | 1.01e-14 | 1.16e+00 | 0.1426 |
| 29785 | CYP2S1 | P12T-E | Human | Esophagus | ESCC | 5.78e-83 | 1.77e+00 | 0.1122 |
| 29785 | CYP2S1 | P15T-E | Human | Esophagus | ESCC | 5.11e-53 | 1.41e+00 | 0.1149 |
| 29785 | CYP2S1 | P17T-E | Human | Esophagus | ESCC | 1.25e-03 | 2.88e-01 | 0.1278 |
| 29785 | CYP2S1 | P20T-E | Human | Esophagus | ESCC | 1.51e-10 | 5.05e-01 | 0.1124 |
| Page: 1 2 3 4 |
| Tissue | Expression Dynamics | Abbreviation |
| Esophagus | 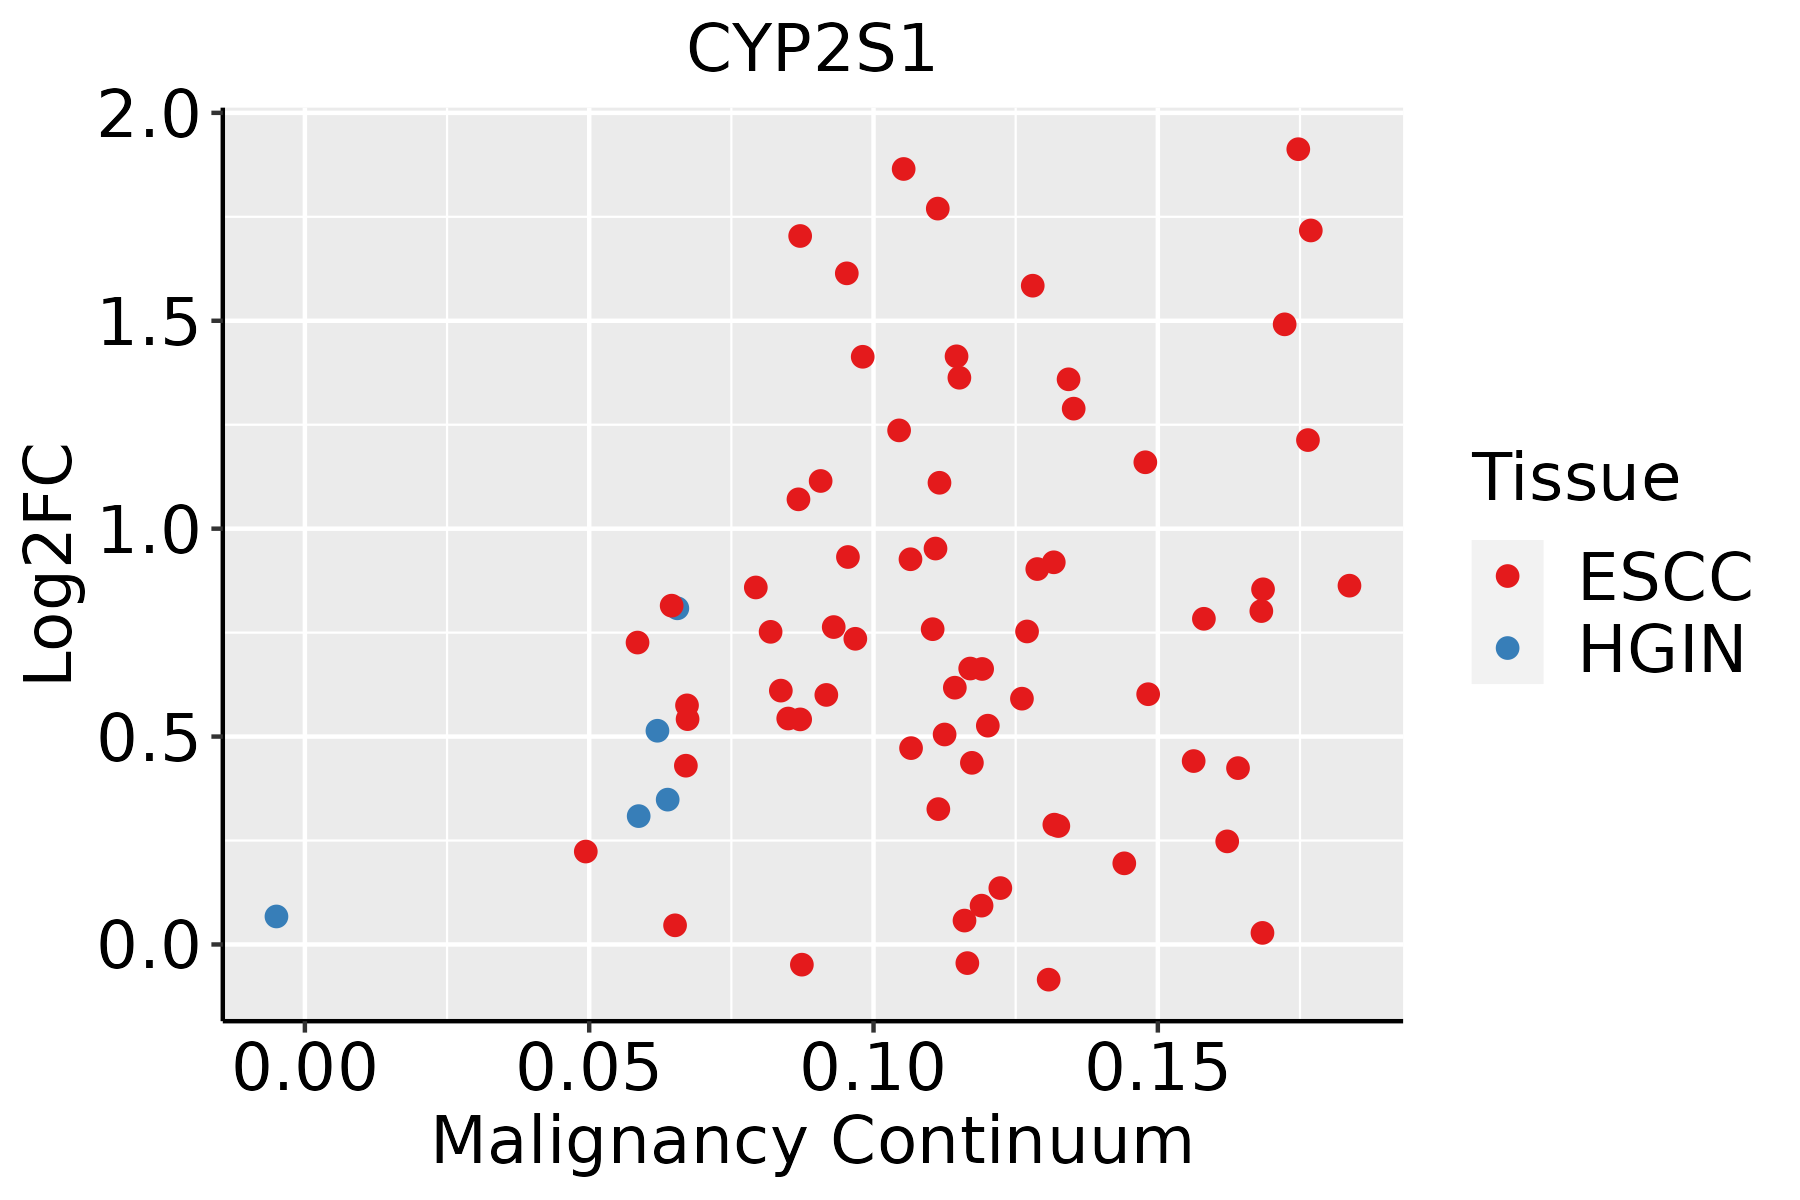 | ESCC: Esophageal squamous cell carcinoma |
| HGIN: High-grade intraepithelial neoplasias | ||
| LGIN: Low-grade intraepithelial neoplasias | ||
| Oral Cavity |  | EOLP: Erosive Oral lichen planus |
| LP: leukoplakia | ||
| NEOLP: Non-erosive oral lichen planus | ||
| OSCC: Oral squamous cell carcinoma |
| ∗log2FC in expression of this searched gene in stem-like cells from each diseased tissue sample relative to stem-like cells in normal samples in each tissue plotted against the malignancy continuum. Samples are colored based on if they are from different disease stage. |
Top |
Malignant transformation related pathway analysis |
| Find out the enriched GO biological processes and KEGG pathways involved in transition from healthy to precancer to cancer |
| Tissue | Disease Stage | Enriched GO biological Processes |
| Colorectum | AD |  |
| Colorectum | SER |  |
| Colorectum | MSS |  |
| Colorectum | MSI-H |  |
| Colorectum | FAP |  |
| ∗Top 15 enriched GO BP terms are showed in the bar plot of each disease state in each tissue. Each row represents a significant GO biological process which is colored according to the -log10(p.adjust). |
| Page: 1 2 3 4 5 6 7 8 9 |
| GO ID | Tissue | Disease Stage | Description | Gene Ratio | Bg Ratio | pvalue | p.adjust | Count |
| GO:00066929 | Esophagus | HGIN | prostanoid metabolic process | 17/2587 | 49/18723 | 1.84e-04 | 3.48e-03 | 17 |
| GO:00066939 | Esophagus | HGIN | prostaglandin metabolic process | 17/2587 | 49/18723 | 1.84e-04 | 3.48e-03 | 17 |
| GO:00066318 | Esophagus | ESCC | fatty acid metabolic process | 217/8552 | 390/18723 | 4.21e-05 | 3.39e-04 | 217 |
| GO:000941020 | Esophagus | ESCC | response to xenobiotic stimulus | 253/8552 | 462/18723 | 4.55e-05 | 3.58e-04 | 253 |
| GO:000669211 | Esophagus | ESCC | prostanoid metabolic process | 33/8552 | 49/18723 | 1.80e-03 | 8.26e-03 | 33 |
| GO:000669311 | Esophagus | ESCC | prostaglandin metabolic process | 33/8552 | 49/18723 | 1.80e-03 | 8.26e-03 | 33 |
| GO:000941018 | Oral cavity | OSCC | response to xenobiotic stimulus | 222/7305 | 462/18723 | 4.00e-05 | 3.48e-04 | 222 |
| GO:00066317 | Oral cavity | OSCC | fatty acid metabolic process | 186/7305 | 390/18723 | 2.65e-04 | 1.69e-03 | 186 |
| GO:00066928 | Oral cavity | OSCC | prostanoid metabolic process | 29/7305 | 49/18723 | 3.33e-03 | 1.42e-02 | 29 |
| GO:00066938 | Oral cavity | OSCC | prostaglandin metabolic process | 29/7305 | 49/18723 | 3.33e-03 | 1.42e-02 | 29 |
| GO:00067203 | Oral cavity | OSCC | isoprenoid metabolic process | 59/7305 | 116/18723 | 6.18e-03 | 2.33e-02 | 59 |
| GO:000941019 | Oral cavity | LP | response to xenobiotic stimulus | 141/4623 | 462/18723 | 2.33e-03 | 1.68e-02 | 141 |
| Page: 1 |
| Pathway ID | Tissue | Disease Stage | Description | Gene Ratio | Bg Ratio | pvalue | p.adjust | qvalue | Count |
| Page: 1 |
Top |
Cell-cell communication analysis |
| Identification of potential cell-cell interactions between two cell types and their ligand-receptor pairs for different disease states |
| Ligand | Receptor | LRpair | Pathway | Tissue | Disease Stage |
| Page: 1 |
Top |
Single-cell gene regulatory network inference analysis |
| Find out the significant the regulons (TFs) and the target genes of each regulon across cell types for different disease states |
| TF | Cell Type | Tissue | Disease Stage | Target Gene | RSS | Regulon Activity |
| ∗The dot plots of a searched regulon are shown for all cell subpopulations in each disease state of each tissue based on the regulon specific score inferred using pySCENIC and by calculating the average expression. |
| Page: 1 |
Top |
Somatic mutation of malignant transformation related genes |
| Annotation of somatic variants for genes involved in malignant transformation |
| Hugo Symbol | Variant Class | Variant Classification | dbSNP RS | HGVSc | HGVSp | HGVSp Short | SWISSPROT | BIOTYPE | SIFT | PolyPhen | Tumor Sample Barcode | Tissue | Histology | Sex | Age | Stage | Therapy Types | Drugs | Outcome |
| CYP2S1 | SNV | Missense_Mutation | c.490G>A | p.Glu164Lys | p.E164K | Q96SQ9 | protein_coding | tolerated(1) | benign(0) | TCGA-BH-A0AW-01 | Breast | breast invasive carcinoma | Female | <65 | I/II | Chemotherapy | carboplatin | SD | |
| CYP2S1 | SNV | Missense_Mutation | rs762153062 | c.917N>T | p.Thr306Met | p.T306M | Q96SQ9 | protein_coding | deleterious(0.01) | probably_damaging(0.995) | TCGA-BH-A18U-01 | Breast | breast invasive carcinoma | Female | >=65 | III/IV | Unknown | Unknown | SD |
| CYP2S1 | SNV | Missense_Mutation | c.1224N>A | p.His408Gln | p.H408Q | Q96SQ9 | protein_coding | tolerated(0.43) | benign(0) | TCGA-C8-A1HI-01 | Breast | breast invasive carcinoma | Female | <65 | III/IV | Unknown | Unknown | SD | |
| CYP2S1 | SNV | Missense_Mutation | c.874N>G | p.Met292Val | p.M292V | Q96SQ9 | protein_coding | deleterious(0) | benign(0.011) | TCGA-D8-A1XK-01 | Breast | breast invasive carcinoma | Female | <65 | I/II | Chemotherapy | doxorubicine+cyclophosphamide | SD | |
| CYP2S1 | insertion | Nonsense_Mutation | novel | c.593_594insGCCTGAAGGGGATGAAACTGGAGGCTAGGAGC | p.Phe198LeufsTer10 | p.F198Lfs*10 | Q96SQ9 | protein_coding | TCGA-A8-A0A4-01 | Breast | breast invasive carcinoma | Female | >=65 | I/II | Hormone Therapy | tamoxiphen | CR | ||
| CYP2S1 | deletion | Frame_Shift_Del | novel | c.926delN | p.Thr310ArgfsTer9 | p.T310Rfs*9 | Q96SQ9 | protein_coding | TCGA-EW-A2FV-01 | Breast | breast invasive carcinoma | Female | <65 | III/IV | Chemotherapy | docetaxel | SD | ||
| CYP2S1 | SNV | Missense_Mutation | c.1027A>C | p.Ser343Arg | p.S343R | Q96SQ9 | protein_coding | tolerated(0.32) | benign(0.021) | TCGA-AA-A010-01 | Colorectum | colon adenocarcinoma | Female | <65 | I/II | Chemotherapy | folinic | CR | |
| CYP2S1 | SNV | Missense_Mutation | rs755173146 | c.1129C>T | p.Arg377Trp | p.R377W | Q96SQ9 | protein_coding | deleterious(0) | possibly_damaging(0.877) | TCGA-AA-A01P-01 | Colorectum | colon adenocarcinoma | Female | >=65 | III/IV | Unknown | Unknown | PD |
| CYP2S1 | SNV | Missense_Mutation | c.1112N>A | p.Ile371Lys | p.I371K | Q96SQ9 | protein_coding | deleterious(0) | benign(0.309) | TCGA-D5-6529-01 | Colorectum | colon adenocarcinoma | Male | >=65 | I/II | Chemotherapy | oxaliplatinum+ | SD | |
| CYP2S1 | SNV | Missense_Mutation | rs202034225 | c.314N>T | p.Ala105Val | p.A105V | Q96SQ9 | protein_coding | deleterious(0.03) | possibly_damaging(0.767) | TCGA-F4-6703-01 | Colorectum | colon adenocarcinoma | Male | <65 | I/II | Unknown | Unknown | SD |
| Page: 1 2 3 4 5 |
Top |
Related drugs of malignant transformation related genes |
| Identification of chemicals and drugs interact with genes involved in malignant transfromation |
| (DGIdb 4.0) |
| Entrez ID | Symbol | Category | Interaction Types | Drug Claim Name | Drug Name | PMIDs |
| Page: 1 |

Copyright 2023-Present -The University of Texas Health Science Center at Houston |