
|
|||||
|
 | |
| |
| |
| |
| |
| |
|
Gene: CYP2E1 |
Gene summary for CYP2E1 |
| Gene information | Species | Human | Gene symbol | CYP2E1 | Gene ID | 1571 |
| Gene name | cytochrome P450 family 2 subfamily E member 1 | |
| Gene Alias | CPE1 | |
| Cytomap | 10q26.3 | |
| Gene Type | protein-coding | GO ID | GO:0000302 | UniProtAcc | P05181 |
Top |
Malignant transformation analysis |
| Identification of the aberrant gene expression in precancerous and cancerous lesions by comparing the gene expression of stem-like cells in diseased tissues with normal stem cells |
| Entrez ID | Symbol | Replicates | Species | Organ | Tissue | Adj P-value | Log2FC | Malignancy |
| 1571 | CYP2E1 | S44 | Human | Liver | HCC | 1.78e-24 | 1.78e+00 | -0.0083 |
| 1571 | CYP2E1 | HCC1_Meng | Human | Liver | HCC | 1.41e-15 | -5.80e-01 | 0.0246 |
| 1571 | CYP2E1 | HCC2_Meng | Human | Liver | HCC | 2.31e-12 | -5.69e-01 | 0.0107 |
| 1571 | CYP2E1 | cirrhotic1 | Human | Liver | Cirrhotic | 2.42e-12 | -5.70e-01 | 0.0202 |
| 1571 | CYP2E1 | cirrhotic2 | Human | Liver | Cirrhotic | 5.43e-10 | -4.66e-01 | 0.0201 |
| 1571 | CYP2E1 | cirrhotic3 | Human | Liver | Cirrhotic | 5.55e-10 | -5.75e-01 | 0.0215 |
| 1571 | CYP2E1 | HCC1 | Human | Liver | HCC | 3.32e-31 | 4.64e+00 | 0.5336 |
| 1571 | CYP2E1 | Pt13.a | Human | Liver | HCC | 2.76e-34 | 3.09e-01 | 0.021 |
| 1571 | CYP2E1 | Pt13.b | Human | Liver | HCC | 1.07e-46 | 1.07e-01 | 0.0251 |
| 1571 | CYP2E1 | Pt14.a | Human | Liver | HCC | 1.42e-07 | 2.88e-01 | 0.0169 |
| 1571 | CYP2E1 | Pt14.d | Human | Liver | HCC | 2.53e-10 | -5.44e-01 | 0.0143 |
| 1571 | CYP2E1 | S028 | Human | Liver | HCC | 5.76e-03 | -5.43e-01 | 0.2503 |
| Page: 1 |
| Tissue | Expression Dynamics | Abbreviation |
| Liver | 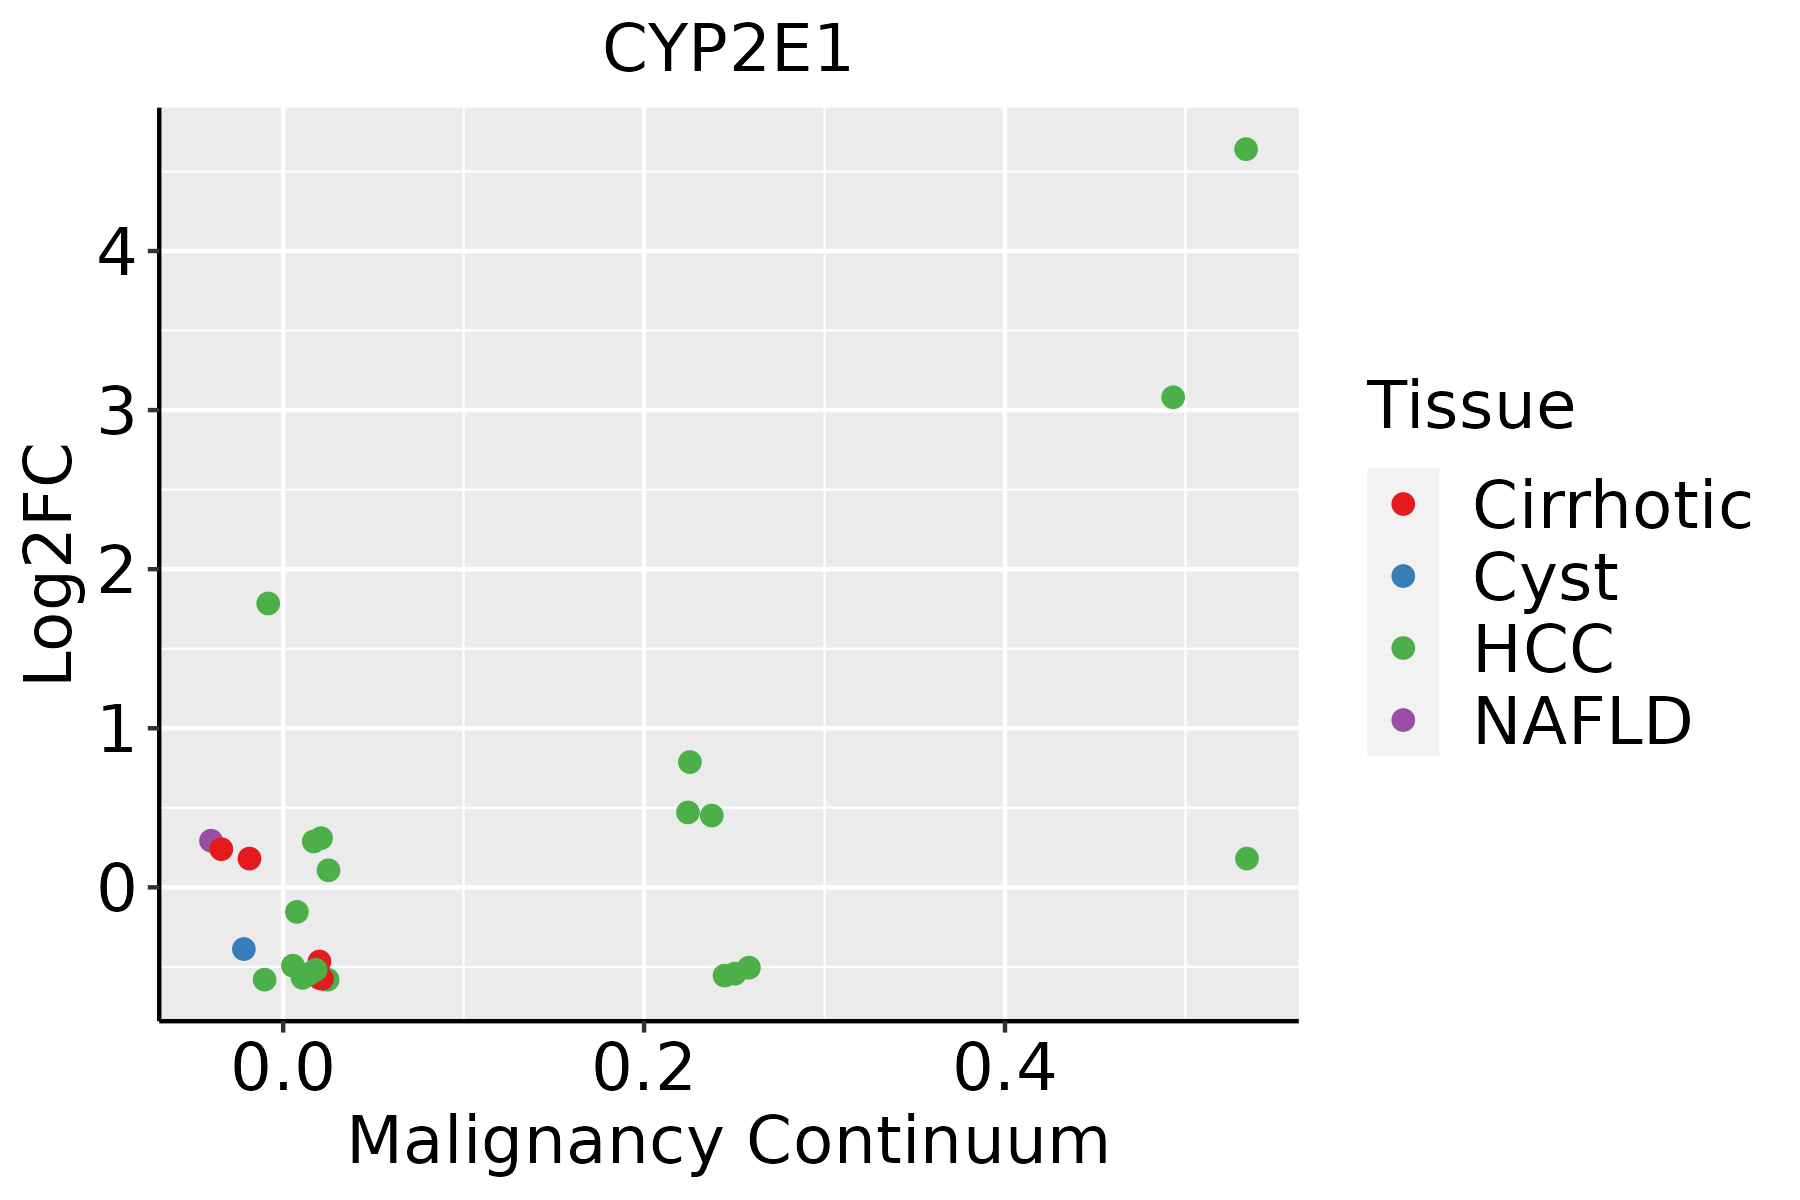 | HCC: Hepatocellular carcinoma |
| NAFLD: Non-alcoholic fatty liver disease |
| ∗log2FC in expression of this searched gene in stem-like cells from each diseased tissue sample relative to stem-like cells in normal samples in each tissue plotted against the malignancy continuum. Samples are colored based on if they are from different disease stage. |
Top |
Malignant transformation related pathway analysis |
| Find out the enriched GO biological processes and KEGG pathways involved in transition from healthy to precancer to cancer |
| Tissue | Disease Stage | Enriched GO biological Processes |
| Colorectum | AD |  |
| Colorectum | SER |  |
| Colorectum | MSS |  |
| Colorectum | MSI-H |  |
| Colorectum | FAP |  |
| ∗Top 15 enriched GO BP terms are showed in the bar plot of each disease state in each tissue. Each row represents a significant GO biological process which is colored according to the -log10(p.adjust). |
| Page: 1 2 3 4 5 6 7 8 9 |
| GO ID | Tissue | Disease Stage | Description | Gene Ratio | Bg Ratio | pvalue | p.adjust | Count |
| GO:000697912 | Liver | Cirrhotic | response to oxidative stress | 196/4634 | 446/18723 | 2.80e-19 | 5.86e-17 | 196 |
| GO:000820211 | Liver | Cirrhotic | steroid metabolic process | 143/4634 | 319/18723 | 2.79e-15 | 3.18e-13 | 143 |
| GO:000663112 | Liver | Cirrhotic | fatty acid metabolic process | 165/4634 | 390/18723 | 1.29e-14 | 1.26e-12 | 165 |
| GO:001605312 | Liver | Cirrhotic | organic acid biosynthetic process | 139/4634 | 316/18723 | 4.28e-14 | 3.83e-12 | 139 |
| GO:004639412 | Liver | Cirrhotic | carboxylic acid biosynthetic process | 137/4634 | 314/18723 | 1.40e-13 | 1.14e-11 | 137 |
| GO:000030212 | Liver | Cirrhotic | response to reactive oxygen species | 100/4634 | 222/18723 | 2.92e-11 | 1.73e-09 | 100 |
| GO:007233011 | Liver | Cirrhotic | monocarboxylic acid biosynthetic process | 93/4634 | 214/18723 | 1.43e-09 | 6.16e-08 | 93 |
| GO:000941012 | Liver | Cirrhotic | response to xenobiotic stimulus | 165/4634 | 462/18723 | 6.82e-08 | 2.09e-06 | 165 |
| GO:000663311 | Liver | Cirrhotic | fatty acid biosynthetic process | 70/4634 | 163/18723 | 2.57e-07 | 6.41e-06 | 70 |
| GO:009730512 | Liver | Cirrhotic | response to alcohol | 96/4634 | 253/18723 | 1.97e-06 | 3.65e-05 | 96 |
| GO:00714661 | Liver | Cirrhotic | cellular response to xenobiotic stimulus | 66/4634 | 177/18723 | 1.34e-04 | 1.31e-03 | 66 |
| GO:00067202 | Liver | Cirrhotic | isoprenoid metabolic process | 46/4634 | 116/18723 | 2.71e-04 | 2.41e-03 | 46 |
| GO:003025811 | Liver | Cirrhotic | lipid modification | 75/4634 | 212/18723 | 3.33e-04 | 2.87e-03 | 75 |
| GO:000664111 | Liver | Cirrhotic | triglyceride metabolic process | 40/4634 | 100/18723 | 5.36e-04 | 4.23e-03 | 40 |
| GO:000680511 | Liver | Cirrhotic | xenobiotic metabolic process | 43/4634 | 111/18723 | 7.51e-04 | 5.54e-03 | 43 |
| GO:00067212 | Liver | Cirrhotic | terpenoid metabolic process | 38/4634 | 97/18723 | 1.16e-03 | 7.89e-03 | 38 |
| GO:003355911 | Liver | Cirrhotic | unsaturated fatty acid metabolic process | 43/4634 | 116/18723 | 2.09e-03 | 1.29e-02 | 43 |
| GO:0042178 | Liver | Cirrhotic | xenobiotic catabolic process | 17/4634 | 37/18723 | 4.02e-03 | 2.17e-02 | 17 |
| GO:00454711 | Liver | Cirrhotic | response to ethanol | 48/4634 | 137/18723 | 4.45e-03 | 2.35e-02 | 48 |
| GO:000167611 | Liver | Cirrhotic | long-chain fatty acid metabolic process | 40/4634 | 112/18723 | 6.16e-03 | 3.06e-02 | 40 |
| Page: 1 2 |
| Pathway ID | Tissue | Disease Stage | Description | Gene Ratio | Bg Ratio | pvalue | p.adjust | qvalue | Count |
| hsa0493222 | Liver | Cirrhotic | Non-alcoholic fatty liver disease | 106/2530 | 155/8465 | 2.16e-23 | 2.40e-21 | 1.48e-21 | 106 |
| hsa0520822 | Liver | Cirrhotic | Chemical carcinogenesis - reactive oxygen species | 121/2530 | 223/8465 | 1.35e-14 | 4.08e-13 | 2.52e-13 | 121 |
| hsa04936 | Liver | Cirrhotic | Alcoholic liver disease | 60/2530 | 142/8465 | 1.07e-03 | 5.85e-03 | 3.61e-03 | 60 |
| hsa00983 | Liver | Cirrhotic | Drug metabolism - other enzymes | 34/2530 | 80/8465 | 1.08e-02 | 3.57e-02 | 2.20e-02 | 34 |
| hsa0493232 | Liver | Cirrhotic | Non-alcoholic fatty liver disease | 106/2530 | 155/8465 | 2.16e-23 | 2.40e-21 | 1.48e-21 | 106 |
| hsa0520832 | Liver | Cirrhotic | Chemical carcinogenesis - reactive oxygen species | 121/2530 | 223/8465 | 1.35e-14 | 4.08e-13 | 2.52e-13 | 121 |
| hsa049361 | Liver | Cirrhotic | Alcoholic liver disease | 60/2530 | 142/8465 | 1.07e-03 | 5.85e-03 | 3.61e-03 | 60 |
| hsa009831 | Liver | Cirrhotic | Drug metabolism - other enzymes | 34/2530 | 80/8465 | 1.08e-02 | 3.57e-02 | 2.20e-02 | 34 |
| hsa0520842 | Liver | HCC | Chemical carcinogenesis - reactive oxygen species | 167/4020 | 223/8465 | 2.85e-17 | 1.91e-15 | 1.06e-15 | 167 |
| hsa0493242 | Liver | HCC | Non-alcoholic fatty liver disease | 124/4020 | 155/8465 | 4.54e-17 | 2.54e-15 | 1.41e-15 | 124 |
| hsa049362 | Liver | HCC | Alcoholic liver disease | 89/4020 | 142/8465 | 1.73e-04 | 8.53e-04 | 4.75e-04 | 89 |
| hsa009832 | Liver | HCC | Drug metabolism - other enzymes | 54/4020 | 80/8465 | 2.25e-04 | 1.09e-03 | 6.08e-04 | 54 |
| hsa0520852 | Liver | HCC | Chemical carcinogenesis - reactive oxygen species | 167/4020 | 223/8465 | 2.85e-17 | 1.91e-15 | 1.06e-15 | 167 |
| hsa0493252 | Liver | HCC | Non-alcoholic fatty liver disease | 124/4020 | 155/8465 | 4.54e-17 | 2.54e-15 | 1.41e-15 | 124 |
| hsa049363 | Liver | HCC | Alcoholic liver disease | 89/4020 | 142/8465 | 1.73e-04 | 8.53e-04 | 4.75e-04 | 89 |
| hsa009833 | Liver | HCC | Drug metabolism - other enzymes | 54/4020 | 80/8465 | 2.25e-04 | 1.09e-03 | 6.08e-04 | 54 |
| Page: 1 |
Top |
Cell-cell communication analysis |
| Identification of potential cell-cell interactions between two cell types and their ligand-receptor pairs for different disease states |
| Ligand | Receptor | LRpair | Pathway | Tissue | Disease Stage |
| Page: 1 |
Top |
Single-cell gene regulatory network inference analysis |
| Find out the significant the regulons (TFs) and the target genes of each regulon across cell types for different disease states |
| TF | Cell Type | Tissue | Disease Stage | Target Gene | RSS | Regulon Activity |
| ∗The dot plots of a searched regulon are shown for all cell subpopulations in each disease state of each tissue based on the regulon specific score inferred using pySCENIC and by calculating the average expression. |
| Page: 1 |
Top |
Somatic mutation of malignant transformation related genes |
| Annotation of somatic variants for genes involved in malignant transformation |
| Hugo Symbol | Variant Class | Variant Classification | dbSNP RS | HGVSc | HGVSp | HGVSp Short | SWISSPROT | BIOTYPE | SIFT | PolyPhen | Tumor Sample Barcode | Tissue | Histology | Sex | Age | Stage | Therapy Types | Drugs | Outcome |
| CYP2E1 | SNV | Missense_Mutation | c.94C>G | p.Leu32Val | p.L32V | P05181 | protein_coding | deleterious(0) | probably_damaging(0.991) | TCGA-D8-A1J9-01 | Breast | breast invasive carcinoma | Female | <65 | I/II | Unknown | Unknown | SD | |
| CYP2E1 | SNV | Missense_Mutation | c.861N>A | p.Asp287Glu | p.D287E | P05181 | protein_coding | tolerated(1) | benign(0) | TCGA-OL-A5RW-01 | Breast | breast invasive carcinoma | Female | <65 | I/II | Chemotherapy | adriamycin | CR | |
| CYP2E1 | SNV | Missense_Mutation | novel | c.1093C>T | p.Pro365Ser | p.P365S | P05181 | protein_coding | deleterious(0.03) | possibly_damaging(0.774) | TCGA-2W-A8YY-01 | Cervix | cervical & endocervical cancer | Female | <65 | I/II | Chemotherapy | cisplatin | CR |
| CYP2E1 | SNV | Missense_Mutation | c.1387N>G | p.Leu463Val | p.L463V | P05181 | protein_coding | tolerated(0.4) | probably_damaging(0.985) | TCGA-IR-A3LH-01 | Cervix | cervical & endocervical cancer | Female | <65 | I/II | Chemotherapy | cisplatin | CR | |
| CYP2E1 | SNV | Missense_Mutation | novel | c.1080C>A | p.Phe360Leu | p.F360L | P05181 | protein_coding | tolerated(0.09) | benign(0.117) | TCGA-VS-A9V2-01 | Cervix | cervical & endocervical cancer | Female | <65 | I/II | Unknown | Unknown | SD |
| CYP2E1 | SNV | Missense_Mutation | c.1345N>A | p.Leu449Ile | p.L449I | P05181 | protein_coding | tolerated(0.1) | probably_damaging(0.949) | TCGA-A6-6141-01 | Colorectum | colon adenocarcinoma | Male | <65 | I/II | Chemotherapy | 5-fu | SD | |
| CYP2E1 | SNV | Missense_Mutation | c.469N>A | p.Ala157Thr | p.A157T | P05181 | protein_coding | deleterious(0.03) | benign(0.198) | TCGA-AA-3510-01 | Colorectum | colon adenocarcinoma | Male | >=65 | I/II | Unknown | Unknown | SD | |
| CYP2E1 | SNV | Missense_Mutation | rs199954662 | c.1408N>A | p.Asp470Asn | p.D470N | P05181 | protein_coding | tolerated(0.09) | probably_damaging(0.998) | TCGA-AA-3510-01 | Colorectum | colon adenocarcinoma | Male | >=65 | I/II | Unknown | Unknown | SD |
| CYP2E1 | SNV | Missense_Mutation | rs563043306 | c.41N>T | p.Ala14Val | p.A14V | P05181 | protein_coding | tolerated(1) | benign(0) | TCGA-AA-3715-01 | Colorectum | colon adenocarcinoma | Male | >=65 | I/II | Unknown | Unknown | PD |
| CYP2E1 | SNV | Missense_Mutation | rs199954662 | c.1408N>A | p.Asp470Asn | p.D470N | P05181 | protein_coding | tolerated(0.09) | probably_damaging(0.998) | TCGA-AA-A00N-01 | Colorectum | colon adenocarcinoma | Male | >=65 | I/II | Unknown | Unknown | PD |
| Page: 1 2 3 4 5 6 7 |
Top |
Related drugs of malignant transformation related genes |
| Identification of chemicals and drugs interact with genes involved in malignant transfromation |
| (DGIdb 4.0) |
| Entrez ID | Symbol | Category | Interaction Types | Drug Claim Name | Drug Name | PMIDs |
| 1571 | CYP2E1 | ENZYME, DRUGGABLE GENOME, CYTOCHROME P450 | ISOFLAVONE | ISOFLAVONE | 15056880 | |
| 1571 | CYP2E1 | ENZYME, DRUGGABLE GENOME, CYTOCHROME P450 | ethanol | ALCOHOL | 29588096,26049587,15902904,25514903 | |
| 1571 | CYP2E1 | ENZYME, DRUGGABLE GENOME, CYTOCHROME P450 | CIPROFLOXACIN | CIPROFLOXACIN | 15194011 | |
| 1571 | CYP2E1 | ENZYME, DRUGGABLE GENOME, CYTOCHROME P450 | theophylline | THEOPHYLLINE | ||
| 1571 | CYP2E1 | ENZYME, DRUGGABLE GENOME, CYTOCHROME P450 | inhibitor | 252827414 | ||
| 1571 | CYP2E1 | ENZYME, DRUGGABLE GENOME, CYTOCHROME P450 | PERFLUOROOCTYLBROMIDE | PERFLUBRON | 8399771 | |
| 1571 | CYP2E1 | ENZYME, DRUGGABLE GENOME, CYTOCHROME P450 | acetaminophen | ACETAMINOPHEN | 19219744,23462933,8659683,26049587,18695978,11866476,9548799 | |
| 1571 | CYP2E1 | ENZYME, DRUGGABLE GENOME, CYTOCHROME P450 | gemtuzumab ozogamicin | 22584460 | ||
| 1571 | CYP2E1 | ENZYME, DRUGGABLE GENOME, CYTOCHROME P450 | zidovudine | ZIDOVUDINE | 22960662 | |
| 1571 | CYP2E1 | ENZYME, DRUGGABLE GENOME, CYTOCHROME P450 | COBALT | 8577819 |
| Page: 1 2 3 4 |

Copyright 2023-Present -The University of Texas Health Science Center at Houston |