
|
|||||
|
 | |
| |
| |
| |
| |
| |
|
Gene: CYP2C8 |
Gene summary for CYP2C8 |
| Gene information | Species | Human | Gene symbol | CYP2C8 | Gene ID | 1558 |
| Gene name | cytochrome P450 family 2 subfamily C member 8 | |
| Gene Alias | CPC8 | |
| Cytomap | 10q23.33 | |
| Gene Type | protein-coding | GO ID | GO:0001523 | UniProtAcc | P10632 |
Top |
Malignant transformation analysis |
| Identification of the aberrant gene expression in precancerous and cancerous lesions by comparing the gene expression of stem-like cells in diseased tissues with normal stem cells |
| Entrez ID | Symbol | Replicates | Species | Organ | Tissue | Adj P-value | Log2FC | Malignancy |
| 1558 | CYP2C8 | NAFLD1 | Human | Liver | NAFLD | 1.08e-13 | 1.53e+00 | -0.04 |
| 1558 | CYP2C8 | S41 | Human | Liver | Cirrhotic | 3.90e-02 | 5.65e-01 | -0.0343 |
| 1558 | CYP2C8 | S43 | Human | Liver | Cirrhotic | 3.75e-04 | -3.38e-01 | -0.0187 |
| 1558 | CYP2C8 | HCC1_Meng | Human | Liver | HCC | 6.97e-22 | -5.84e-01 | 0.0246 |
| 1558 | CYP2C8 | HCC2_Meng | Human | Liver | HCC | 1.78e-19 | -5.79e-01 | 0.0107 |
| 1558 | CYP2C8 | cirrhotic1 | Human | Liver | Cirrhotic | 2.99e-20 | -4.64e-01 | 0.0202 |
| 1558 | CYP2C8 | cirrhotic2 | Human | Liver | Cirrhotic | 1.13e-30 | -1.74e-01 | 0.0201 |
| 1558 | CYP2C8 | cirrhotic3 | Human | Liver | Cirrhotic | 2.14e-05 | -4.96e-01 | 0.0215 |
| 1558 | CYP2C8 | HCC1 | Human | Liver | HCC | 1.14e-13 | 4.12e+00 | 0.5336 |
| 1558 | CYP2C8 | HCC2 | Human | Liver | HCC | 6.16e-08 | 2.66e+00 | 0.5341 |
| 1558 | CYP2C8 | Pt13.a | Human | Liver | HCC | 6.46e-13 | -5.32e-01 | 0.021 |
| 1558 | CYP2C8 | Pt13.b | Human | Liver | HCC | 4.74e-07 | -5.24e-01 | 0.0251 |
| 1558 | CYP2C8 | Pt14.b | Human | Liver | HCC | 2.21e-10 | -3.15e-02 | 0.018 |
| 1558 | CYP2C8 | Pt14.d | Human | Liver | HCC | 2.75e-24 | -3.25e-01 | 0.0143 |
| 1558 | CYP2C8 | S014 | Human | Liver | HCC | 4.76e-05 | -5.94e-01 | 0.2254 |
| 1558 | CYP2C8 | S015 | Human | Liver | HCC | 6.51e-03 | -5.94e-01 | 0.2375 |
| 1558 | CYP2C8 | S016 | Human | Liver | HCC | 7.22e-07 | -5.94e-01 | 0.2243 |
| Page: 1 |
| Tissue | Expression Dynamics | Abbreviation |
| Liver | 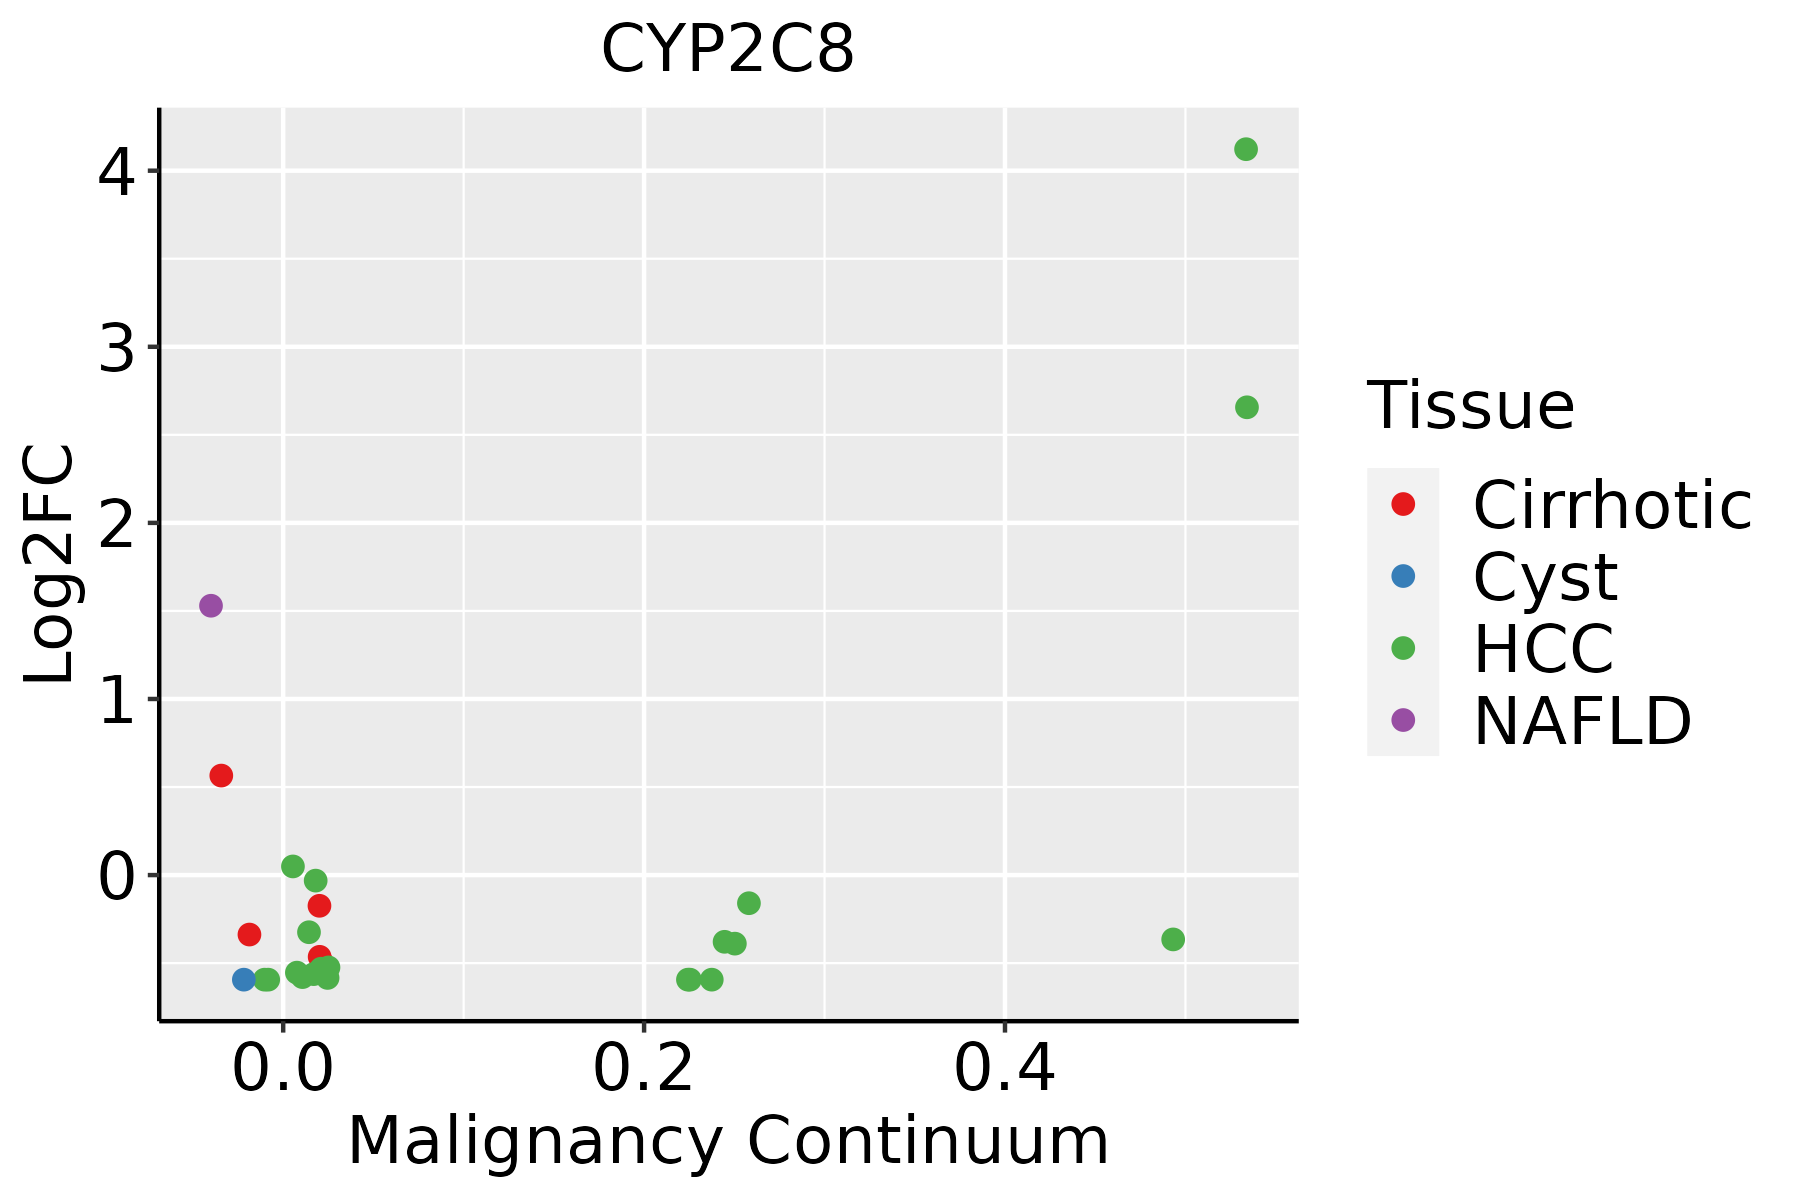 | HCC: Hepatocellular carcinoma |
| NAFLD: Non-alcoholic fatty liver disease |
| ∗log2FC in expression of this searched gene in stem-like cells from each diseased tissue sample relative to stem-like cells in normal samples in each tissue plotted against the malignancy continuum. Samples are colored based on if they are from different disease stage. |
Top |
Malignant transformation related pathway analysis |
| Find out the enriched GO biological processes and KEGG pathways involved in transition from healthy to precancer to cancer |
| Tissue | Disease Stage | Enriched GO biological Processes |
| Colorectum | AD |  |
| Colorectum | SER |  |
| Colorectum | MSS |  |
| Colorectum | MSI-H |  |
| Colorectum | FAP |  |
| ∗Top 15 enriched GO BP terms are showed in the bar plot of each disease state in each tissue. Each row represents a significant GO biological process which is colored according to the -log10(p.adjust). |
| Page: 1 2 3 4 5 6 7 8 9 |
| GO ID | Tissue | Disease Stage | Description | Gene Ratio | Bg Ratio | pvalue | p.adjust | Count |
| GO:00066316 | Liver | NAFLD | fatty acid metabolic process | 92/1882 | 390/18723 | 3.38e-15 | 3.29e-12 | 92 |
| GO:00160535 | Liver | NAFLD | organic acid biosynthetic process | 77/1882 | 316/18723 | 1.03e-13 | 6.69e-11 | 77 |
| GO:00463945 | Liver | NAFLD | carboxylic acid biosynthetic process | 75/1882 | 314/18723 | 6.37e-13 | 3.39e-10 | 75 |
| GO:00082023 | Liver | NAFLD | steroid metabolic process | 69/1882 | 319/18723 | 5.90e-10 | 1.28e-07 | 69 |
| GO:00094107 | Liver | NAFLD | response to xenobiotic stimulus | 88/1882 | 462/18723 | 2.53e-09 | 4.11e-07 | 88 |
| GO:00302585 | Liver | NAFLD | lipid modification | 49/1882 | 212/18723 | 1.97e-08 | 2.17e-06 | 49 |
| GO:00723303 | Liver | NAFLD | monocarboxylic acid biosynthetic process | 46/1882 | 214/18723 | 5.06e-07 | 3.07e-05 | 46 |
| GO:00060666 | Liver | NAFLD | alcohol metabolic process | 62/1882 | 353/18723 | 9.01e-06 | 2.96e-04 | 62 |
| GO:00714663 | Liver | NAFLD | cellular response to xenobiotic stimulus | 33/1882 | 177/18723 | 3.54e-04 | 5.36e-03 | 33 |
| GO:00335596 | Liver | NAFLD | unsaturated fatty acid metabolic process | 24/1882 | 116/18723 | 4.64e-04 | 6.74e-03 | 24 |
| GO:00016763 | Liver | NAFLD | long-chain fatty acid metabolic process | 23/1882 | 112/18723 | 6.73e-04 | 8.66e-03 | 23 |
| GO:01202545 | Liver | NAFLD | olefinic compound metabolic process | 28/1882 | 153/18723 | 1.28e-03 | 1.45e-02 | 28 |
| GO:00068054 | Liver | NAFLD | xenobiotic metabolic process | 22/1882 | 111/18723 | 1.42e-03 | 1.58e-02 | 22 |
| GO:00066334 | Liver | NAFLD | fatty acid biosynthetic process | 29/1882 | 163/18723 | 1.67e-03 | 1.74e-02 | 29 |
| GO:00424452 | Liver | NAFLD | hormone metabolic process | 36/1882 | 218/18723 | 1.98e-03 | 1.98e-02 | 36 |
| GO:0070988 | Liver | NAFLD | demethylation | 16/1882 | 73/18723 | 2.09e-03 | 2.06e-02 | 16 |
| GO:0008210 | Liver | NAFLD | estrogen metabolic process | 10/1882 | 38/18723 | 3.49e-03 | 3.00e-02 | 10 |
| GO:00066906 | Liver | NAFLD | icosanoid metabolic process | 22/1882 | 123/18723 | 5.33e-03 | 4.11e-02 | 22 |
| GO:000820211 | Liver | Cirrhotic | steroid metabolic process | 143/4634 | 319/18723 | 2.79e-15 | 3.18e-13 | 143 |
| GO:000663112 | Liver | Cirrhotic | fatty acid metabolic process | 165/4634 | 390/18723 | 1.29e-14 | 1.26e-12 | 165 |
| Page: 1 2 3 |
| Pathway ID | Tissue | Disease Stage | Description | Gene Ratio | Bg Ratio | pvalue | p.adjust | qvalue | Count |
| hsa0541714 | Liver | NAFLD | Lipid and atherosclerosis | 42/1043 | 215/8465 | 1.46e-03 | 1.71e-02 | 1.38e-02 | 42 |
| hsa0541715 | Liver | NAFLD | Lipid and atherosclerosis | 42/1043 | 215/8465 | 1.46e-03 | 1.71e-02 | 1.38e-02 | 42 |
| hsa0541722 | Liver | Cirrhotic | Lipid and atherosclerosis | 80/2530 | 215/8465 | 1.18e-02 | 3.81e-02 | 2.35e-02 | 80 |
| hsa0541732 | Liver | Cirrhotic | Lipid and atherosclerosis | 80/2530 | 215/8465 | 1.18e-02 | 3.81e-02 | 2.35e-02 | 80 |
| hsa0541742 | Liver | HCC | Lipid and atherosclerosis | 118/4020 | 215/8465 | 1.66e-02 | 3.92e-02 | 2.18e-02 | 118 |
| hsa0541752 | Liver | HCC | Lipid and atherosclerosis | 118/4020 | 215/8465 | 1.66e-02 | 3.92e-02 | 2.18e-02 | 118 |
| Page: 1 |
Top |
Cell-cell communication analysis |
| Identification of potential cell-cell interactions between two cell types and their ligand-receptor pairs for different disease states |
| Ligand | Receptor | LRpair | Pathway | Tissue | Disease Stage |
| Page: 1 |
Top |
Single-cell gene regulatory network inference analysis |
| Find out the significant the regulons (TFs) and the target genes of each regulon across cell types for different disease states |
| TF | Cell Type | Tissue | Disease Stage | Target Gene | RSS | Regulon Activity |
| ∗The dot plots of a searched regulon are shown for all cell subpopulations in each disease state of each tissue based on the regulon specific score inferred using pySCENIC and by calculating the average expression. |
| Page: 1 |
Top |
Somatic mutation of malignant transformation related genes |
| Annotation of somatic variants for genes involved in malignant transformation |
| Hugo Symbol | Variant Class | Variant Classification | dbSNP RS | HGVSc | HGVSp | HGVSp Short | SWISSPROT | BIOTYPE | SIFT | PolyPhen | Tumor Sample Barcode | Tissue | Histology | Sex | Age | Stage | Therapy Types | Drugs | Outcome |
| CYP2C8 | SNV | Missense_Mutation | rs775905230 | c.722N>A | p.Arg241Gln | p.R241Q | P10632 | protein_coding | tolerated(0.06) | benign(0.005) | TCGA-AN-A046-01 | Breast | breast invasive carcinoma | Female | >=65 | I/II | Unknown | Unknown | SD |
| CYP2C8 | SNV | Missense_Mutation | c.1054N>T | p.Val352Leu | p.V352L | P10632 | protein_coding | tolerated(0.29) | benign(0.003) | TCGA-AO-A03V-01 | Breast | breast invasive carcinoma | Female | <65 | I/II | Chemotherapy | fluorouracil | SD | |
| CYP2C8 | SNV | Missense_Mutation | c.106N>T | p.Leu36Phe | p.L36F | P10632 | protein_coding | tolerated(0.14) | benign(0.046) | TCGA-BH-A18V-01 | Breast | breast invasive carcinoma | Female | <65 | I/II | Unknown | Unknown | SD | |
| CYP2C8 | deletion | In_Frame_Del | c.1294_1311delNNNNNNNNNNNNNNNNNN | p.Lys432_Gly437del | p.K432_G437del | P10632 | protein_coding | TCGA-BH-A0C0-01 | Breast | breast invasive carcinoma | Female | <65 | I/II | Chemotherapy | carboplatin | SD | |||
| CYP2C8 | SNV | Missense_Mutation | rs775342549 | c.374N>A | p.Arg125His | p.R125H | P10632 | protein_coding | deleterious(0.04) | benign(0.445) | TCGA-C5-A7UI-01 | Cervix | cervical & endocervical cancer | Female | <65 | I/II | Unknown | Unknown | SD |
| CYP2C8 | SNV | Missense_Mutation | c.473N>T | p.Lys158Ile | p.K158I | P10632 | protein_coding | deleterious(0) | possibly_damaging(0.544) | TCGA-A6-2679-01 | Colorectum | colon adenocarcinoma | Female | >=65 | I/II | Unknown | Unknown | SD | |
| CYP2C8 | SNV | Missense_Mutation | c.209G>A | p.Gly70Asp | p.G70D | P10632 | protein_coding | deleterious(0) | probably_damaging(0.998) | TCGA-AA-3952-01 | Colorectum | colon adenocarcinoma | Male | >=65 | III/IV | Unknown | Unknown | PD | |
| CYP2C8 | SNV | Missense_Mutation | rs748167187 | c.1298N>A | p.Arg433Gln | p.R433Q | P10632 | protein_coding | deleterious(0.01) | probably_damaging(0.996) | TCGA-AA-3984-01 | Colorectum | colon adenocarcinoma | Female | <65 | I/II | Unknown | Unknown | SD |
| CYP2C8 | SNV | Missense_Mutation | rs543793530 | c.557G>A | p.Arg186Gln | p.R186Q | P10632 | protein_coding | deleterious(0.01) | possibly_damaging(0.796) | TCGA-AZ-4315-01 | Colorectum | colon adenocarcinoma | Male | <65 | I/II | Unknown | Unknown | SD |
| CYP2C8 | SNV | Missense_Mutation | rs267602641 | c.1165N>A | p.Ala389Thr | p.A389T | P10632 | protein_coding | tolerated(0.69) | benign(0.001) | TCGA-CA-6717-01 | Colorectum | colon adenocarcinoma | Male | <65 | I/II | Chemotherapy | oxaliplatin | CR |
| Page: 1 2 3 4 5 6 7 |
Top |
Related drugs of malignant transformation related genes |
| Identification of chemicals and drugs interact with genes involved in malignant transfromation |
| (DGIdb 4.0) |
| Entrez ID | Symbol | Category | Interaction Types | Drug Claim Name | Drug Name | PMIDs |
| 1558 | CYP2C8 | DRUGGABLE GENOME, CYTOCHROME P450, ENZYME | rucaparib | RUCAPARIB | ||
| 1558 | CYP2C8 | DRUGGABLE GENOME, CYTOCHROME P450, ENZYME | mycophenolate mofetil | 24681964 | ||
| 1558 | CYP2C8 | DRUGGABLE GENOME, CYTOCHROME P450, ENZYME | simeprevir | SIMEPREVIR | ||
| 1558 | CYP2C8 | DRUGGABLE GENOME, CYTOCHROME P450, ENZYME | inhibitor | 404859006 | VOXELOTOR | |
| 1558 | CYP2C8 | DRUGGABLE GENOME, CYTOCHROME P450, ENZYME | repaglinide | REPAGLINIDE | 17923851,15961978,14534525,18388877,21270106 | |
| 1558 | CYP2C8 | DRUGGABLE GENOME, CYTOCHROME P450, ENZYME | inhibitor | 178103840 | PHENELZINE | |
| 1558 | CYP2C8 | DRUGGABLE GENOME, CYTOCHROME P450, ENZYME | fluvastatin | FLUVASTATIN | ||
| 1558 | CYP2C8 | DRUGGABLE GENOME, CYTOCHROME P450, ENZYME | clopidogrel | CLOPIDOGREL | 24971633 | |
| 1558 | CYP2C8 | DRUGGABLE GENOME, CYTOCHROME P450, ENZYME | hmg coa reductase inhibitors | |||
| 1558 | CYP2C8 | DRUGGABLE GENOME, CYTOCHROME P450, ENZYME | pamidronate | PAMIDRONIC ACID | 18594024 |
| Page: 1 2 3 4 |

Copyright 2023-Present -The University of Texas Health Science Center at Houston |