
|
|||||
|
 | |
| |
| |
| |
| |
| |
|
Gene: CYP2C18 |
Gene summary for CYP2C18 |
| Gene information | Species | Human | Gene symbol | CYP2C18 | Gene ID | 1562 |
| Gene name | cytochrome P450 family 2 subfamily C member 18 | |
| Gene Alias | CPCI | |
| Cytomap | 10q23.33 | |
| Gene Type | protein-coding | GO ID | GO:0001523 | UniProtAcc | P33260 |
Top |
Malignant transformation analysis |
| Identification of the aberrant gene expression in precancerous and cancerous lesions by comparing the gene expression of stem-like cells in diseased tissues with normal stem cells |
| Entrez ID | Symbol | Replicates | Species | Organ | Tissue | Adj P-value | Log2FC | Malignancy |
| 1562 | CYP2C18 | P1T-E | Human | Esophagus | ESCC | 7.11e-04 | 2.35e-01 | 0.0875 |
| 1562 | CYP2C18 | P4T-E | Human | Esophagus | ESCC | 9.91e-08 | 2.36e-01 | 0.1323 |
| 1562 | CYP2C18 | P8T-E | Human | Esophagus | ESCC | 1.69e-03 | 1.56e-01 | 0.0889 |
| 1562 | CYP2C18 | P12T-E | Human | Esophagus | ESCC | 1.25e-06 | 3.03e-01 | 0.1122 |
| 1562 | CYP2C18 | P22T-E | Human | Esophagus | ESCC | 4.19e-02 | 5.27e-02 | 0.1236 |
| 1562 | CYP2C18 | P23T-E | Human | Esophagus | ESCC | 2.24e-15 | 3.88e-01 | 0.108 |
| 1562 | CYP2C18 | P27T-E | Human | Esophagus | ESCC | 2.93e-11 | 4.40e-01 | 0.1055 |
| 1562 | CYP2C18 | P28T-E | Human | Esophagus | ESCC | 1.47e-03 | 1.42e-01 | 0.1149 |
| 1562 | CYP2C18 | P39T-E | Human | Esophagus | ESCC | 2.26e-16 | 5.00e-01 | 0.0894 |
| 1562 | CYP2C18 | P54T-E | Human | Esophagus | ESCC | 7.29e-13 | 3.23e-01 | 0.0975 |
| 1562 | CYP2C18 | P84T-E | Human | Esophagus | ESCC | 1.06e-03 | 2.16e-01 | 0.0933 |
| 1562 | CYP2C18 | P94T-E | Human | Esophagus | ESCC | 3.53e-11 | 8.92e-01 | 0.0879 |
| 1562 | CYP2C18 | P104T-E | Human | Esophagus | ESCC | 1.13e-10 | 5.57e-01 | 0.0931 |
| 1562 | CYP2C18 | P127T-E | Human | Esophagus | ESCC | 1.56e-02 | 9.23e-02 | 0.0826 |
| 1562 | CYP2C18 | P128T-E | Human | Esophagus | ESCC | 5.67e-04 | 1.64e-01 | 0.1241 |
| 1562 | CYP2C18 | S41 | Human | Liver | Cirrhotic | 1.55e-09 | 7.48e-01 | -0.0343 |
| 1562 | CYP2C18 | HCC1_Meng | Human | Liver | HCC | 5.36e-45 | 6.24e-02 | 0.0246 |
| 1562 | CYP2C18 | HCC2_Meng | Human | Liver | HCC | 6.14e-27 | 1.81e-01 | 0.0107 |
| 1562 | CYP2C18 | HCC2 | Human | Liver | HCC | 7.76e-11 | 2.19e+00 | 0.5341 |
| 1562 | CYP2C18 | S027 | Human | Liver | HCC | 4.33e-03 | 4.50e-01 | 0.2446 |
| Page: 1 2 |
| Tissue | Expression Dynamics | Abbreviation |
| Esophagus | 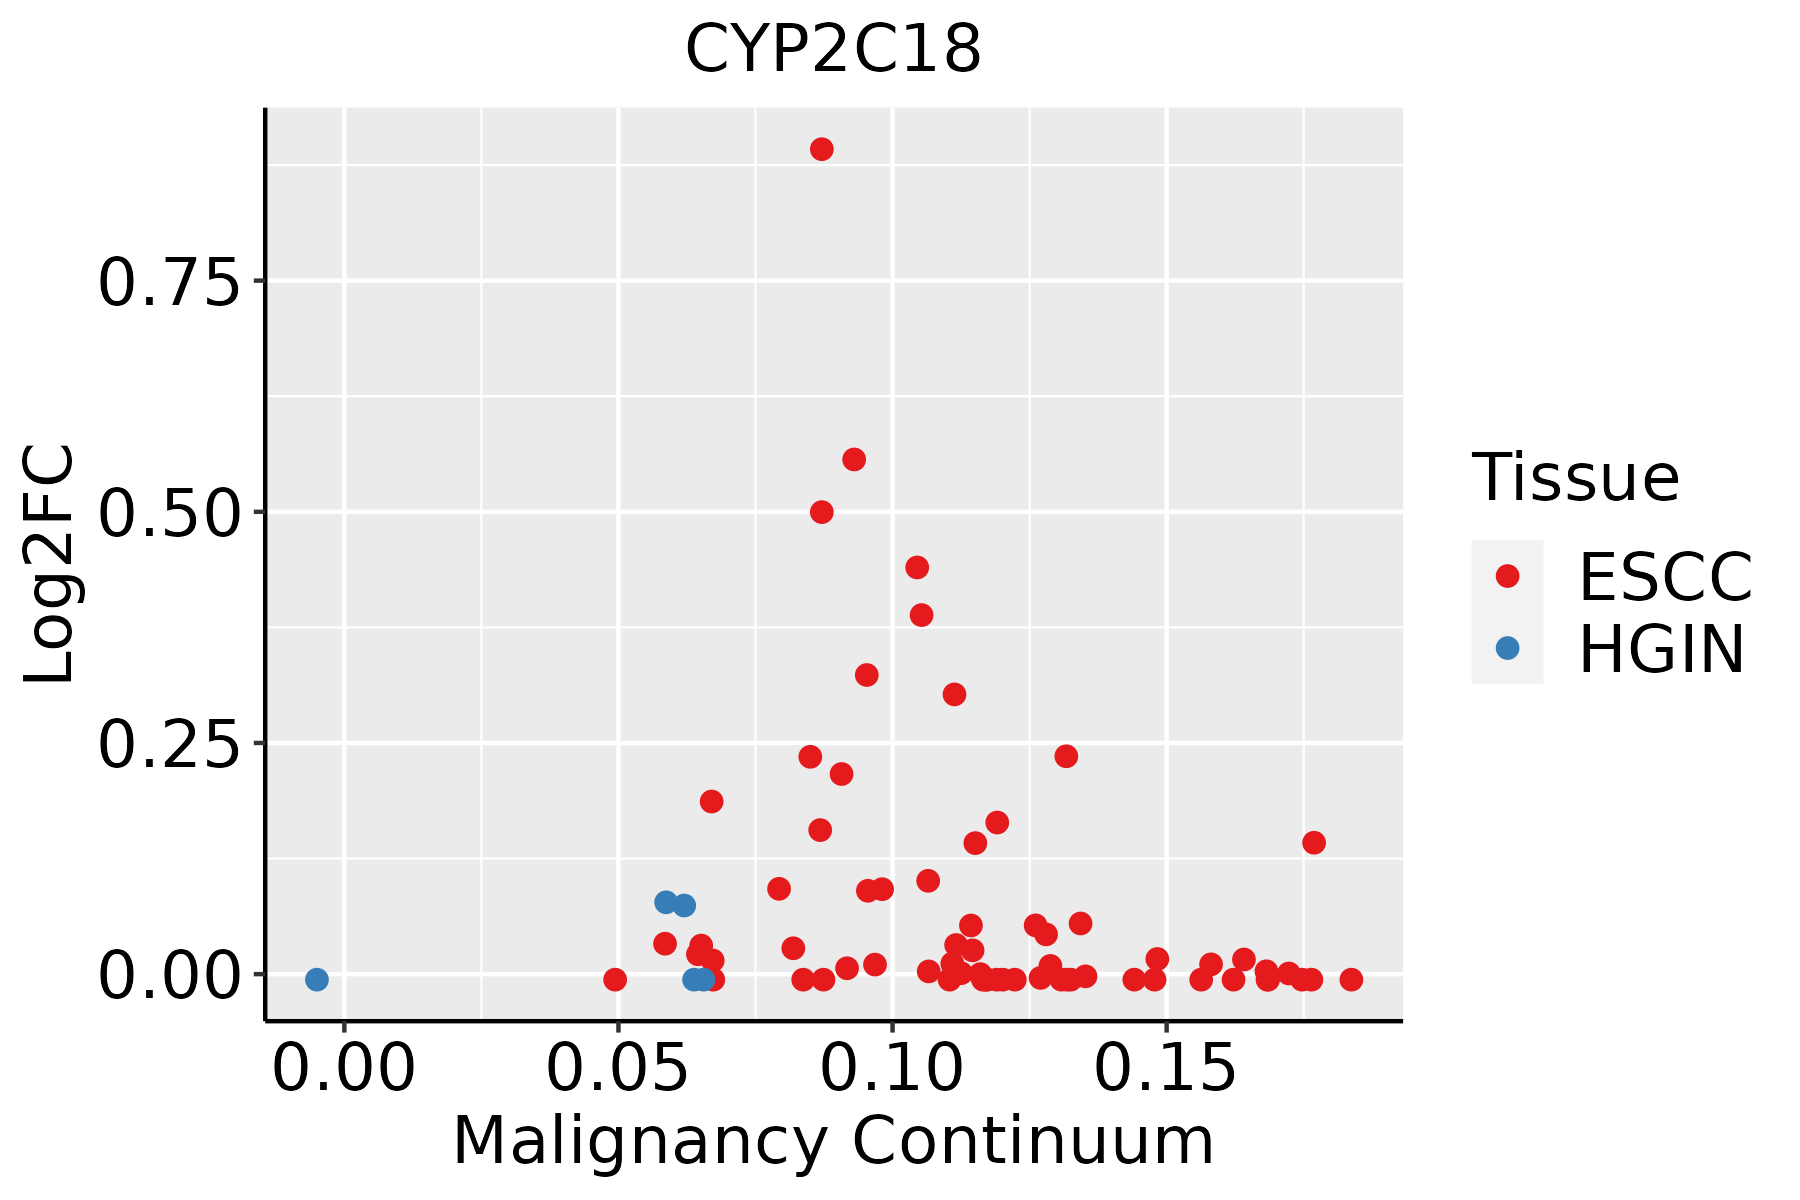 | ESCC: Esophageal squamous cell carcinoma |
| HGIN: High-grade intraepithelial neoplasias | ||
| LGIN: Low-grade intraepithelial neoplasias | ||
| GC | 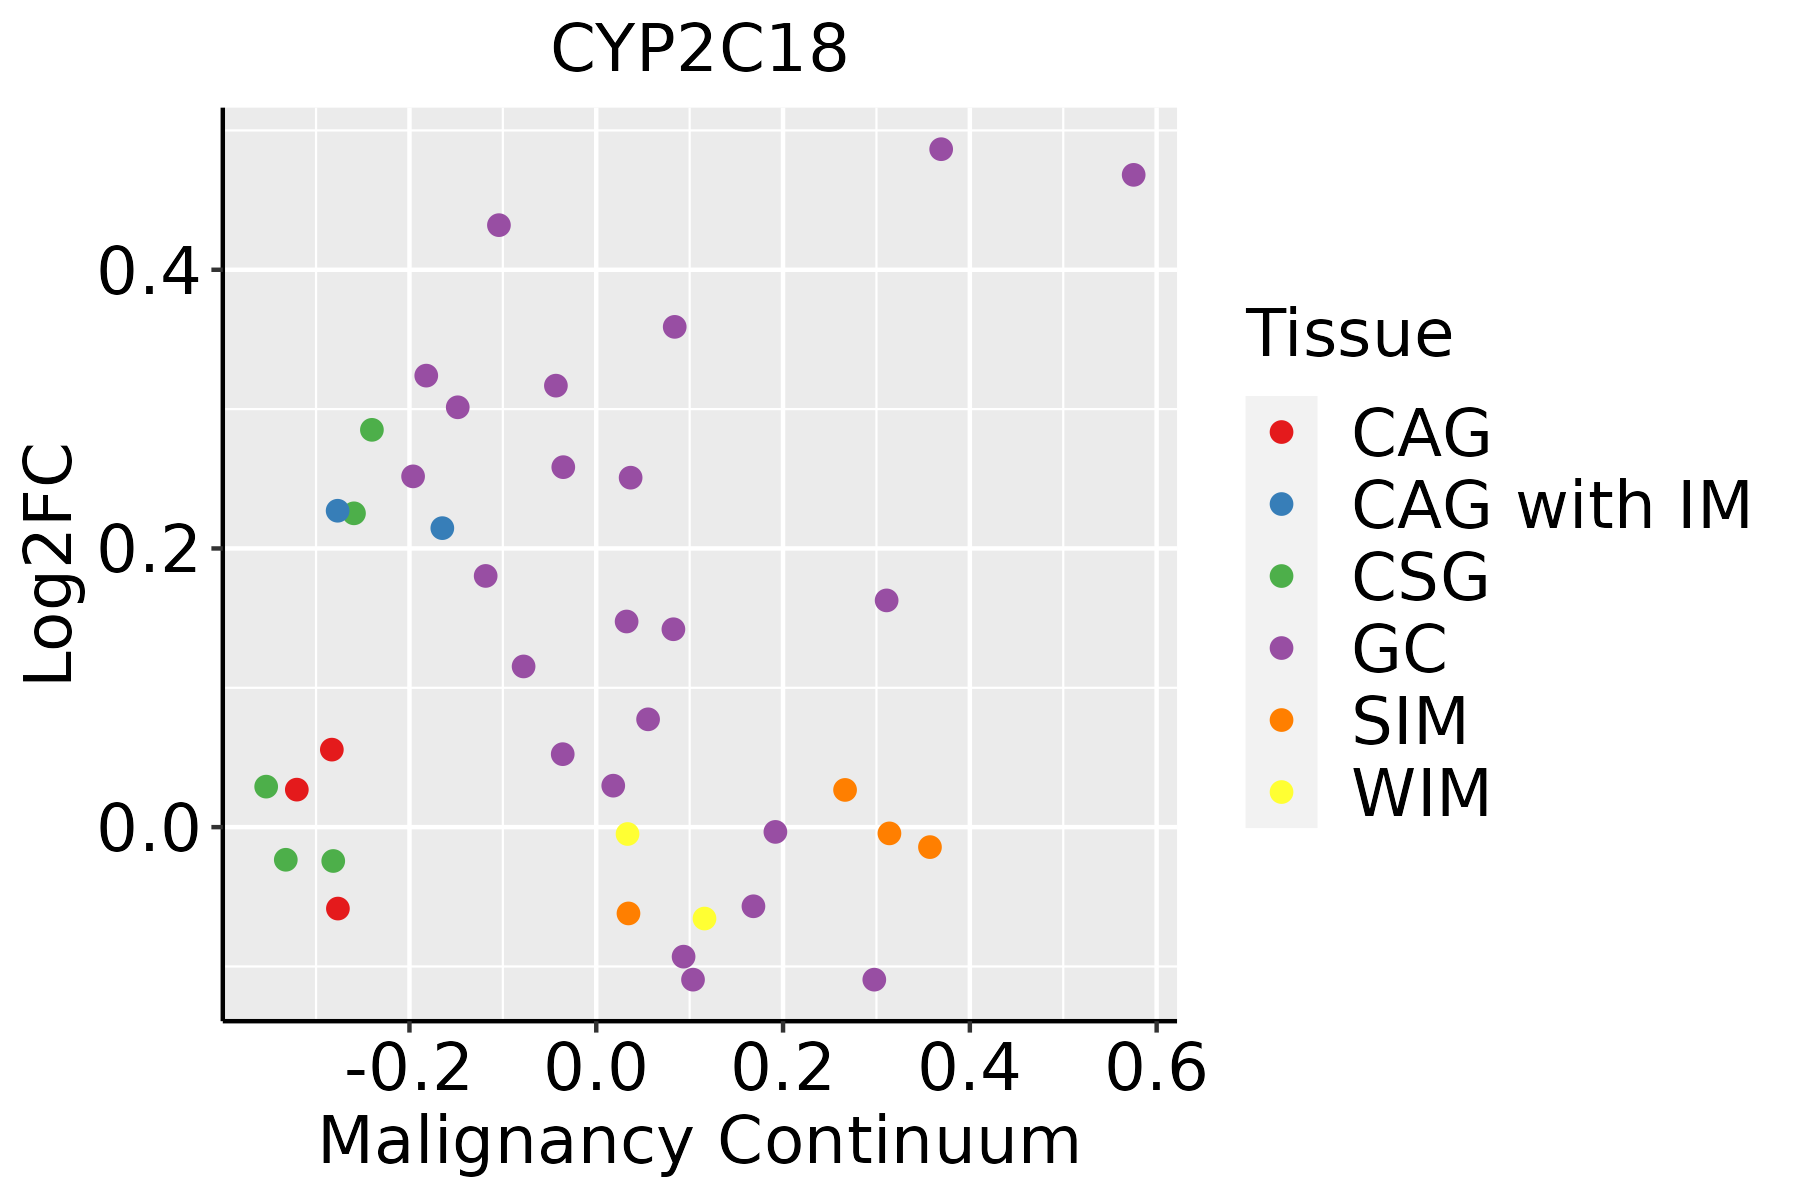 | CAG: Chronic atrophic gastritis |
| CAG with IM: Chronic atrophic gastritis with intestinal metaplasia | ||
| CSG: Chronic superficial gastritis | ||
| GC: Gastric cancer | ||
| SIM: Severe intestinal metaplasia | ||
| WIM: Wild intestinal metaplasia | ||
| Liver | 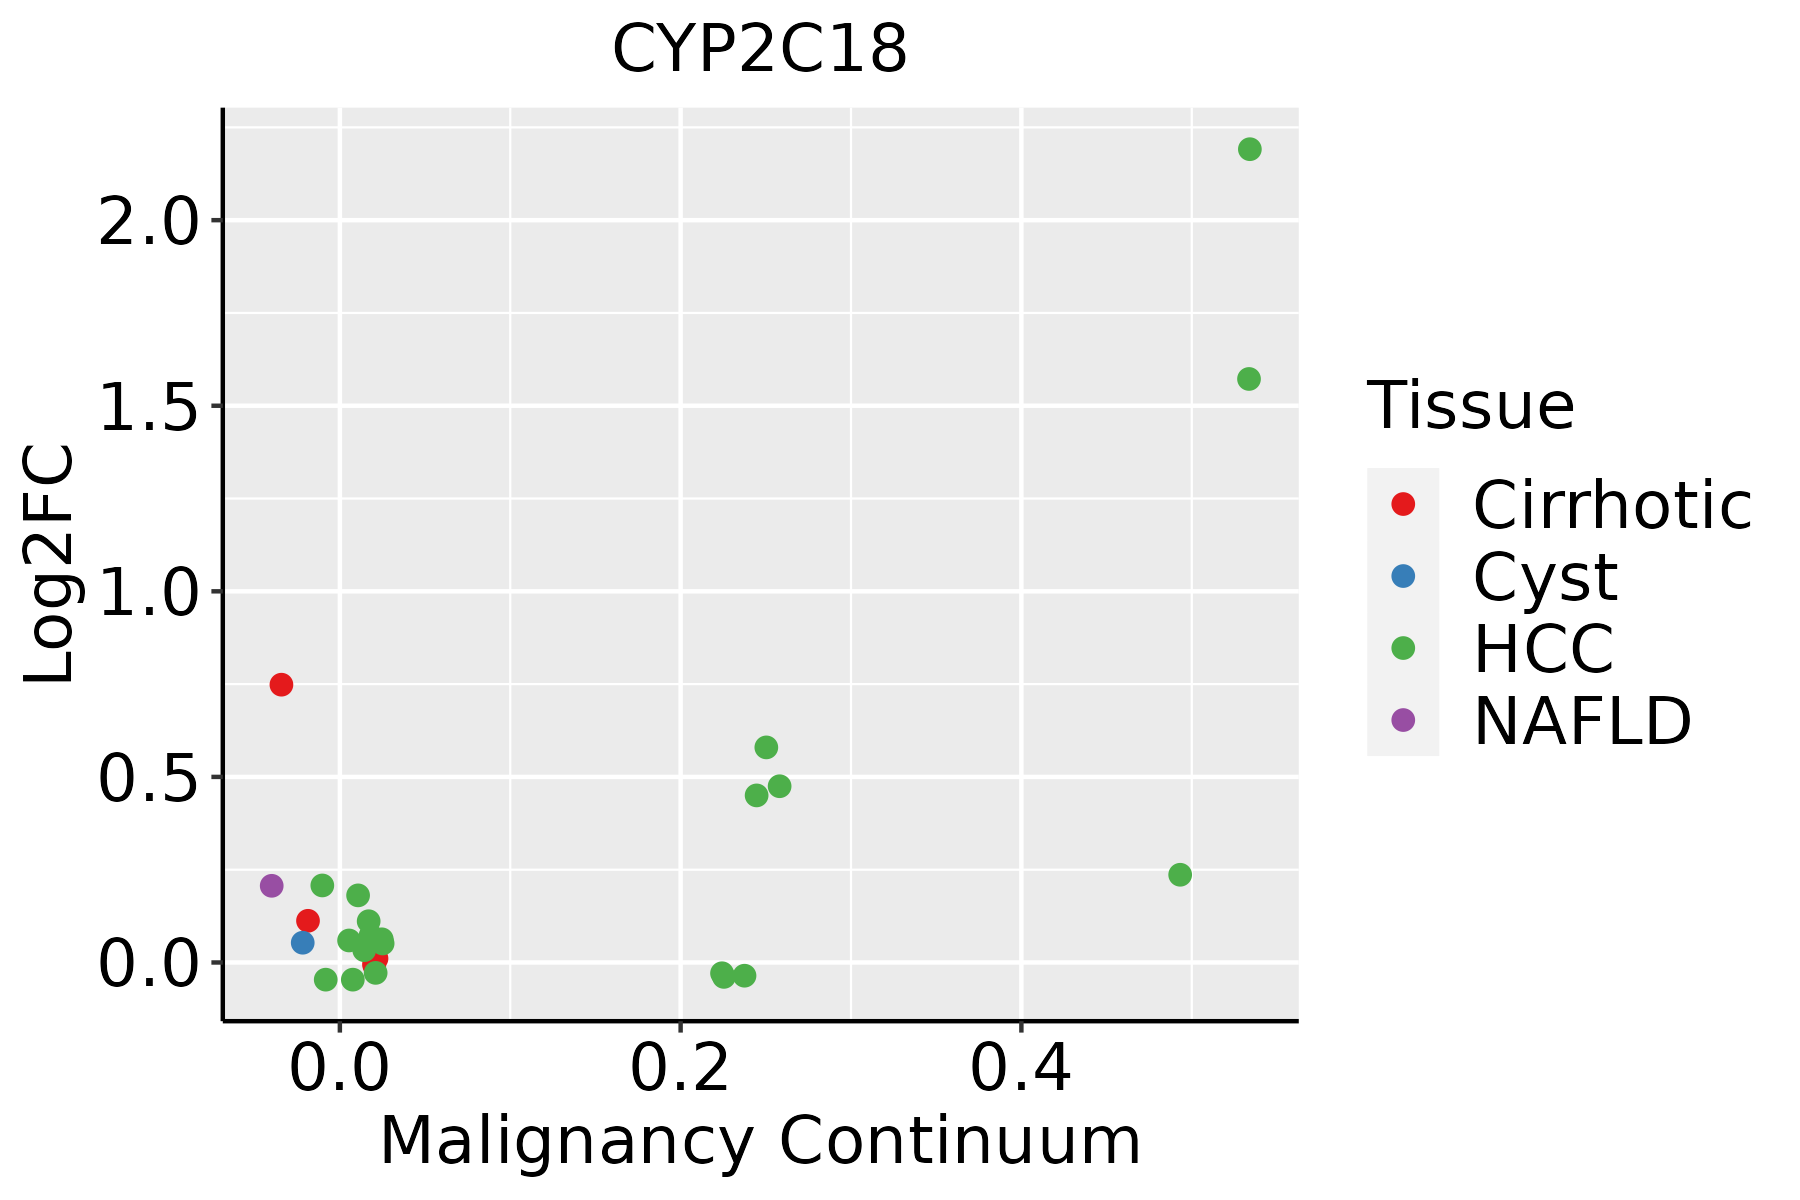 | HCC: Hepatocellular carcinoma |
| NAFLD: Non-alcoholic fatty liver disease |
| ∗log2FC in expression of this searched gene in stem-like cells from each diseased tissue sample relative to stem-like cells in normal samples in each tissue plotted against the malignancy continuum. Samples are colored based on if they are from different disease stage. |
Top |
Malignant transformation related pathway analysis |
| Find out the enriched GO biological processes and KEGG pathways involved in transition from healthy to precancer to cancer |
| Tissue | Disease Stage | Enriched GO biological Processes |
| Colorectum | AD |  |
| Colorectum | SER |  |
| Colorectum | MSS |  |
| Colorectum | MSI-H |  |
| Colorectum | FAP |  |
| ∗Top 15 enriched GO BP terms are showed in the bar plot of each disease state in each tissue. Each row represents a significant GO biological process which is colored according to the -log10(p.adjust). |
| Page: 1 2 3 4 5 6 7 8 9 |
| GO ID | Tissue | Disease Stage | Description | Gene Ratio | Bg Ratio | pvalue | p.adjust | Count |
| GO:00060668 | Esophagus | ESCC | alcohol metabolic process | 202/8552 | 353/18723 | 7.32e-06 | 7.26e-05 | 202 |
| GO:00066318 | Esophagus | ESCC | fatty acid metabolic process | 217/8552 | 390/18723 | 4.21e-05 | 3.39e-04 | 217 |
| GO:000941020 | Esophagus | ESCC | response to xenobiotic stimulus | 253/8552 | 462/18723 | 4.55e-05 | 3.58e-04 | 253 |
| GO:000663112 | Liver | Cirrhotic | fatty acid metabolic process | 165/4634 | 390/18723 | 1.29e-14 | 1.26e-12 | 165 |
| GO:000606612 | Liver | Cirrhotic | alcohol metabolic process | 141/4634 | 353/18723 | 1.57e-10 | 8.03e-09 | 141 |
| GO:000941012 | Liver | Cirrhotic | response to xenobiotic stimulus | 165/4634 | 462/18723 | 6.82e-08 | 2.09e-06 | 165 |
| GO:00714661 | Liver | Cirrhotic | cellular response to xenobiotic stimulus | 66/4634 | 177/18723 | 1.34e-04 | 1.31e-03 | 66 |
| GO:00067202 | Liver | Cirrhotic | isoprenoid metabolic process | 46/4634 | 116/18723 | 2.71e-04 | 2.41e-03 | 46 |
| GO:000680511 | Liver | Cirrhotic | xenobiotic metabolic process | 43/4634 | 111/18723 | 7.51e-04 | 5.54e-03 | 43 |
| GO:00067212 | Liver | Cirrhotic | terpenoid metabolic process | 38/4634 | 97/18723 | 1.16e-03 | 7.89e-03 | 38 |
| GO:003355911 | Liver | Cirrhotic | unsaturated fatty acid metabolic process | 43/4634 | 116/18723 | 2.09e-03 | 1.29e-02 | 43 |
| GO:004244511 | Liver | Cirrhotic | hormone metabolic process | 73/4634 | 218/18723 | 2.22e-03 | 1.36e-02 | 73 |
| GO:0042178 | Liver | Cirrhotic | xenobiotic catabolic process | 17/4634 | 37/18723 | 4.02e-03 | 2.17e-02 | 17 |
| GO:000167611 | Liver | Cirrhotic | long-chain fatty acid metabolic process | 40/4634 | 112/18723 | 6.16e-03 | 3.06e-02 | 40 |
| GO:00343085 | Liver | Cirrhotic | primary alcohol metabolic process | 37/4634 | 102/18723 | 6.17e-03 | 3.07e-02 | 37 |
| GO:012025411 | Liver | Cirrhotic | olefinic compound metabolic process | 51/4634 | 153/18723 | 1.03e-02 | 4.61e-02 | 51 |
| GO:000663122 | Liver | HCC | fatty acid metabolic process | 238/7958 | 390/18723 | 8.24e-14 | 4.84e-12 | 238 |
| GO:000606621 | Liver | HCC | alcohol metabolic process | 208/7958 | 353/18723 | 2.80e-10 | 9.50e-09 | 208 |
| GO:000941022 | Liver | HCC | response to xenobiotic stimulus | 248/7958 | 462/18723 | 6.47e-07 | 1.02e-05 | 248 |
| GO:000672011 | Liver | HCC | isoprenoid metabolic process | 65/7958 | 116/18723 | 2.23e-03 | 1.11e-02 | 65 |
| Page: 1 2 3 |
| Pathway ID | Tissue | Disease Stage | Description | Gene Ratio | Bg Ratio | pvalue | p.adjust | qvalue | Count |
| Page: 1 |
Top |
Cell-cell communication analysis |
| Identification of potential cell-cell interactions between two cell types and their ligand-receptor pairs for different disease states |
| Ligand | Receptor | LRpair | Pathway | Tissue | Disease Stage |
| Page: 1 |
Top |
Single-cell gene regulatory network inference analysis |
| Find out the significant the regulons (TFs) and the target genes of each regulon across cell types for different disease states |
| TF | Cell Type | Tissue | Disease Stage | Target Gene | RSS | Regulon Activity |
| ∗The dot plots of a searched regulon are shown for all cell subpopulations in each disease state of each tissue based on the regulon specific score inferred using pySCENIC and by calculating the average expression. |
| Page: 1 |
Top |
Somatic mutation of malignant transformation related genes |
| Annotation of somatic variants for genes involved in malignant transformation |
| Hugo Symbol | Variant Class | Variant Classification | dbSNP RS | HGVSc | HGVSp | HGVSp Short | SWISSPROT | BIOTYPE | SIFT | PolyPhen | Tumor Sample Barcode | Tissue | Histology | Sex | Age | Stage | Therapy Types | Drugs | Outcome |
| CYP2C18 | insertion | Nonsense_Mutation | novel | c.1109_1110insCCTTGATTCCTATGGCAAAATAGGAATTATCTTGAGATAAAAGCGA | p.Thr371LeufsTer13 | p.T371Lfs*13 | P33260 | protein_coding | TCGA-A2-A0CT-01 | Breast | breast invasive carcinoma | Female | >=65 | I/II | Chemotherapy | cytoxan | SD | ||
| CYP2C18 | insertion | Nonsense_Mutation | novel | c.314_315insGGATTCCTAGCAGAAC | p.Val106AspfsTer3 | p.V106Dfs*3 | P33260 | protein_coding | TCGA-AC-A3QQ-01 | Breast | breast invasive carcinoma | Female | <65 | I/II | Unknown | Unknown | SD | ||
| CYP2C18 | SNV | Missense_Mutation | novel | c.356N>C | p.Arg119Thr | p.R119T | P33260 | protein_coding | tolerated(0.77) | benign(0.031) | TCGA-EA-A3HU-01 | Cervix | cervical & endocervical cancer | Female | <65 | I/II | Unknown | Unknown | SD |
| CYP2C18 | SNV | Missense_Mutation | novel | c.794A>G | p.Asp265Gly | p.D265G | P33260 | protein_coding | deleterious(0) | probably_damaging(0.999) | TCGA-EA-A410-01 | Cervix | cervical & endocervical cancer | Female | <65 | I/II | Unknown | Unknown | SD |
| CYP2C18 | SNV | Missense_Mutation | c.136N>A | p.Asp46Asn | p.D46N | P33260 | protein_coding | tolerated(0.47) | benign(0.018) | TCGA-JX-A3Q0-01 | Cervix | cervical & endocervical cancer | Female | <65 | III/IV | Unknown | Unknown | SD | |
| CYP2C18 | SNV | Missense_Mutation | c.1213N>A | p.Glu405Lys | p.E405K | P33260 | protein_coding | tolerated(0.17) | benign(0.013) | TCGA-LP-A4AV-01 | Cervix | cervical & endocervical cancer | Female | <65 | I/II | Unknown | Unknown | SD | |
| CYP2C18 | SNV | Missense_Mutation | novel | c.16N>A | p.Ala6Thr | p.A6T | P33260 | protein_coding | tolerated(0.07) | benign(0.045) | TCGA-AM-5820-01 | Colorectum | colon adenocarcinoma | Female | <65 | I/II | Unknown | Unknown | SD |
| CYP2C18 | SNV | Missense_Mutation | novel | c.17N>T | p.Ala6Val | p.A6V | P33260 | protein_coding | tolerated(1) | benign(0) | TCGA-AM-5820-01 | Colorectum | colon adenocarcinoma | Female | <65 | I/II | Unknown | Unknown | SD |
| CYP2C18 | SNV | Missense_Mutation | rs763494410 | c.557N>A | p.Arg186Gln | p.R186Q | P33260 | protein_coding | deleterious(0.01) | possibly_damaging(0.719) | TCGA-CA-6717-01 | Colorectum | colon adenocarcinoma | Male | <65 | I/II | Chemotherapy | oxaliplatin | CR |
| CYP2C18 | SNV | Missense_Mutation | c.1360N>A | p.Gln454Lys | p.Q454K | P33260 | protein_coding | deleterious(0) | probably_damaging(0.991) | TCGA-F4-6856-01 | Colorectum | colon adenocarcinoma | Male | <65 | I/II | Ancillary | leucovorin | CR |
| Page: 1 2 3 4 5 6 |
Top |
Related drugs of malignant transformation related genes |
| Identification of chemicals and drugs interact with genes involved in malignant transfromation |
| (DGIdb 4.0) |
| Entrez ID | Symbol | Category | Interaction Types | Drug Claim Name | Drug Name | PMIDs |
| 1562 | CYP2C18 | ENZYME, CYTOCHROME P450, DRUGGABLE GENOME | inhibitor | 252827490 |
| Page: 1 |

Copyright 2023-Present -The University of Texas Health Science Center at Houston |