
|
|||||
|
 | |
| |
| |
| |
| |
| |
|
Gene: CYP27B1 |
Gene summary for CYP27B1 |
| Gene information | Species | Human | Gene symbol | CYP27B1 | Gene ID | 1594 |
| Gene name | cytochrome P450 family 27 subfamily B member 1 | |
| Gene Alias | CP2B | |
| Cytomap | 12q14.1 | |
| Gene Type | protein-coding | GO ID | GO:0000003 | UniProtAcc | O15528 |
Top |
Malignant transformation analysis |
| Identification of the aberrant gene expression in precancerous and cancerous lesions by comparing the gene expression of stem-like cells in diseased tissues with normal stem cells |
| Entrez ID | Symbol | Replicates | Species | Organ | Tissue | Adj P-value | Log2FC | Malignancy |
| 1594 | CYP27B1 | P21T-E | Human | Esophagus | ESCC | 5.22e-04 | 7.08e-03 | 0.1617 |
| 1594 | CYP27B1 | P26T-E | Human | Esophagus | ESCC | 3.57e-02 | -1.32e-02 | 0.1276 |
| 1594 | CYP27B1 | P37T-E | Human | Esophagus | ESCC | 7.75e-04 | 1.69e-02 | 0.1371 |
| 1594 | CYP27B1 | P49T-E | Human | Esophagus | ESCC | 1.61e-08 | 8.13e-01 | 0.1768 |
| 1594 | CYP27B1 | P62T-E | Human | Esophagus | ESCC | 3.99e-02 | -8.55e-03 | 0.1302 |
| 1594 | CYP27B1 | P74T-E | Human | Esophagus | ESCC | 2.50e-05 | 9.39e-02 | 0.1479 |
| 1594 | CYP27B1 | P89T-E | Human | Esophagus | ESCC | 1.31e-06 | 9.29e-01 | 0.1752 |
| 1594 | CYP27B1 | P91T-E | Human | Esophagus | ESCC | 4.10e-06 | 1.04e+00 | 0.1828 |
| 1594 | CYP27B1 | P128T-E | Human | Esophagus | ESCC | 8.92e-13 | 3.83e-01 | 0.1241 |
| 1594 | CYP27B1 | P130T-E | Human | Esophagus | ESCC | 3.87e-06 | 1.53e-01 | 0.1676 |
| 1594 | CYP27B1 | C04 | Human | Oral cavity | OSCC | 3.37e-16 | 6.81e-01 | 0.2633 |
| 1594 | CYP27B1 | C21 | Human | Oral cavity | OSCC | 5.56e-31 | 9.49e-01 | 0.2678 |
| 1594 | CYP27B1 | C30 | Human | Oral cavity | OSCC | 5.94e-13 | 6.59e-01 | 0.3055 |
| 1594 | CYP27B1 | C43 | Human | Oral cavity | OSCC | 7.87e-03 | 8.43e-02 | 0.1704 |
| 1594 | CYP27B1 | C51 | Human | Oral cavity | OSCC | 1.79e-02 | 1.84e-01 | 0.2674 |
| 1594 | CYP27B1 | C06 | Human | Oral cavity | OSCC | 1.28e-06 | 5.81e-01 | 0.2699 |
| 1594 | CYP27B1 | SYSMH2 | Human | Oral cavity | OSCC | 8.75e-05 | 1.75e-01 | 0.2326 |
| 1594 | CYP27B1 | SYSMH3 | Human | Oral cavity | OSCC | 2.38e-16 | 3.43e-01 | 0.2442 |
| 1594 | CYP27B1 | P1_cSCC | Human | Skin | cSCC | 4.55e-06 | 1.72e-01 | 0.0292 |
| 1594 | CYP27B1 | P2_cSCC | Human | Skin | cSCC | 6.41e-05 | 2.04e-01 | -0.024 |
| Page: 1 2 |
| Tissue | Expression Dynamics | Abbreviation |
| Esophagus |  | ESCC: Esophageal squamous cell carcinoma |
| HGIN: High-grade intraepithelial neoplasias | ||
| LGIN: Low-grade intraepithelial neoplasias | ||
| Oral Cavity | 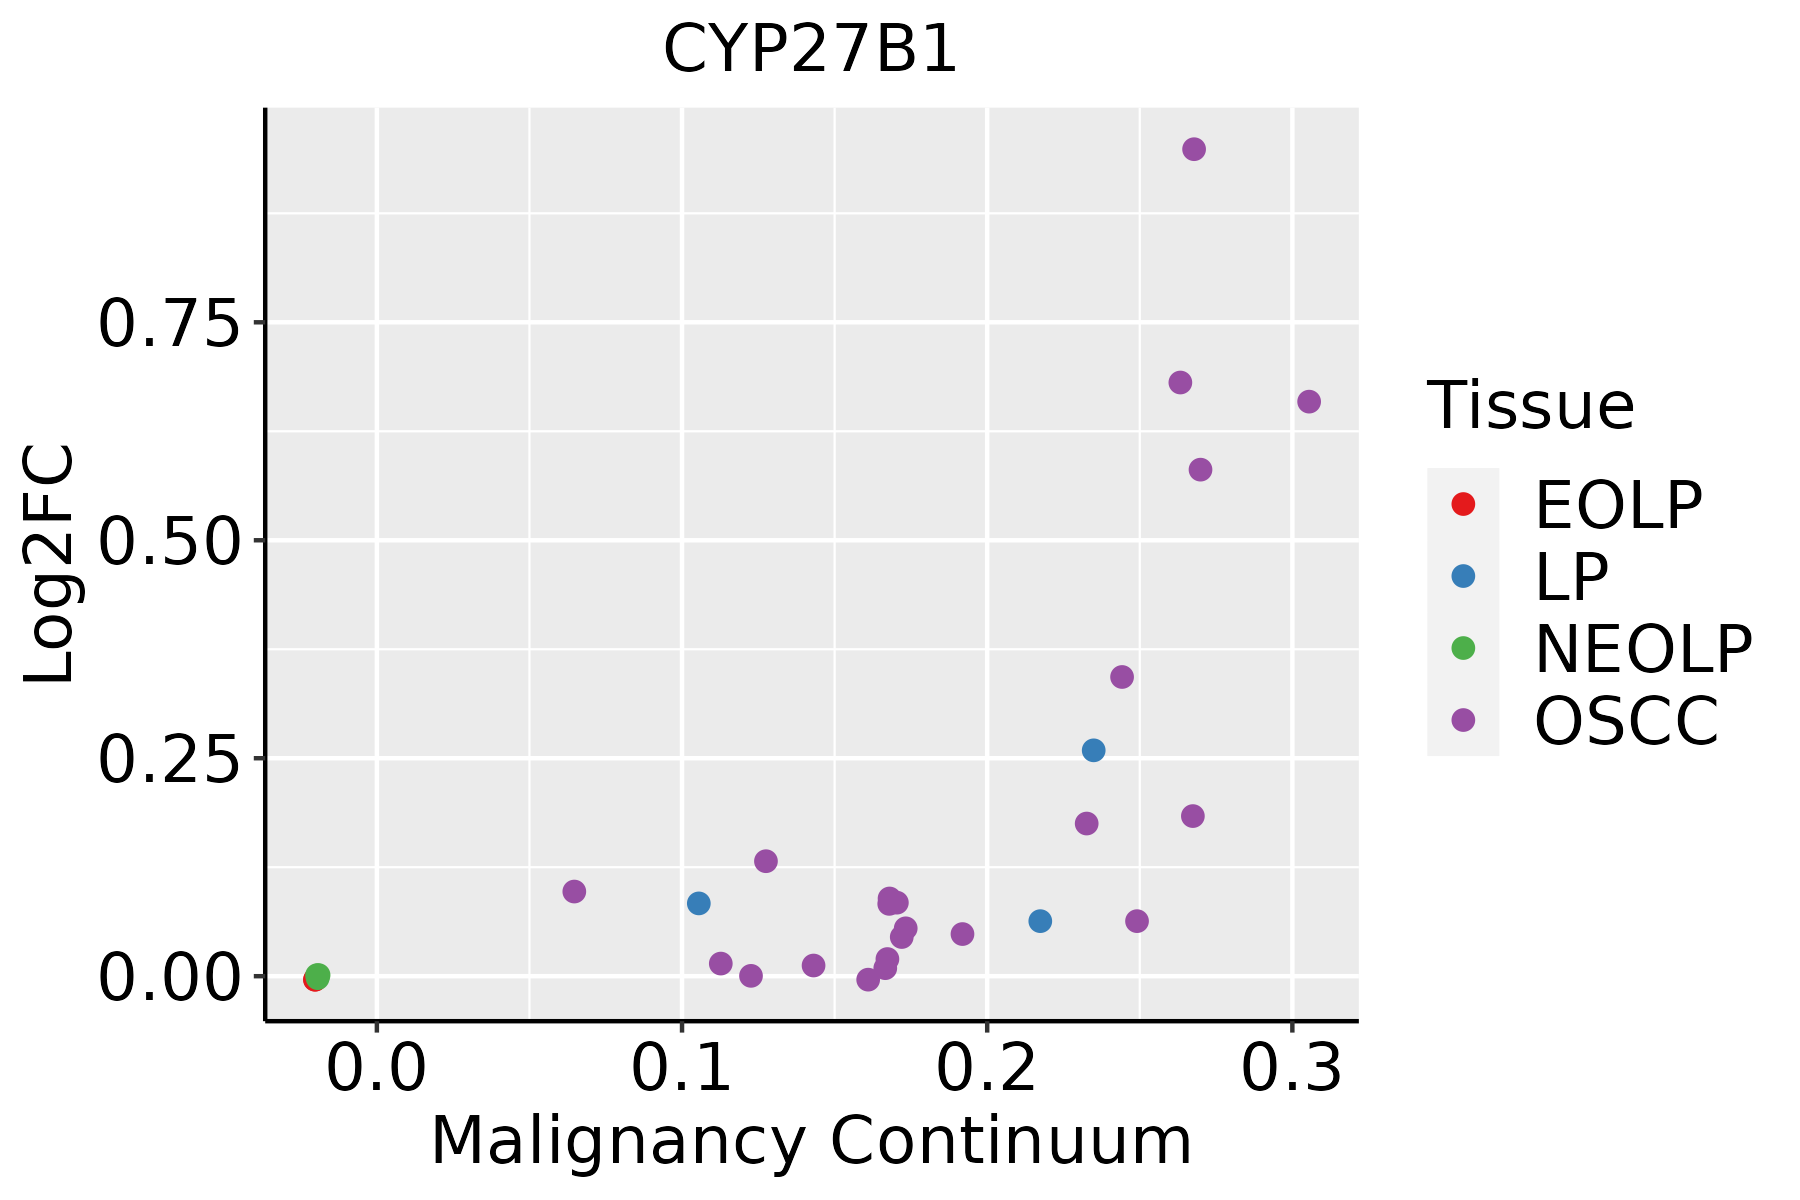 | EOLP: Erosive Oral lichen planus |
| LP: leukoplakia | ||
| NEOLP: Non-erosive oral lichen planus | ||
| OSCC: Oral squamous cell carcinoma | ||
| Skin | 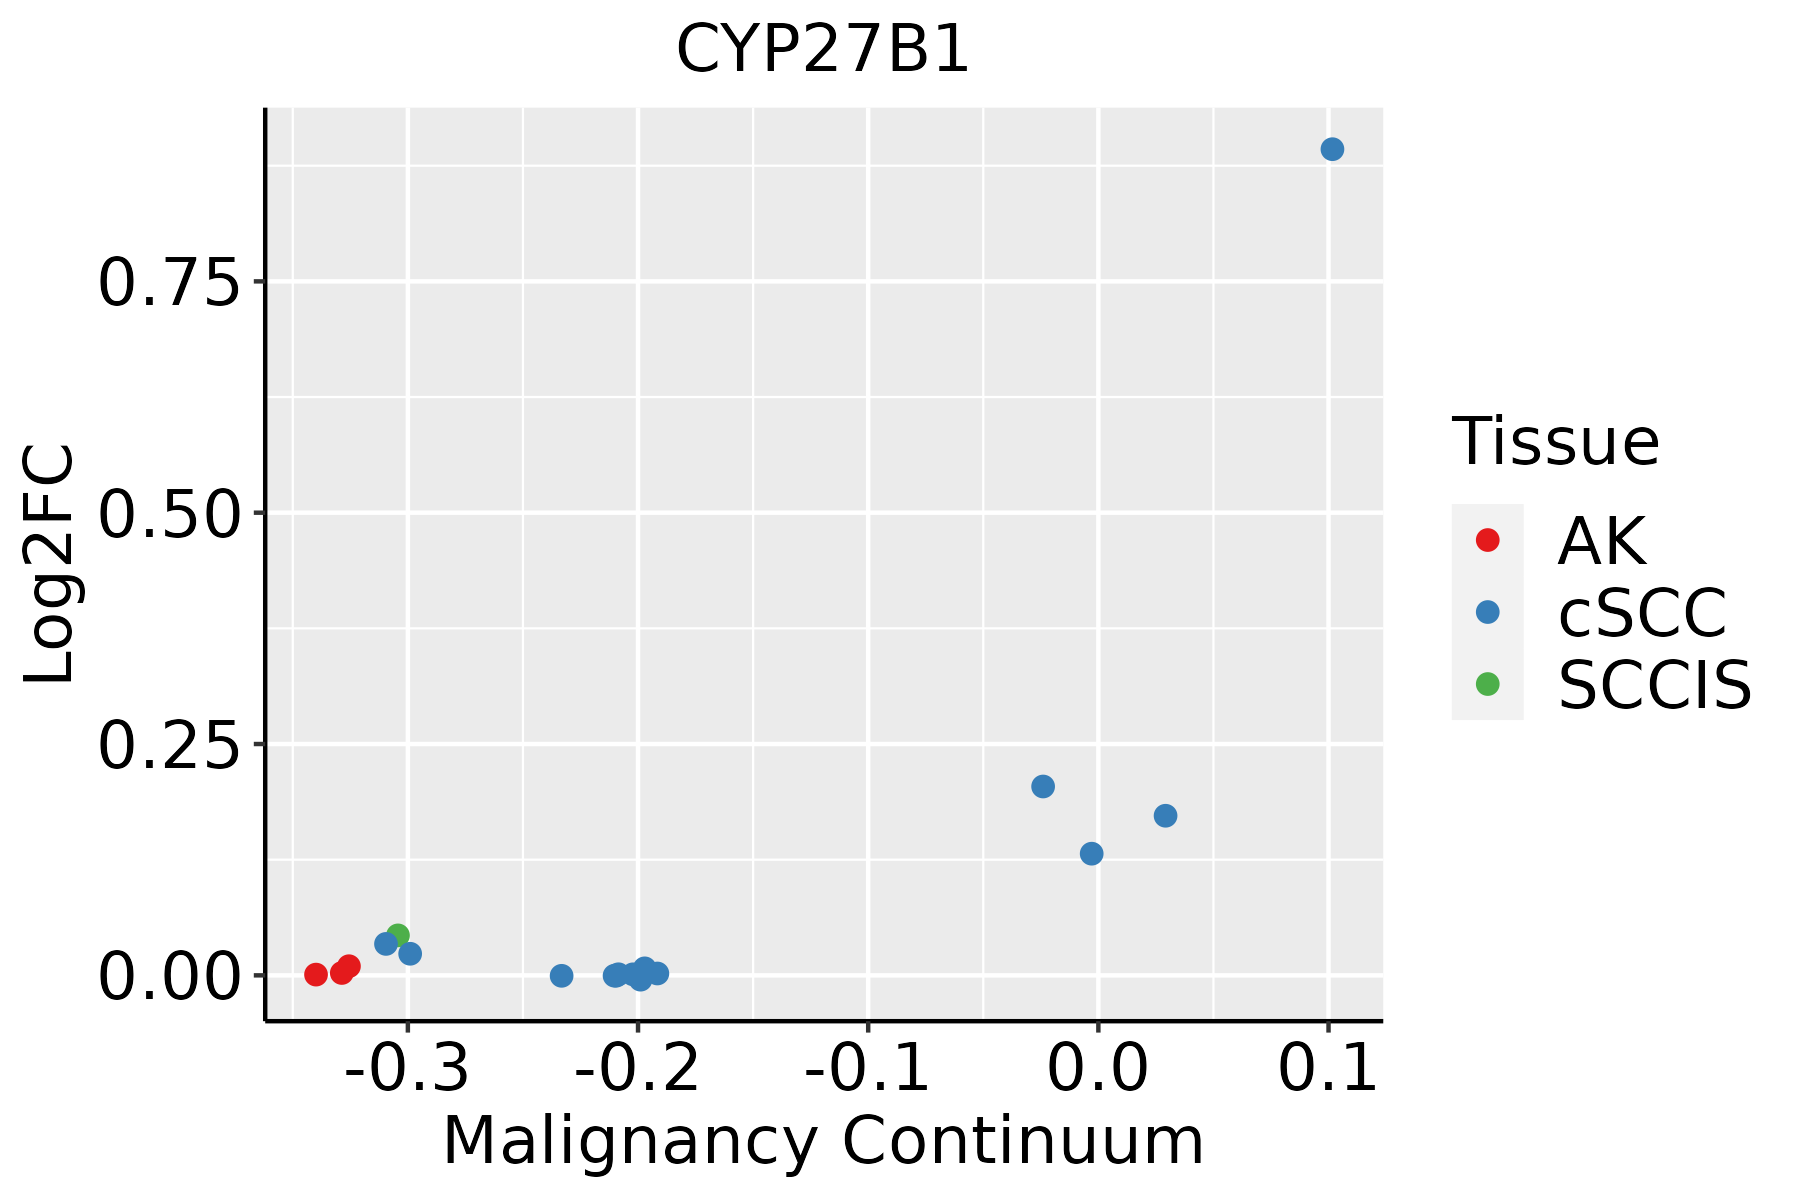 | AK: Actinic keratosis |
| cSCC: Cutaneous squamous cell carcinoma | ||
| SCCIS:squamous cell carcinoma in situ |
| ∗log2FC in expression of this searched gene in stem-like cells from each diseased tissue sample relative to stem-like cells in normal samples in each tissue plotted against the malignancy continuum. Samples are colored based on if they are from different disease stage. |
Top |
Malignant transformation related pathway analysis |
| Find out the enriched GO biological processes and KEGG pathways involved in transition from healthy to precancer to cancer |
| Tissue | Disease Stage | Enriched GO biological Processes |
| Colorectum | AD |  |
| Colorectum | SER |  |
| Colorectum | MSS |  |
| Colorectum | MSI-H |  |
| Colorectum | FAP |  |
| ∗Top 15 enriched GO BP terms are showed in the bar plot of each disease state in each tissue. Each row represents a significant GO biological process which is colored according to the -log10(p.adjust). |
| Page: 1 2 3 4 5 6 7 8 9 |
| GO ID | Tissue | Disease Stage | Description | Gene Ratio | Bg Ratio | pvalue | p.adjust | Count |
| GO:0071496111 | Esophagus | ESCC | cellular response to external stimulus | 215/8552 | 320/18723 | 4.29e-15 | 2.43e-13 | 215 |
| GO:190136118 | Esophagus | ESCC | organic cyclic compound catabolic process | 307/8552 | 495/18723 | 9.99e-14 | 4.80e-12 | 307 |
| GO:0031668111 | Esophagus | ESCC | cellular response to extracellular stimulus | 168/8552 | 246/18723 | 4.93e-13 | 2.23e-11 | 168 |
| GO:0031669110 | Esophagus | ESCC | cellular response to nutrient levels | 148/8552 | 215/18723 | 4.58e-12 | 1.76e-10 | 148 |
| GO:0031667111 | Esophagus | ESCC | response to nutrient levels | 289/8552 | 474/18723 | 9.25e-12 | 3.47e-10 | 289 |
| GO:0016049110 | Esophagus | ESCC | cell growth | 289/8552 | 482/18723 | 1.29e-10 | 3.77e-09 | 289 |
| GO:0030522110 | Esophagus | ESCC | intracellular receptor signaling pathway | 170/8552 | 265/18723 | 8.58e-10 | 2.09e-08 | 170 |
| GO:000155819 | Esophagus | ESCC | regulation of cell growth | 248/8552 | 414/18723 | 2.97e-09 | 6.45e-08 | 248 |
| GO:0001890110 | Esophagus | ESCC | placenta development | 98/8552 | 144/18723 | 4.46e-08 | 8.11e-07 | 98 |
| GO:00435888 | Esophagus | ESCC | skin development | 163/8552 | 263/18723 | 6.48e-08 | 1.14e-06 | 163 |
| GO:000758410 | Esophagus | ESCC | response to nutrient | 114/8552 | 174/18723 | 9.43e-08 | 1.56e-06 | 114 |
| GO:0061458110 | Esophagus | ESCC | reproductive system development | 247/8552 | 427/18723 | 2.24e-07 | 3.42e-06 | 247 |
| GO:004860818 | Esophagus | ESCC | reproductive structure development | 245/8552 | 424/18723 | 2.82e-07 | 4.14e-06 | 245 |
| GO:000854410 | Esophagus | ESCC | epidermis development | 193/8552 | 324/18723 | 2.87e-07 | 4.19e-06 | 193 |
| GO:000150317 | Esophagus | ESCC | ossification | 232/8552 | 408/18723 | 3.00e-06 | 3.40e-05 | 232 |
| GO:00060668 | Esophagus | ESCC | alcohol metabolic process | 202/8552 | 353/18723 | 7.32e-06 | 7.26e-05 | 202 |
| GO:00459267 | Esophagus | ESCC | negative regulation of growth | 148/8552 | 249/18723 | 7.88e-06 | 7.73e-05 | 148 |
| GO:000991310 | Esophagus | ESCC | epidermal cell differentiation | 122/8552 | 202/18723 | 1.69e-05 | 1.51e-04 | 122 |
| GO:00018937 | Esophagus | ESCC | maternal placenta development | 28/8552 | 35/18723 | 3.40e-05 | 2.78e-04 | 28 |
| GO:00456826 | Esophagus | ESCC | regulation of epidermis development | 46/8552 | 65/18723 | 3.65e-05 | 2.97e-04 | 46 |
| Page: 1 2 3 4 5 6 |
| Pathway ID | Tissue | Disease Stage | Description | Gene Ratio | Bg Ratio | pvalue | p.adjust | qvalue | Count |
| hsa051526 | Oral cavity | OSCC | Tuberculosis | 105/3704 | 180/8465 | 5.00e-05 | 2.04e-04 | 1.04e-04 | 105 |
| hsa001004 | Oral cavity | OSCC | Steroid biosynthesis | 15/3704 | 20/8465 | 4.62e-03 | 1.13e-02 | 5.75e-03 | 15 |
| hsa0515211 | Oral cavity | OSCC | Tuberculosis | 105/3704 | 180/8465 | 5.00e-05 | 2.04e-04 | 1.04e-04 | 105 |
| hsa0010011 | Oral cavity | OSCC | Steroid biosynthesis | 15/3704 | 20/8465 | 4.62e-03 | 1.13e-02 | 5.75e-03 | 15 |
| Page: 1 |
Top |
Cell-cell communication analysis |
| Identification of potential cell-cell interactions between two cell types and their ligand-receptor pairs for different disease states |
| Ligand | Receptor | LRpair | Pathway | Tissue | Disease Stage |
| Page: 1 |
Top |
Single-cell gene regulatory network inference analysis |
| Find out the significant the regulons (TFs) and the target genes of each regulon across cell types for different disease states |
| TF | Cell Type | Tissue | Disease Stage | Target Gene | RSS | Regulon Activity |
| ∗The dot plots of a searched regulon are shown for all cell subpopulations in each disease state of each tissue based on the regulon specific score inferred using pySCENIC and by calculating the average expression. |
| Page: 1 |
Top |
Somatic mutation of malignant transformation related genes |
| Annotation of somatic variants for genes involved in malignant transformation |
| Hugo Symbol | Variant Class | Variant Classification | dbSNP RS | HGVSc | HGVSp | HGVSp Short | SWISSPROT | BIOTYPE | SIFT | PolyPhen | Tumor Sample Barcode | Tissue | Histology | Sex | Age | Stage | Therapy Types | Drugs | Outcome |
| CYP27B1 | SNV | Missense_Mutation | rs757777816 | c.467N>A | p.Gly156Glu | p.G156E | O15528 | protein_coding | tolerated(1) | benign(0.007) | TCGA-A8-A075-01 | Breast | breast invasive carcinoma | Female | <65 | I/II | Chemotherapy | epirubicin | CR |
| CYP27B1 | SNV | Missense_Mutation | novel | c.1334N>A | p.Ser445Tyr | p.S445Y | O15528 | protein_coding | deleterious(0) | benign(0.175) | TCGA-A8-A0A1-01 | Breast | breast invasive carcinoma | Female | >=65 | I/II | Hormone Therapy | tamoxiphen | SD |
| CYP27B1 | SNV | Missense_Mutation | c.464N>T | p.Ala155Val | p.A155V | O15528 | protein_coding | tolerated(0.06) | possibly_damaging(0.475) | TCGA-E2-A15H-01 | Breast | breast invasive carcinoma | Female | <65 | I/II | Chemotherapy | herceptin | SD | |
| CYP27B1 | SNV | Missense_Mutation | novel | c.37N>A | p.His13Asn | p.H13N | O15528 | protein_coding | tolerated_low_confidence(0.25) | benign(0.001) | TCGA-E9-A5FL-01 | Breast | breast invasive carcinoma | Female | >=65 | I/II | Unknown | Unknown | SD |
| CYP27B1 | SNV | Missense_Mutation | c.1163C>T | p.Ser388Phe | p.S388F | O15528 | protein_coding | deleterious(0) | probably_damaging(0.979) | TCGA-GM-A2DH-01 | Breast | breast invasive carcinoma | Female | <65 | I/II | Chemotherapy | taxol | CR | |
| CYP27B1 | insertion | In_Frame_Ins | novel | c.632_633insAGT | p.Glu211_Ala212insVal | p.E211_A212insV | O15528 | protein_coding | TCGA-A8-A09Z-01 | Breast | breast invasive carcinoma | Female | >=65 | I/II | Unknown | Unknown | SD | ||
| CYP27B1 | insertion | Nonsense_Mutation | novel | c.1332_1333insGGGGAGTTAGGTGTGTAAGAGGAAGA | p.Ser445GlyfsTer6 | p.S445Gfs*6 | O15528 | protein_coding | TCGA-A8-A0A1-01 | Breast | breast invasive carcinoma | Female | >=65 | I/II | Hormone Therapy | tamoxiphen | SD | ||
| CYP27B1 | SNV | Missense_Mutation | c.1240N>A | p.Ala414Thr | p.A414T | O15528 | protein_coding | deleterious(0.03) | benign(0.117) | TCGA-C5-A2M2-01 | Cervix | cervical & endocervical cancer | Female | <65 | I/II | Unknown | Unknown | SD | |
| CYP27B1 | SNV | Missense_Mutation | rs376304260 | c.170G>A | p.Gly57Glu | p.G57E | O15528 | protein_coding | deleterious(0.02) | possibly_damaging(0.771) | TCGA-VS-A957-01 | Cervix | cervical & endocervical cancer | Female | <65 | I/II | Chemotherapy | cisplatin | CR |
| CYP27B1 | SNV | Missense_Mutation | rs768857789 | c.1295N>A | p.Arg432His | p.R432H | O15528 | protein_coding | deleterious(0) | probably_damaging(1) | TCGA-A6-5665-01 | Colorectum | colon adenocarcinoma | Female | >=65 | I/II | Unknown | Unknown | PD |
| Page: 1 2 3 4 5 6 |
Top |
Related drugs of malignant transformation related genes |
| Identification of chemicals and drugs interact with genes involved in malignant transfromation |
| (DGIdb 4.0) |
| Entrez ID | Symbol | Category | Interaction Types | Drug Claim Name | Drug Name | PMIDs |
| 1594 | CYP27B1 | ENZYME, DRUGGABLE GENOME, CYTOCHROME P450 | 20S-HYDROXYVITAMIN D3 | CHEMBL2036072 | 22404326 | |
| 1594 | CYP27B1 | ENZYME, DRUGGABLE GENOME, CYTOCHROME P450 | peginterferon alfa-2b | 21145801 | ||
| 1594 | CYP27B1 | ENZYME, DRUGGABLE GENOME, CYTOCHROME P450 | tenofovir disoproxil fumarate | 31619748 | ||
| 1594 | CYP27B1 | ENZYME, DRUGGABLE GENOME, CYTOCHROME P450 | ribavirin | RIBAVIRIN | 21145801 | |
| 1594 | CYP27B1 | ENZYME, DRUGGABLE GENOME, CYTOCHROME P450 | inhibitor | 252827515 | CHEMBL255088 | |
| 1594 | CYP27B1 | ENZYME, DRUGGABLE GENOME, CYTOCHROME P450 | deferasirox | DEFERASIROX | 30651574 | |
| 1594 | CYP27B1 | ENZYME, DRUGGABLE GENOME, CYTOCHROME P450 | INTERFERON GAMMA | 12055341 | ||
| 1594 | CYP27B1 | ENZYME, DRUGGABLE GENOME, CYTOCHROME P450 | SOY PROTEIN | 12421875 | ||
| 1594 | CYP27B1 | ENZYME, DRUGGABLE GENOME, CYTOCHROME P450 | 5-AZA-2&APOS;-DEOXYCYTIDINE | 15860259 | ||
| 1594 | CYP27B1 | ENZYME, DRUGGABLE GENOME, CYTOCHROME P450 | TRICHOSTATIN A | 15860259 |
| Page: 1 |

Copyright 2023-Present -The University of Texas Health Science Center at Houston |