
|
|||||
|
 | |
| |
| |
| |
| |
| |
|
Gene: CYP27A1 |
Gene summary for CYP27A1 |
| Gene information | Species | Human | Gene symbol | CYP27A1 | Gene ID | 1593 |
| Gene name | cytochrome P450 family 27 subfamily A member 1 | |
| Gene Alias | CP27 | |
| Cytomap | 2q35 | |
| Gene Type | protein-coding | GO ID | GO:0006066 | UniProtAcc | Q02318 |
Top |
Malignant transformation analysis |
| Identification of the aberrant gene expression in precancerous and cancerous lesions by comparing the gene expression of stem-like cells in diseased tissues with normal stem cells |
| Entrez ID | Symbol | Replicates | Species | Organ | Tissue | Adj P-value | Log2FC | Malignancy |
| 1593 | CYP27A1 | HTA11_347_2000001011 | Human | Colorectum | AD | 8.98e-08 | 3.43e-01 | -0.1954 |
| 1593 | CYP27A1 | HTA11_83_2000001011 | Human | Colorectum | SER | 1.21e-07 | 5.02e-01 | -0.1526 |
| 1593 | CYP27A1 | HTA11_696_2000001011 | Human | Colorectum | AD | 1.93e-05 | 2.33e-01 | -0.1464 |
| 1593 | CYP27A1 | HTA11_866_2000001011 | Human | Colorectum | AD | 1.96e-03 | 1.80e-01 | -0.1001 |
| 1593 | CYP27A1 | HTA11_99999971662_82457 | Human | Colorectum | MSS | 7.17e-03 | 1.95e-01 | 0.3859 |
| 1593 | CYP27A1 | HTA11_99999974143_84620 | Human | Colorectum | MSS | 2.15e-02 | 2.17e-01 | 0.3005 |
| 1593 | CYP27A1 | P4T-E | Human | Esophagus | ESCC | 4.57e-05 | 1.83e-01 | 0.1323 |
| 1593 | CYP27A1 | P8T-E | Human | Esophagus | ESCC | 6.24e-08 | 1.70e-01 | 0.0889 |
| 1593 | CYP27A1 | P10T-E | Human | Esophagus | ESCC | 1.85e-03 | 5.17e-02 | 0.116 |
| 1593 | CYP27A1 | P11T-E | Human | Esophagus | ESCC | 4.07e-03 | 2.37e-01 | 0.1426 |
| 1593 | CYP27A1 | P12T-E | Human | Esophagus | ESCC | 3.92e-16 | 2.78e-01 | 0.1122 |
| 1593 | CYP27A1 | P17T-E | Human | Esophagus | ESCC | 4.05e-03 | 3.02e-01 | 0.1278 |
| 1593 | CYP27A1 | P24T-E | Human | Esophagus | ESCC | 6.61e-07 | 2.41e-01 | 0.1287 |
| 1593 | CYP27A1 | P27T-E | Human | Esophagus | ESCC | 4.74e-09 | 2.31e-01 | 0.1055 |
| 1593 | CYP27A1 | P40T-E | Human | Esophagus | ESCC | 7.26e-03 | 1.22e-01 | 0.109 |
| 1593 | CYP27A1 | P44T-E | Human | Esophagus | ESCC | 1.70e-07 | 2.34e-01 | 0.1096 |
| 1593 | CYP27A1 | P56T-E | Human | Esophagus | ESCC | 6.98e-09 | 1.38e+00 | 0.1613 |
| 1593 | CYP27A1 | P57T-E | Human | Esophagus | ESCC | 1.61e-29 | 4.91e-01 | 0.0926 |
| 1593 | CYP27A1 | P61T-E | Human | Esophagus | ESCC | 1.79e-12 | 3.06e-01 | 0.099 |
| 1593 | CYP27A1 | P65T-E | Human | Esophagus | ESCC | 2.20e-02 | 1.18e-01 | 0.0978 |
| Page: 1 2 3 |
| Tissue | Expression Dynamics | Abbreviation |
| Colorectum (GSE201348) |  | FAP: Familial adenomatous polyposis |
| CRC: Colorectal cancer | ||
| Colorectum (HTA11) |  | AD: Adenomas |
| SER: Sessile serrated lesions | ||
| MSI-H: Microsatellite-high colorectal cancer | ||
| MSS: Microsatellite stable colorectal cancer | ||
| Esophagus |  | ESCC: Esophageal squamous cell carcinoma |
| HGIN: High-grade intraepithelial neoplasias | ||
| LGIN: Low-grade intraepithelial neoplasias | ||
| Liver | 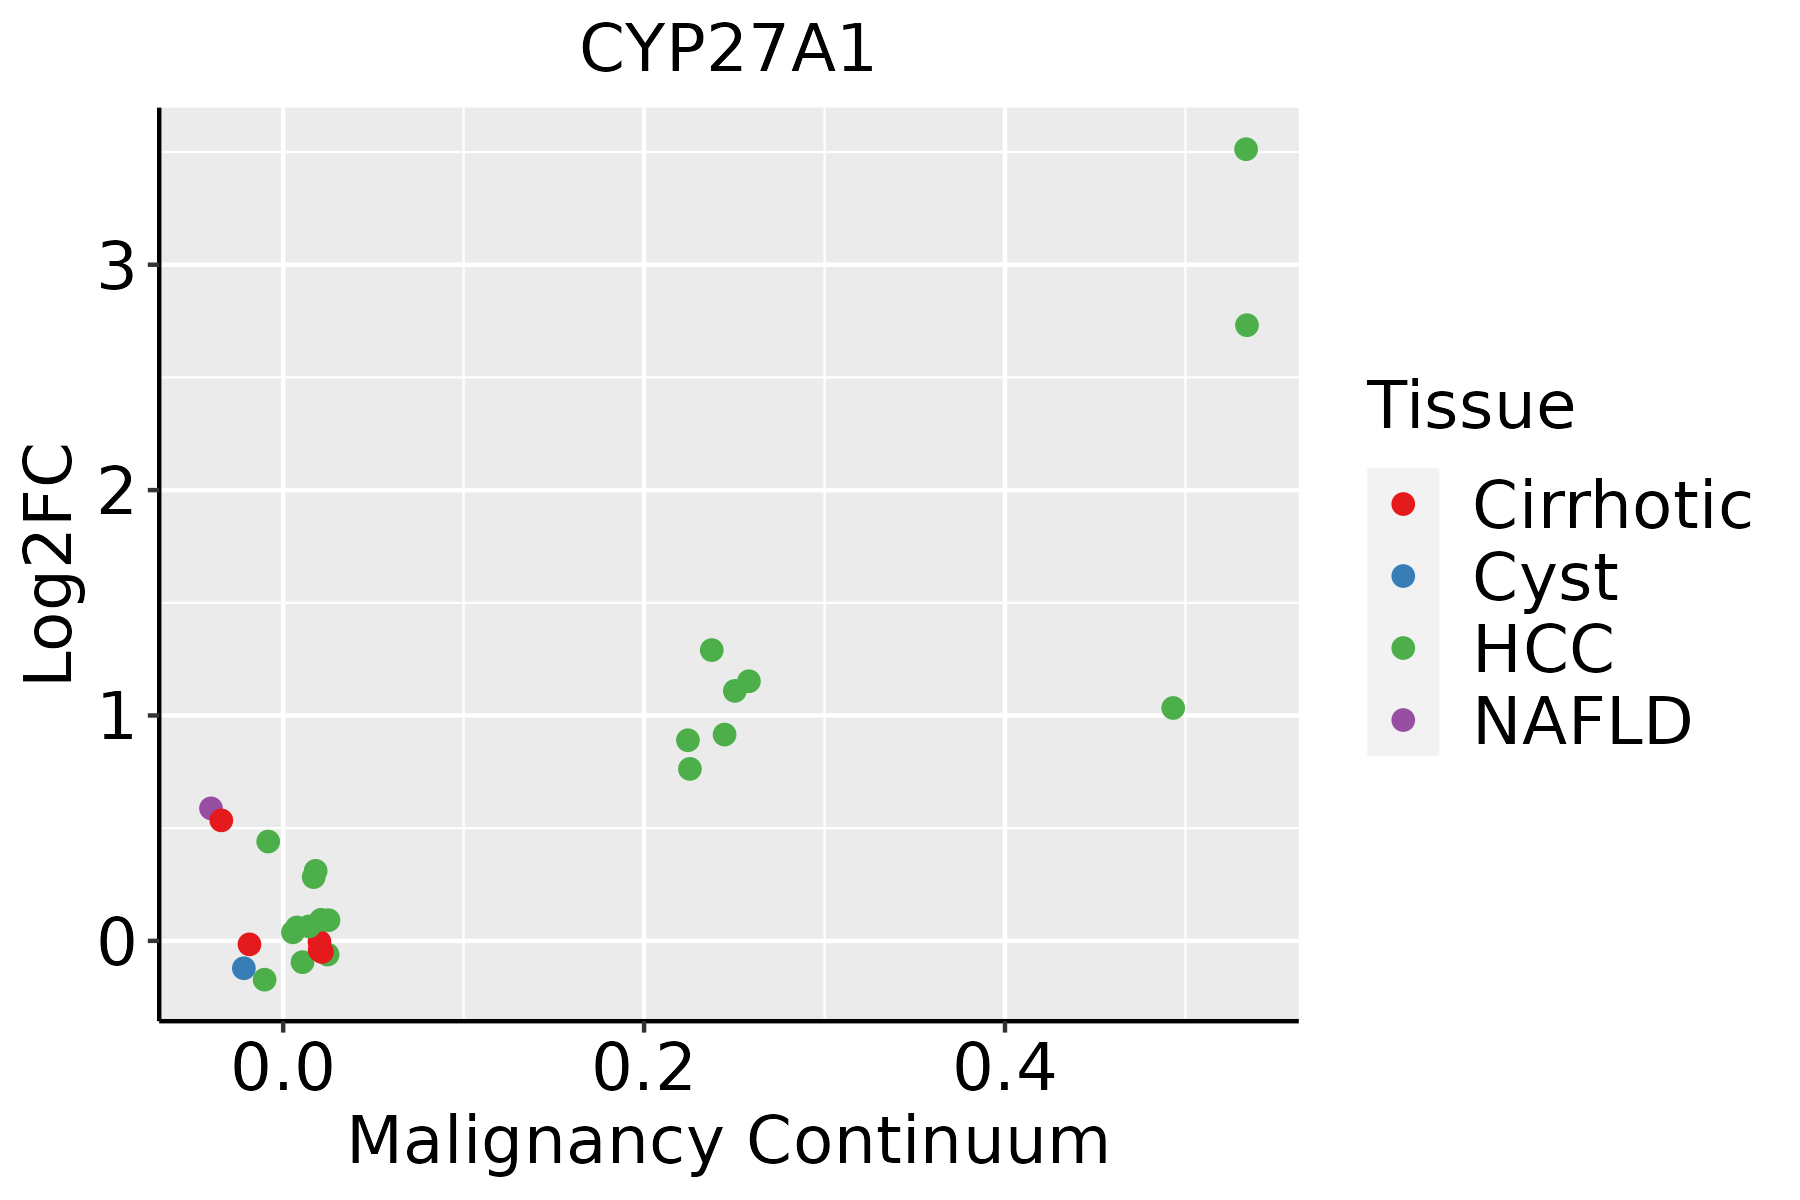 | HCC: Hepatocellular carcinoma |
| NAFLD: Non-alcoholic fatty liver disease | ||
| Oral Cavity | 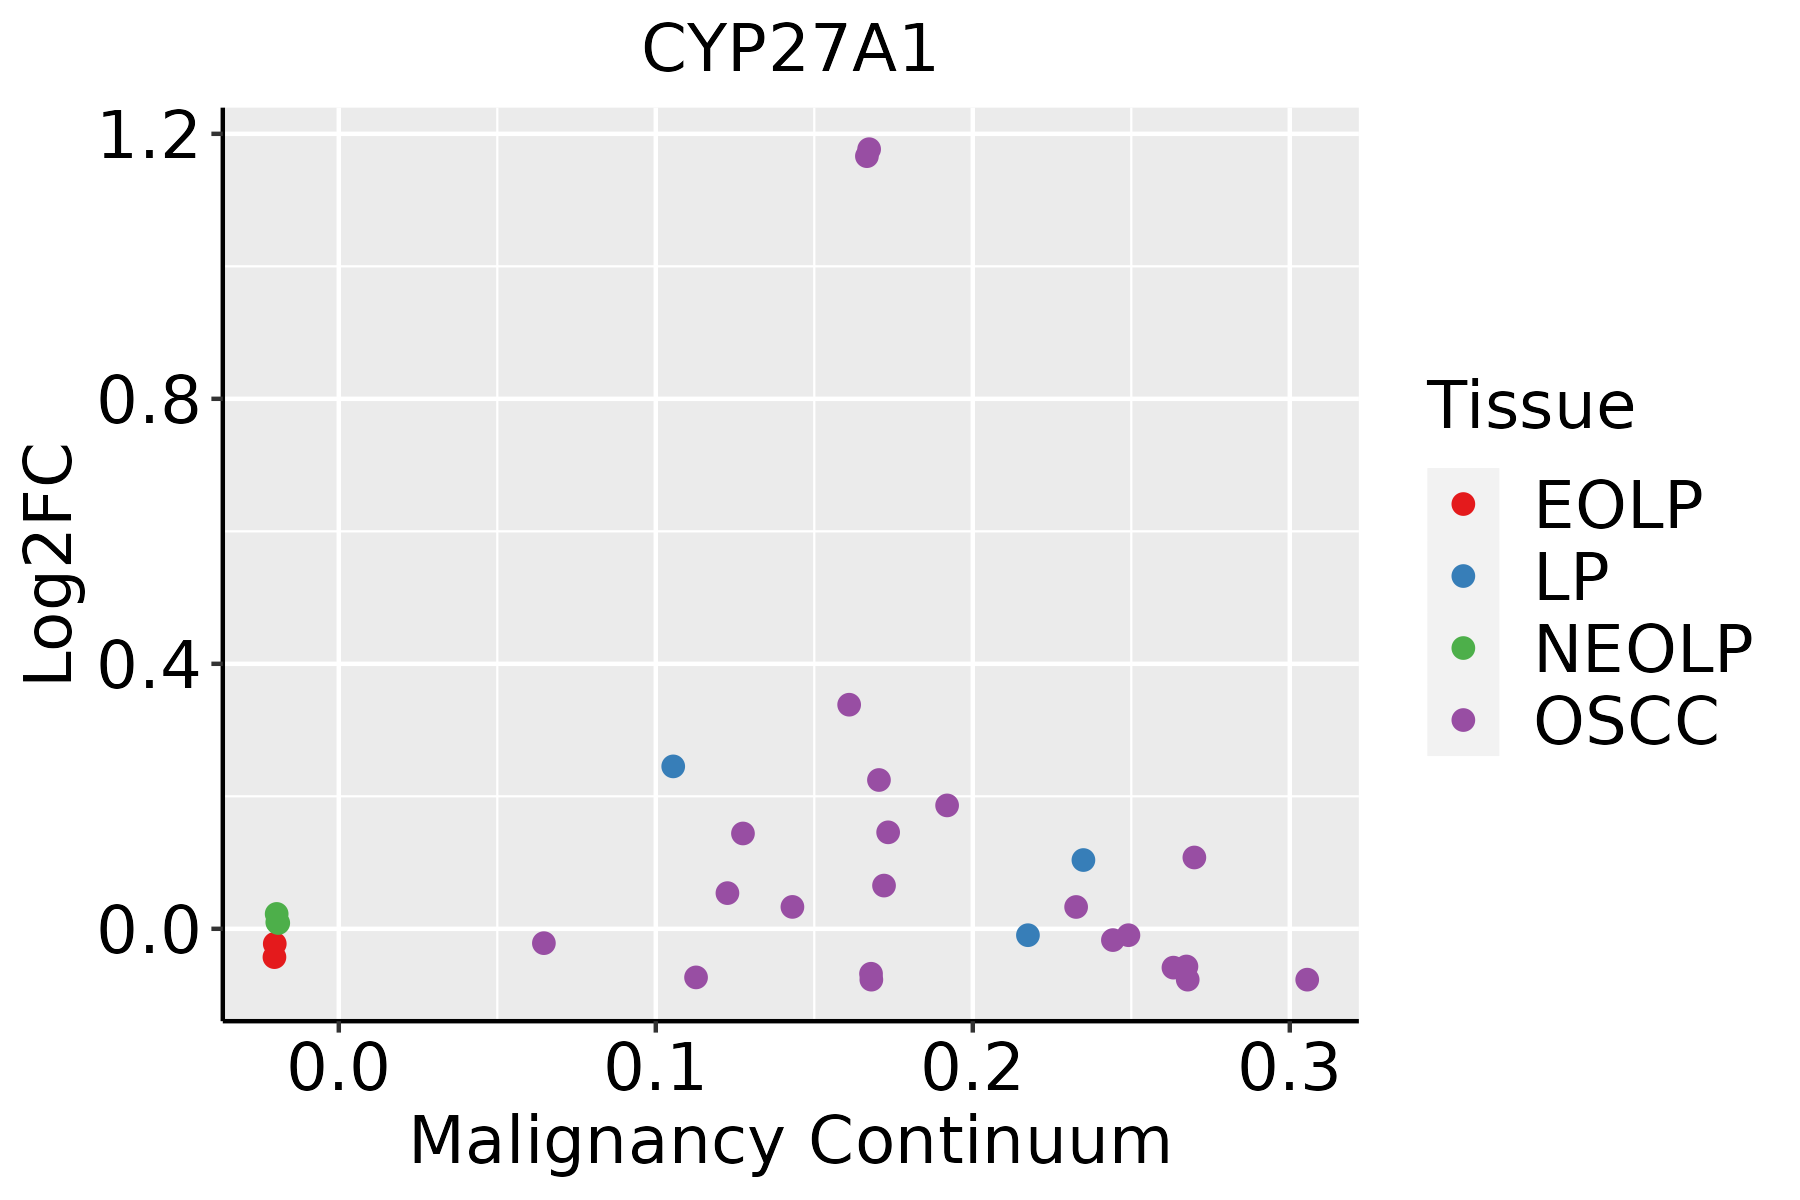 | EOLP: Erosive Oral lichen planus |
| LP: leukoplakia | ||
| NEOLP: Non-erosive oral lichen planus | ||
| OSCC: Oral squamous cell carcinoma |
| ∗log2FC in expression of this searched gene in stem-like cells from each diseased tissue sample relative to stem-like cells in normal samples in each tissue plotted against the malignancy continuum. Samples are colored based on if they are from different disease stage. |
Top |
Malignant transformation related pathway analysis |
| Find out the enriched GO biological processes and KEGG pathways involved in transition from healthy to precancer to cancer |
| Tissue | Disease Stage | Enriched GO biological Processes |
| Colorectum | AD |  |
| Colorectum | SER |  |
| Colorectum | MSS |  |
| Colorectum | MSI-H |  |
| Colorectum | FAP |  |
| ∗Top 15 enriched GO BP terms are showed in the bar plot of each disease state in each tissue. Each row represents a significant GO biological process which is colored according to the -log10(p.adjust). |
| Page: 1 2 3 4 5 6 7 8 9 |
| GO ID | Tissue | Disease Stage | Description | Gene Ratio | Bg Ratio | pvalue | p.adjust | Count |
| GO:1901361 | Colorectum | AD | organic cyclic compound catabolic process | 153/3918 | 495/18723 | 8.23e-08 | 4.18e-06 | 153 |
| GO:0044282 | Colorectum | AD | small molecule catabolic process | 118/3918 | 376/18723 | 1.05e-06 | 3.55e-05 | 118 |
| GO:0006066 | Colorectum | AD | alcohol metabolic process | 106/3918 | 353/18723 | 3.02e-05 | 5.57e-04 | 106 |
| GO:0016042 | Colorectum | AD | lipid catabolic process | 97/3918 | 320/18723 | 4.31e-05 | 7.56e-04 | 97 |
| GO:0046164 | Colorectum | AD | alcohol catabolic process | 20/3918 | 55/18723 | 6.03e-03 | 3.78e-02 | 20 |
| GO:0008202 | Colorectum | AD | steroid metabolic process | 85/3918 | 319/18723 | 8.07e-03 | 4.75e-02 | 85 |
| GO:00160421 | Colorectum | SER | lipid catabolic process | 77/2897 | 320/18723 | 3.52e-05 | 9.18e-04 | 77 |
| GO:00442821 | Colorectum | SER | small molecule catabolic process | 87/2897 | 376/18723 | 5.31e-05 | 1.27e-03 | 87 |
| GO:00060661 | Colorectum | SER | alcohol metabolic process | 79/2897 | 353/18723 | 3.50e-04 | 5.50e-03 | 79 |
| GO:19013611 | Colorectum | SER | organic cyclic compound catabolic process | 104/2897 | 495/18723 | 5.46e-04 | 7.63e-03 | 104 |
| GO:00461641 | Colorectum | SER | alcohol catabolic process | 17/2897 | 55/18723 | 3.00e-03 | 2.65e-02 | 17 |
| GO:19013612 | Colorectum | MSS | organic cyclic compound catabolic process | 148/3467 | 495/18723 | 3.47e-10 | 3.18e-08 | 148 |
| GO:00060662 | Colorectum | MSS | alcohol metabolic process | 92/3467 | 353/18723 | 2.57e-04 | 3.46e-03 | 92 |
| GO:00442822 | Colorectum | MSS | small molecule catabolic process | 94/3467 | 376/18723 | 9.85e-04 | 9.86e-03 | 94 |
| GO:0046394 | Colorectum | MSS | carboxylic acid biosynthetic process | 76/3467 | 314/18723 | 6.71e-03 | 4.38e-02 | 76 |
| GO:00160422 | Colorectum | MSS | lipid catabolic process | 77/3467 | 320/18723 | 7.43e-03 | 4.71e-02 | 77 |
| GO:0016053 | Colorectum | MSS | organic acid biosynthetic process | 76/3467 | 316/18723 | 7.88e-03 | 4.84e-02 | 76 |
| GO:190136118 | Esophagus | ESCC | organic cyclic compound catabolic process | 307/8552 | 495/18723 | 9.99e-14 | 4.80e-12 | 307 |
| GO:00060668 | Esophagus | ESCC | alcohol metabolic process | 202/8552 | 353/18723 | 7.32e-06 | 7.26e-05 | 202 |
| GO:00463948 | Esophagus | ESCC | carboxylic acid biosynthetic process | 175/8552 | 314/18723 | 1.98e-04 | 1.26e-03 | 175 |
| Page: 1 2 3 4 5 |
| Pathway ID | Tissue | Disease Stage | Description | Gene Ratio | Bg Ratio | pvalue | p.adjust | qvalue | Count |
| hsa049796 | Liver | NAFLD | Cholesterol metabolism | 20/1043 | 51/8465 | 9.73e-07 | 4.56e-05 | 3.67e-05 | 20 |
| hsa033206 | Liver | NAFLD | PPAR signaling pathway | 25/1043 | 75/8465 | 1.61e-06 | 6.62e-05 | 5.33e-05 | 25 |
| hsa00120 | Liver | NAFLD | Primary bile acid biosynthesis | 9/1043 | 17/8465 | 6.10e-05 | 1.33e-03 | 1.07e-03 | 9 |
| hsa0497911 | Liver | NAFLD | Cholesterol metabolism | 20/1043 | 51/8465 | 9.73e-07 | 4.56e-05 | 3.67e-05 | 20 |
| hsa0332011 | Liver | NAFLD | PPAR signaling pathway | 25/1043 | 75/8465 | 1.61e-06 | 6.62e-05 | 5.33e-05 | 25 |
| hsa001201 | Liver | NAFLD | Primary bile acid biosynthesis | 9/1043 | 17/8465 | 6.10e-05 | 1.33e-03 | 1.07e-03 | 9 |
| hsa049792 | Liver | Cirrhotic | Cholesterol metabolism | 30/2530 | 51/8465 | 1.59e-05 | 1.39e-04 | 8.60e-05 | 30 |
| hsa0332021 | Liver | Cirrhotic | PPAR signaling pathway | 32/2530 | 75/8465 | 1.24e-02 | 3.92e-02 | 2.42e-02 | 32 |
| hsa049793 | Liver | Cirrhotic | Cholesterol metabolism | 30/2530 | 51/8465 | 1.59e-05 | 1.39e-04 | 8.60e-05 | 30 |
| hsa0332031 | Liver | Cirrhotic | PPAR signaling pathway | 32/2530 | 75/8465 | 1.24e-02 | 3.92e-02 | 2.42e-02 | 32 |
| hsa049794 | Liver | HCC | Cholesterol metabolism | 41/4020 | 51/8465 | 1.33e-06 | 1.35e-05 | 7.49e-06 | 41 |
| hsa033204 | Liver | HCC | PPAR signaling pathway | 48/4020 | 75/8465 | 2.83e-03 | 9.37e-03 | 5.21e-03 | 48 |
| hsa001202 | Liver | HCC | Primary bile acid biosynthesis | 14/4020 | 17/8465 | 3.49e-03 | 1.12e-02 | 6.22e-03 | 14 |
| hsa049795 | Liver | HCC | Cholesterol metabolism | 41/4020 | 51/8465 | 1.33e-06 | 1.35e-05 | 7.49e-06 | 41 |
| hsa033205 | Liver | HCC | PPAR signaling pathway | 48/4020 | 75/8465 | 2.83e-03 | 9.37e-03 | 5.21e-03 | 48 |
| hsa001203 | Liver | HCC | Primary bile acid biosynthesis | 14/4020 | 17/8465 | 3.49e-03 | 1.12e-02 | 6.22e-03 | 14 |
| Page: 1 |
Top |
Cell-cell communication analysis |
| Identification of potential cell-cell interactions between two cell types and their ligand-receptor pairs for different disease states |
| Ligand | Receptor | LRpair | Pathway | Tissue | Disease Stage |
| Page: 1 |
Top |
Single-cell gene regulatory network inference analysis |
| Find out the significant the regulons (TFs) and the target genes of each regulon across cell types for different disease states |
| TF | Cell Type | Tissue | Disease Stage | Target Gene | RSS | Regulon Activity |
| ∗The dot plots of a searched regulon are shown for all cell subpopulations in each disease state of each tissue based on the regulon specific score inferred using pySCENIC and by calculating the average expression. |
| Page: 1 |
Top |
Somatic mutation of malignant transformation related genes |
| Annotation of somatic variants for genes involved in malignant transformation |
| Hugo Symbol | Variant Class | Variant Classification | dbSNP RS | HGVSc | HGVSp | HGVSp Short | SWISSPROT | BIOTYPE | SIFT | PolyPhen | Tumor Sample Barcode | Tissue | Histology | Sex | Age | Stage | Therapy Types | Drugs | Outcome |
| CYP27A1 | SNV | Missense_Mutation | c.874N>A | p.Asp292Asn | p.D292N | Q02318 | protein_coding | deleterious(0.04) | benign(0.027) | TCGA-A2-A0CM-01 | Breast | breast invasive carcinoma | Female | <65 | I/II | Chemotherapy | adriamycin | PD | |
| CYP27A1 | SNV | Missense_Mutation | c.119C>T | p.Ala40Val | p.A40V | Q02318 | protein_coding | tolerated(0.24) | benign(0.039) | TCGA-A2-A0YF-01 | Breast | breast invasive carcinoma | Female | >=65 | I/II | Unspecific | Arimidex | SD | |
| CYP27A1 | SNV | Missense_Mutation | rs371510438 | c.1556N>G | p.Asn519Ser | p.N519S | Q02318 | protein_coding | tolerated(0.4) | benign(0.015) | TCGA-E2-A1LL-01 | Breast | breast invasive carcinoma | Female | >=65 | III/IV | Chemotherapy | docetaxel | PD |
| CYP27A1 | insertion | In_Frame_Ins | novel | c.965_966insCTGGACATTAATCTTGCTTATGGAAAGTATGTT | p.Pro322_Arg323insTrpThrLeuIleLeuLeuMetGluSerMetPhe | p.P322_R323insWTLILLMESMF | Q02318 | protein_coding | TCGA-A2-A0D1-01 | Breast | breast invasive carcinoma | Female | >=65 | I/II | Chemotherapy | taxotere | SD | ||
| CYP27A1 | insertion | Nonsense_Mutation | novel | c.811_812insTCTAAGATTCTGTCACTTGAGATTTTGGTGATTCTATAATTCTAA | p.Tyr271delinsPheTerAspSerValThrTerAspPheGlyAspSerIleIleLeuAsn | p.Y271delinsF*DSVT*DFGDSIILN | Q02318 | protein_coding | TCGA-B6-A0RE-01 | Breast | breast invasive carcinoma | Female | <65 | I/II | Unknown | Unknown | SD | ||
| CYP27A1 | deletion | Frame_Shift_Del | c.1180delC | p.Leu394CysfsTer14 | p.L394Cfs*14 | Q02318 | protein_coding | TCGA-D8-A27V-01 | Breast | breast invasive carcinoma | Female | <65 | I/II | Hormone Therapy | tamoxiphen | SD | |||
| CYP27A1 | SNV | Missense_Mutation | novel | c.611A>G | p.Asp204Gly | p.D204G | Q02318 | protein_coding | tolerated(0.06) | benign(0.12) | TCGA-2W-A8YY-01 | Cervix | cervical & endocervical cancer | Female | <65 | I/II | Chemotherapy | cisplatin | CR |
| CYP27A1 | SNV | Missense_Mutation | c.385N>A | p.Asp129Asn | p.D129N | Q02318 | protein_coding | deleterious(0.04) | benign(0.354) | TCGA-FU-A3HZ-01 | Cervix | cervical & endocervical cancer | Female | <65 | I/II | Chemotherapy | cisplatin | CR | |
| CYP27A1 | SNV | Missense_Mutation | novel | c.1240N>C | p.Asp414His | p.D414H | Q02318 | protein_coding | deleterious(0) | possibly_damaging(0.806) | TCGA-JW-A5VL-01 | Cervix | cervical & endocervical cancer | Female | <65 | I/II | Unknown | Unknown | SD |
| CYP27A1 | SNV | Missense_Mutation | novel | c.1517N>T | p.Gly506Val | p.G506V | Q02318 | protein_coding | tolerated(0.13) | benign(0.139) | TCGA-JW-A852-01 | Cervix | cervical & endocervical cancer | Female | <65 | I/II | Unknown | Unknown | PD |
| Page: 1 2 3 4 5 6 |
Top |
Related drugs of malignant transformation related genes |
| Identification of chemicals and drugs interact with genes involved in malignant transfromation |
| (DGIdb 4.0) |
| Entrez ID | Symbol | Category | Interaction Types | Drug Claim Name | Drug Name | PMIDs |
| 1593 | CYP27A1 | DRUGGABLE GENOME, ENZYME, CYTOCHROME P450 | HORMONES | 12597773 | ||
| 1593 | CYP27A1 | DRUGGABLE GENOME, ENZYME, CYTOCHROME P450 | inhibitor | 252827509 | ||
| 1593 | CYP27A1 | DRUGGABLE GENOME, ENZYME, CYTOCHROME P450 | URSODEOXYCHOLIC ACID | 12011083 | ||
| 1593 | CYP27A1 | DRUGGABLE GENOME, ENZYME, CYTOCHROME P450 | inhibitor | 252827515 | CHEMBL255088 | |
| 1593 | CYP27A1 | DRUGGABLE GENOME, ENZYME, CYTOCHROME P450 | RETINOID | 15340076 | ||
| 1593 | CYP27A1 | DRUGGABLE GENOME, ENZYME, CYTOCHROME P450 | PHYTOSTEROLS | 11398149 | ||
| 1593 | CYP27A1 | DRUGGABLE GENOME, ENZYME, CYTOCHROME P450 | cholic acid | |||
| 1593 | CYP27A1 | DRUGGABLE GENOME, ENZYME, CYTOCHROME P450 | CHOLESTYRAMINE | CHOLESTYRAMINE | 12011083 |
| Page: 1 |

Copyright 2023-Present -The University of Texas Health Science Center at Houston |