
|
|||||
|
 | |
| |
| |
| |
| |
| |
|
Gene: CYP17A1 |
Gene summary for CYP17A1 |
| Gene information | Species | Human | Gene symbol | CYP17A1 | Gene ID | 1586 |
| Gene name | cytochrome P450 family 17 subfamily A member 1 | |
| Gene Alias | CPT7 | |
| Cytomap | 10q24.32 | |
| Gene Type | protein-coding | GO ID | GO:0000003 | UniProtAcc | P05093 |
Top |
Malignant transformation analysis |
| Identification of the aberrant gene expression in precancerous and cancerous lesions by comparing the gene expression of stem-like cells in diseased tissues with normal stem cells |
| Entrez ID | Symbol | Replicates | Species | Organ | Tissue | Adj P-value | Log2FC | Malignancy |
| 1586 | CYP17A1 | HCC2 | Human | Liver | HCC | 1.60e-67 | 6.54e+00 | 0.5341 |
| 1586 | CYP17A1 | S014 | Human | Liver | HCC | 9.63e-21 | 1.27e+00 | 0.2254 |
| 1586 | CYP17A1 | S015 | Human | Liver | HCC | 4.07e-20 | 1.01e+00 | 0.2375 |
| 1586 | CYP17A1 | S016 | Human | Liver | HCC | 3.32e-31 | 1.11e+00 | 0.2243 |
| Page: 1 |
| Tissue | Expression Dynamics | Abbreviation |
| Liver | 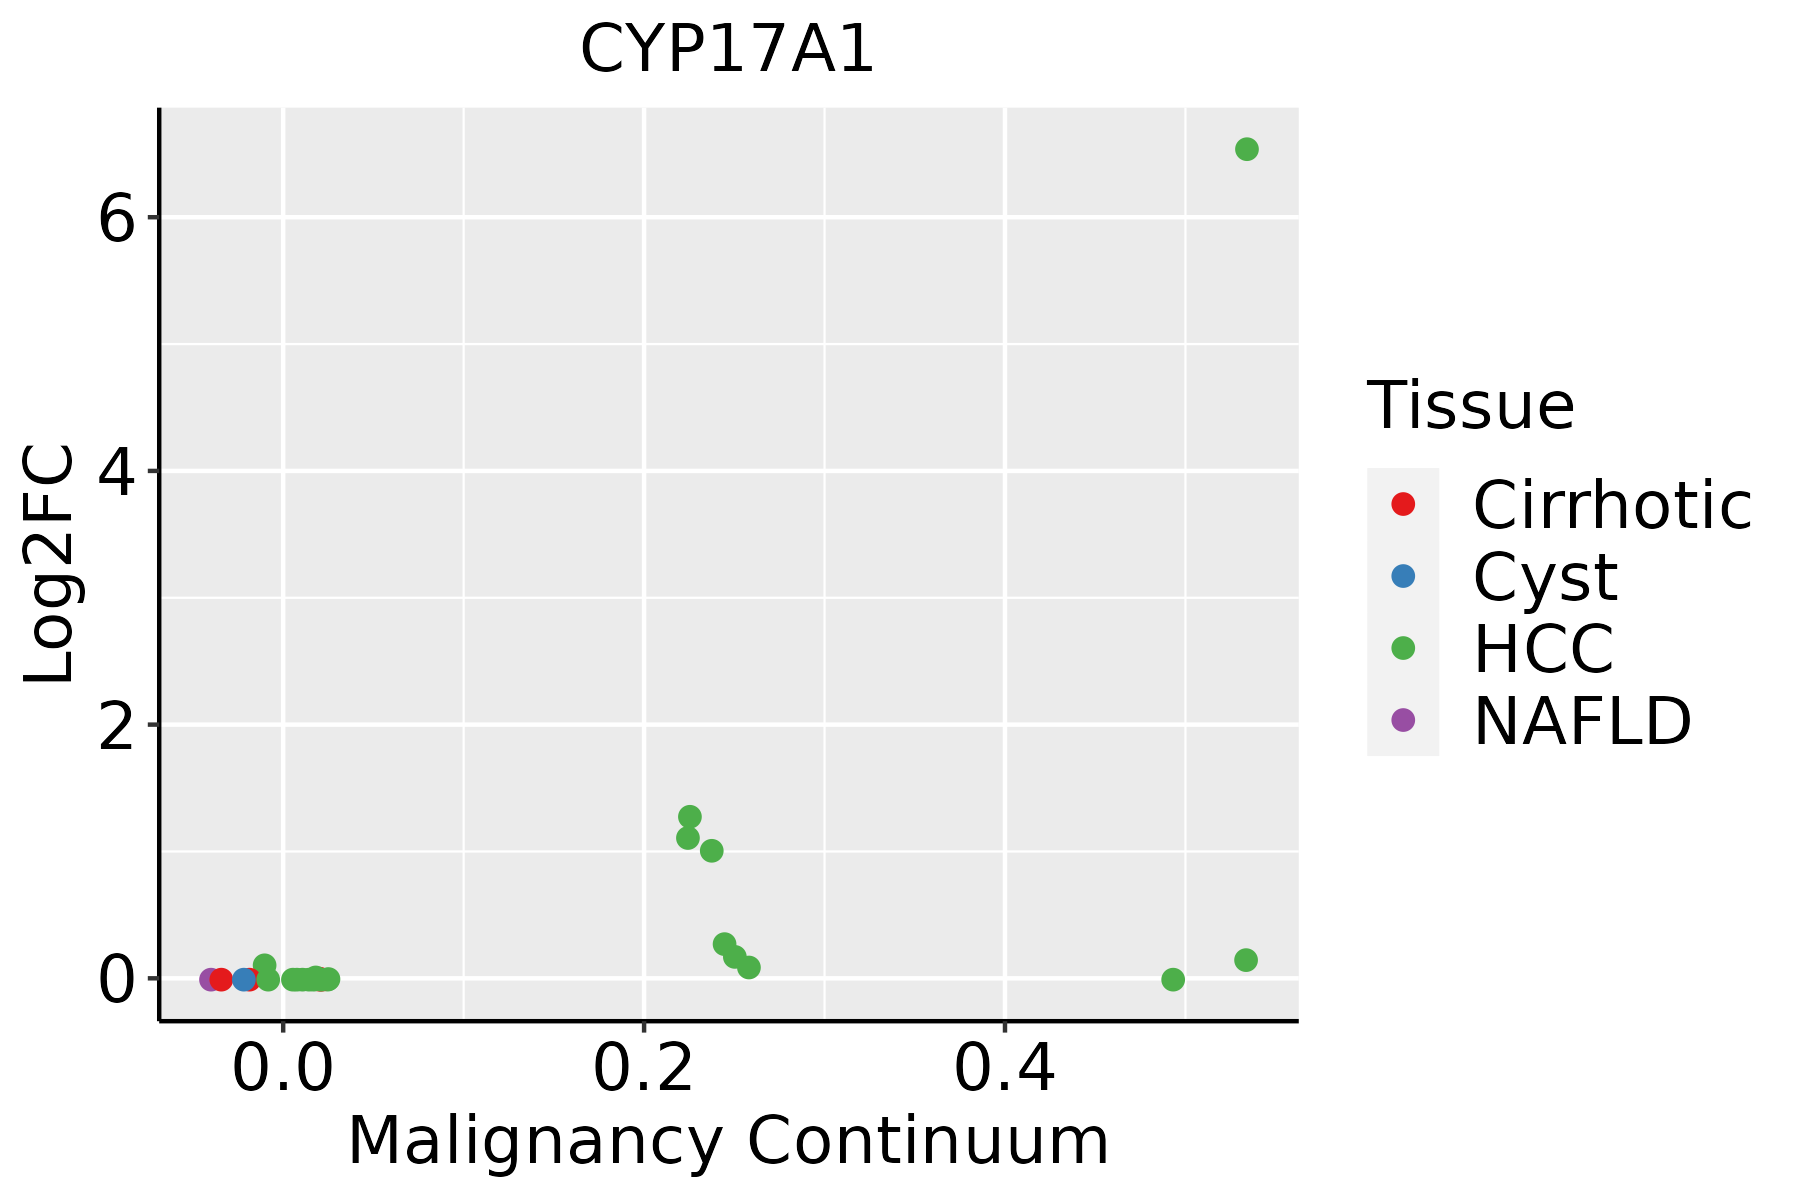 | HCC: Hepatocellular carcinoma |
| NAFLD: Non-alcoholic fatty liver disease |
| ∗log2FC in expression of this searched gene in stem-like cells from each diseased tissue sample relative to stem-like cells in normal samples in each tissue plotted against the malignancy continuum. Samples are colored based on if they are from different disease stage. |
Top |
Malignant transformation related pathway analysis |
| Find out the enriched GO biological processes and KEGG pathways involved in transition from healthy to precancer to cancer |
| Tissue | Disease Stage | Enriched GO biological Processes |
| Colorectum | AD |  |
| Colorectum | SER |  |
| Colorectum | MSS |  |
| Colorectum | MSI-H |  |
| Colorectum | FAP |  |
| ∗Top 15 enriched GO BP terms are showed in the bar plot of each disease state in each tissue. Each row represents a significant GO biological process which is colored according to the -log10(p.adjust). |
| Page: 1 2 3 4 5 6 7 8 9 |
| GO ID | Tissue | Disease Stage | Description | Gene Ratio | Bg Ratio | pvalue | p.adjust | Count |
| GO:00082022 | Liver | HCC | steroid metabolic process | 188/7958 | 319/18723 | 1.96e-09 | 5.63e-08 | 188 |
| GO:00066942 | Liver | HCC | steroid biosynthetic process | 104/7958 | 173/18723 | 2.13e-06 | 2.91e-05 | 104 |
| GO:004218021 | Liver | HCC | cellular ketone metabolic process | 123/7958 | 211/18723 | 2.52e-06 | 3.37e-05 | 123 |
| GO:00082091 | Liver | HCC | androgen metabolic process | 21/7958 | 30/18723 | 2.15e-03 | 1.08e-02 | 21 |
| Page: 1 |
| Pathway ID | Tissue | Disease Stage | Description | Gene Ratio | Bg Ratio | pvalue | p.adjust | qvalue | Count |
| hsa04917 | Liver | HCC | Prolactin signaling pathway | 43/4020 | 70/8465 | 1.30e-02 | 3.19e-02 | 1.78e-02 | 43 |
| hsa049171 | Liver | HCC | Prolactin signaling pathway | 43/4020 | 70/8465 | 1.30e-02 | 3.19e-02 | 1.78e-02 | 43 |
| Page: 1 |
Top |
Cell-cell communication analysis |
| Identification of potential cell-cell interactions between two cell types and their ligand-receptor pairs for different disease states |
| Ligand | Receptor | LRpair | Pathway | Tissue | Disease Stage |
| Page: 1 |
Top |
Single-cell gene regulatory network inference analysis |
| Find out the significant the regulons (TFs) and the target genes of each regulon across cell types for different disease states |
| TF | Cell Type | Tissue | Disease Stage | Target Gene | RSS | Regulon Activity |
| ∗The dot plots of a searched regulon are shown for all cell subpopulations in each disease state of each tissue based on the regulon specific score inferred using pySCENIC and by calculating the average expression. |
| Page: 1 |
Top |
Somatic mutation of malignant transformation related genes |
| Annotation of somatic variants for genes involved in malignant transformation |
| Hugo Symbol | Variant Class | Variant Classification | dbSNP RS | HGVSc | HGVSp | HGVSp Short | SWISSPROT | BIOTYPE | SIFT | PolyPhen | Tumor Sample Barcode | Tissue | Histology | Sex | Age | Stage | Therapy Types | Drugs | Outcome |
| CYP17A1 | SNV | Missense_Mutation | novel | c.1220A>C | p.His407Pro | p.H407P | P05093 | protein_coding | tolerated(0.12) | benign(0.334) | TCGA-A2-A1G4-01 | Breast | breast invasive carcinoma | Female | >=65 | III/IV | Chemotherapy | adriamycin | SD |
| CYP17A1 | SNV | Missense_Mutation | c.1463N>A | p.Ser488Tyr | p.S488Y | P05093 | protein_coding | deleterious(0) | possibly_damaging(0.722) | TCGA-BH-A0BT-01 | Breast | breast invasive carcinoma | Female | <65 | I/II | Chemotherapy | adriamycin | CR | |
| CYP17A1 | SNV | Missense_Mutation | c.151A>G | p.Asn51Asp | p.N51D | P05093 | protein_coding | deleterious(0.02) | benign(0.012) | TCGA-BH-A18G-01 | Breast | breast invasive carcinoma | Female | >=65 | I/II | Unknown | Unknown | SD | |
| CYP17A1 | SNV | Missense_Mutation | c.1046N>A | p.Arg349His | p.R349H | P05093 | protein_coding | tolerated(0.61) | benign(0.003) | TCGA-EK-A2RO-01 | Cervix | cervical & endocervical cancer | Female | <65 | I/II | Unknown | Unknown | SD | |
| CYP17A1 | SNV | Missense_Mutation | c.59N>A | p.Arg20Lys | p.R20K | P05093 | protein_coding | tolerated(0.94) | benign(0.01) | TCGA-IR-A3LK-01 | Cervix | cervical & endocervical cancer | Female | >=65 | I/II | Chemotherapy | cisplatin | PD | |
| CYP17A1 | SNV | Missense_Mutation | c.1486N>T | p.Arg496Cys | p.R496C | P05093 | protein_coding | deleterious(0) | probably_damaging(1) | TCGA-A6-5665-01 | Colorectum | colon adenocarcinoma | Female | >=65 | I/II | Unknown | Unknown | PD | |
| CYP17A1 | SNV | Missense_Mutation | rs104894154 | c.374N>A | p.Arg125Gln | p.R125Q | P05093 | protein_coding | deleterious(0) | probably_damaging(0.997) | TCGA-AA-3510-01 | Colorectum | colon adenocarcinoma | Male | >=65 | I/II | Unknown | Unknown | SD |
| CYP17A1 | SNV | Missense_Mutation | novel | c.602N>G | p.Tyr201Cys | p.Y201C | P05093 | protein_coding | deleterious(0.03) | probably_damaging(0.992) | TCGA-AA-3949-01 | Colorectum | colon adenocarcinoma | Female | >=65 | III/IV | Unknown | Unknown | SD |
| CYP17A1 | SNV | Missense_Mutation | c.40N>C | p.Tyr14His | p.Y14H | P05093 | protein_coding | deleterious(0.02) | probably_damaging(0.936) | TCGA-AA-A010-01 | Colorectum | colon adenocarcinoma | Female | <65 | I/II | Chemotherapy | folinic | CR | |
| CYP17A1 | SNV | Missense_Mutation | rs371825363 | c.1345N>T | p.Arg449Cys | p.R449C | P05093 | protein_coding | deleterious(0) | probably_damaging(1) | TCGA-CM-6171-01 | Colorectum | colon adenocarcinoma | Female | >=65 | I/II | Unknown | Unknown | SD |
| Page: 1 2 3 4 5 6 |
Top |
Related drugs of malignant transformation related genes |
| Identification of chemicals and drugs interact with genes involved in malignant transfromation |
| (DGIdb 4.0) |
| Entrez ID | Symbol | Category | Interaction Types | Drug Claim Name | Drug Name | PMIDs |
| 1586 | CYP17A1 | DRUGGABLE GENOME, CYTOCHROME P450, ENZYME, CLINICALLY ACTIONABLE | inhibitor | 252166838 | GALETERONE | |
| 1586 | CYP17A1 | DRUGGABLE GENOME, CYTOCHROME P450, ENZYME, CLINICALLY ACTIONABLE | glucocorticoids | 25157341 | ||
| 1586 | CYP17A1 | DRUGGABLE GENOME, CYTOCHROME P450, ENZYME, CLINICALLY ACTIONABLE | TAK-700 | ORTERONEL | ||
| 1586 | CYP17A1 | DRUGGABLE GENOME, CYTOCHROME P450, ENZYME, CLINICALLY ACTIONABLE | GALETERONE | GALETERONE | ||
| 1586 | CYP17A1 | DRUGGABLE GENOME, CYTOCHROME P450, ENZYME, CLINICALLY ACTIONABLE | ORTERONEL | ORTERONEL | ||
| 1586 | CYP17A1 | DRUGGABLE GENOME, CYTOCHROME P450, ENZYME, CLINICALLY ACTIONABLE | inhibitor | CHEMBL271227 | ABIRATERONE ACETATE | |
| 1586 | CYP17A1 | DRUGGABLE GENOME, CYTOCHROME P450, ENZYME, CLINICALLY ACTIONABLE | inhibitor | 178103356 | ABIRATERONE | |
| 1586 | CYP17A1 | DRUGGABLE GENOME, CYTOCHROME P450, ENZYME, CLINICALLY ACTIONABLE | ABIRATERONE | ABIRATERONE | ||
| 1586 | CYP17A1 | DRUGGABLE GENOME, CYTOCHROME P450, ENZYME, CLINICALLY ACTIONABLE | inhibitor | ORTERONEL | ORTERONEL | |
| 1586 | CYP17A1 | DRUGGABLE GENOME, CYTOCHROME P450, ENZYME, CLINICALLY ACTIONABLE | CFG920 | CFG-920 |
| Page: 1 2 |

Copyright 2023-Present -The University of Texas Health Science Center at Houston |