
|
|||||
|
 | |
| |
| |
| |
| |
| |
|
Gene: CYHR1 |
Gene summary for CYHR1 |
| Gene information | Species | Human | Gene symbol | CYHR1 | Gene ID | 50626 |
| Gene name | cysteine and histidine rich 1 | |
| Gene Alias | CHRP | |
| Cytomap | 8q24.3 | |
| Gene Type | protein-coding | GO ID | GO:0005575 | UniProtAcc | Q6ZMK1 |
Top |
Malignant transformation analysis |
| Identification of the aberrant gene expression in precancerous and cancerous lesions by comparing the gene expression of stem-like cells in diseased tissues with normal stem cells |
| Entrez ID | Symbol | Replicates | Species | Organ | Tissue | Adj P-value | Log2FC | Malignancy |
| 50626 | CYHR1 | GSM4909281 | Human | Breast | IDC | 3.60e-30 | 6.73e-01 | 0.21 |
| 50626 | CYHR1 | GSM4909293 | Human | Breast | IDC | 1.73e-06 | 3.23e-01 | 0.1581 |
| 50626 | CYHR1 | GSM4909296 | Human | Breast | IDC | 4.87e-04 | 1.73e-01 | 0.1524 |
| 50626 | CYHR1 | GSM4909298 | Human | Breast | IDC | 2.25e-02 | 2.02e-01 | 0.1551 |
| 50626 | CYHR1 | GSM4909302 | Human | Breast | IDC | 1.37e-10 | 5.11e-01 | 0.1545 |
| 50626 | CYHR1 | GSM4909304 | Human | Breast | IDC | 4.17e-17 | 4.89e-01 | 0.1636 |
| 50626 | CYHR1 | GSM4909305 | Human | Breast | IDC | 1.96e-03 | 3.39e-01 | 0.0436 |
| 50626 | CYHR1 | GSM4909306 | Human | Breast | IDC | 3.79e-24 | 6.15e-01 | 0.1564 |
| 50626 | CYHR1 | GSM4909307 | Human | Breast | IDC | 1.30e-05 | 3.47e-01 | 0.1569 |
| 50626 | CYHR1 | GSM4909308 | Human | Breast | IDC | 2.89e-13 | 4.26e-01 | 0.158 |
| 50626 | CYHR1 | GSM4909309 | Human | Breast | IDC | 3.71e-02 | 3.19e-01 | 0.0483 |
| 50626 | CYHR1 | GSM4909311 | Human | Breast | IDC | 1.59e-13 | 9.88e-02 | 0.1534 |
| 50626 | CYHR1 | GSM4909312 | Human | Breast | IDC | 2.34e-07 | 2.40e-01 | 0.1552 |
| 50626 | CYHR1 | GSM4909317 | Human | Breast | IDC | 1.20e-15 | 4.89e-01 | 0.1355 |
| 50626 | CYHR1 | GSM4909319 | Human | Breast | IDC | 3.22e-25 | 2.87e-01 | 0.1563 |
| 50626 | CYHR1 | GSM4909321 | Human | Breast | IDC | 1.41e-06 | 1.24e-01 | 0.1559 |
| 50626 | CYHR1 | M1 | Human | Breast | IDC | 2.07e-03 | 2.76e-01 | 0.1577 |
| 50626 | CYHR1 | NCCBC5 | Human | Breast | DCIS | 3.36e-02 | -6.70e-02 | 0.2046 |
| 50626 | CYHR1 | DCIS2 | Human | Breast | DCIS | 1.87e-60 | 1.80e-01 | 0.0085 |
| 50626 | CYHR1 | LZE4T | Human | Esophagus | ESCC | 5.94e-10 | 4.39e-01 | 0.0811 |
| Page: 1 2 3 4 5 6 7 |
| Tissue | Expression Dynamics | Abbreviation |
| Breast |  | IDC: Invasive ductal carcinoma |
| DCIS: Ductal carcinoma in situ | ||
| Precancer(BRCA1-mut): Precancerous lesion from BRCA1 mutation carriers | ||
| Esophagus | 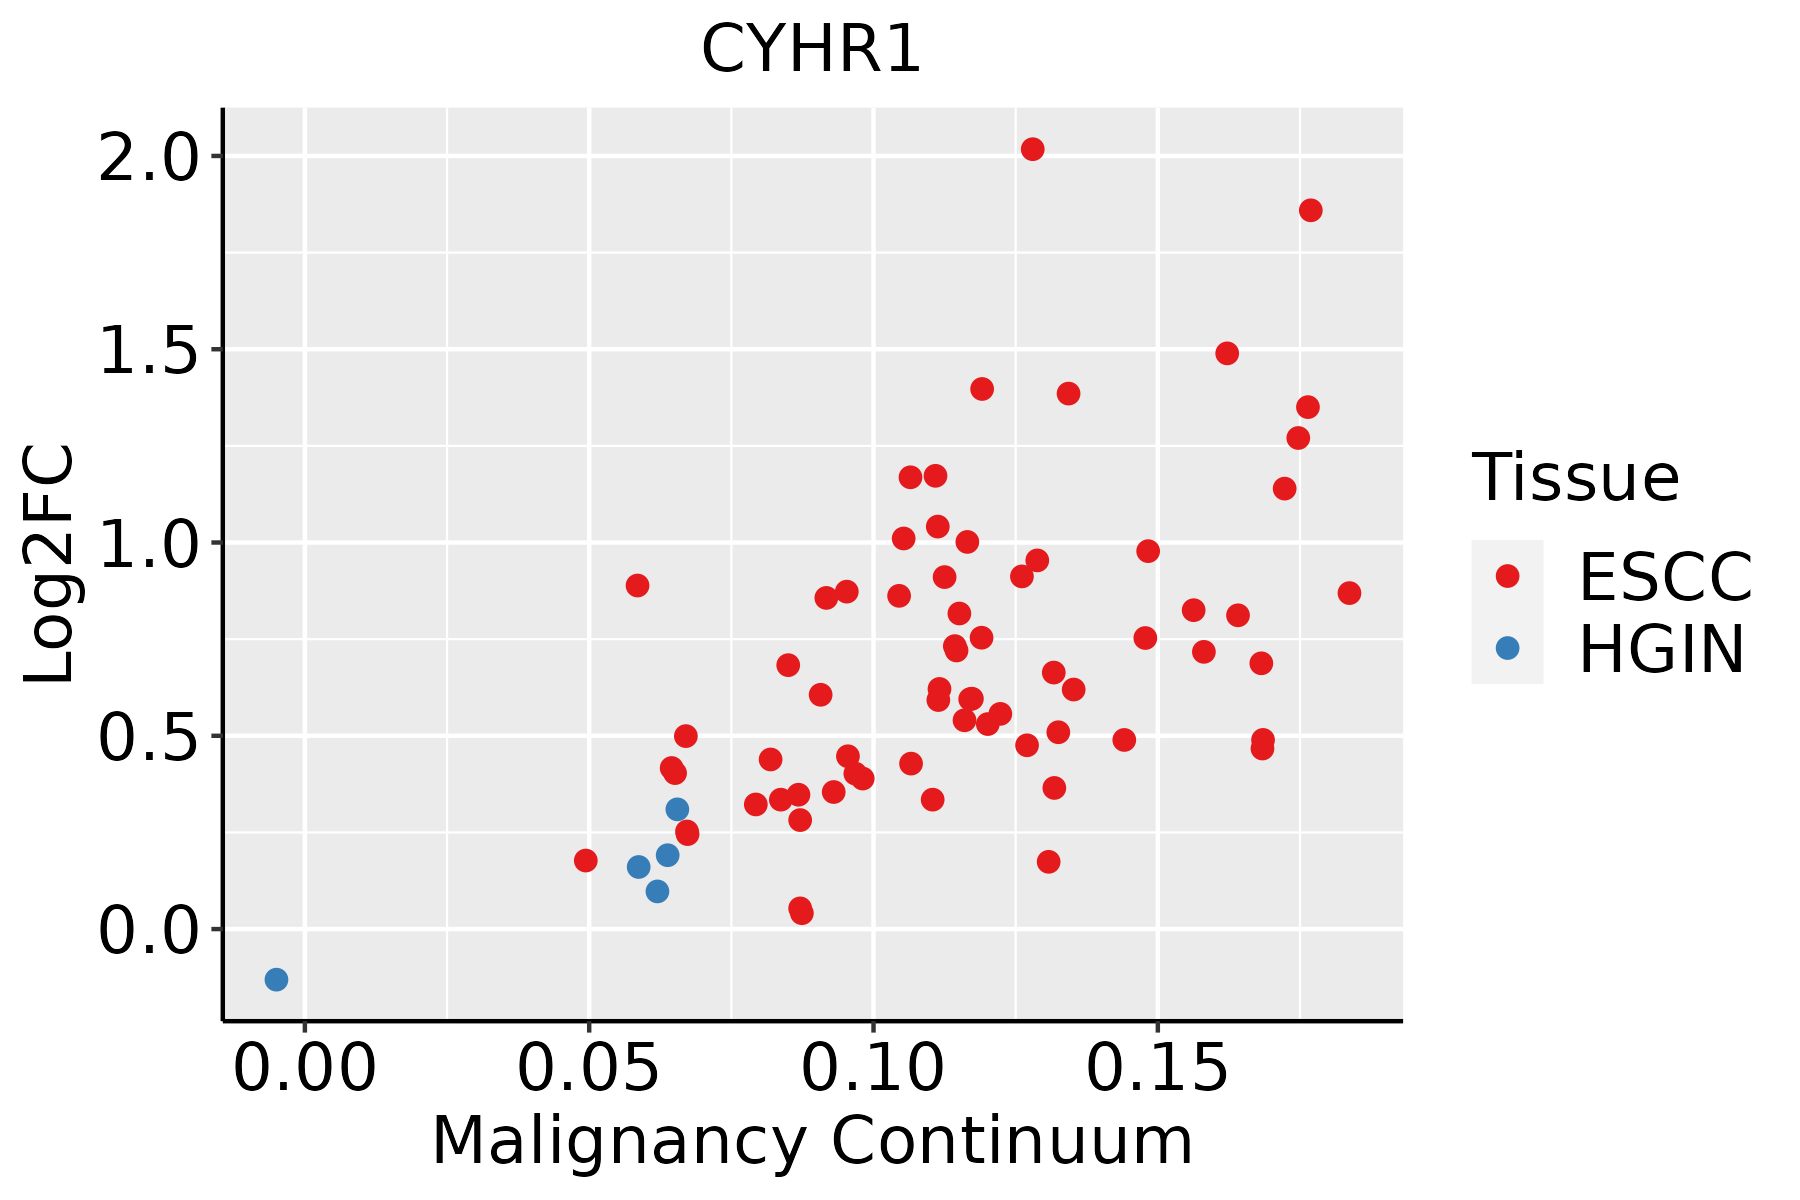 | ESCC: Esophageal squamous cell carcinoma |
| HGIN: High-grade intraepithelial neoplasias | ||
| LGIN: Low-grade intraepithelial neoplasias | ||
| Liver | 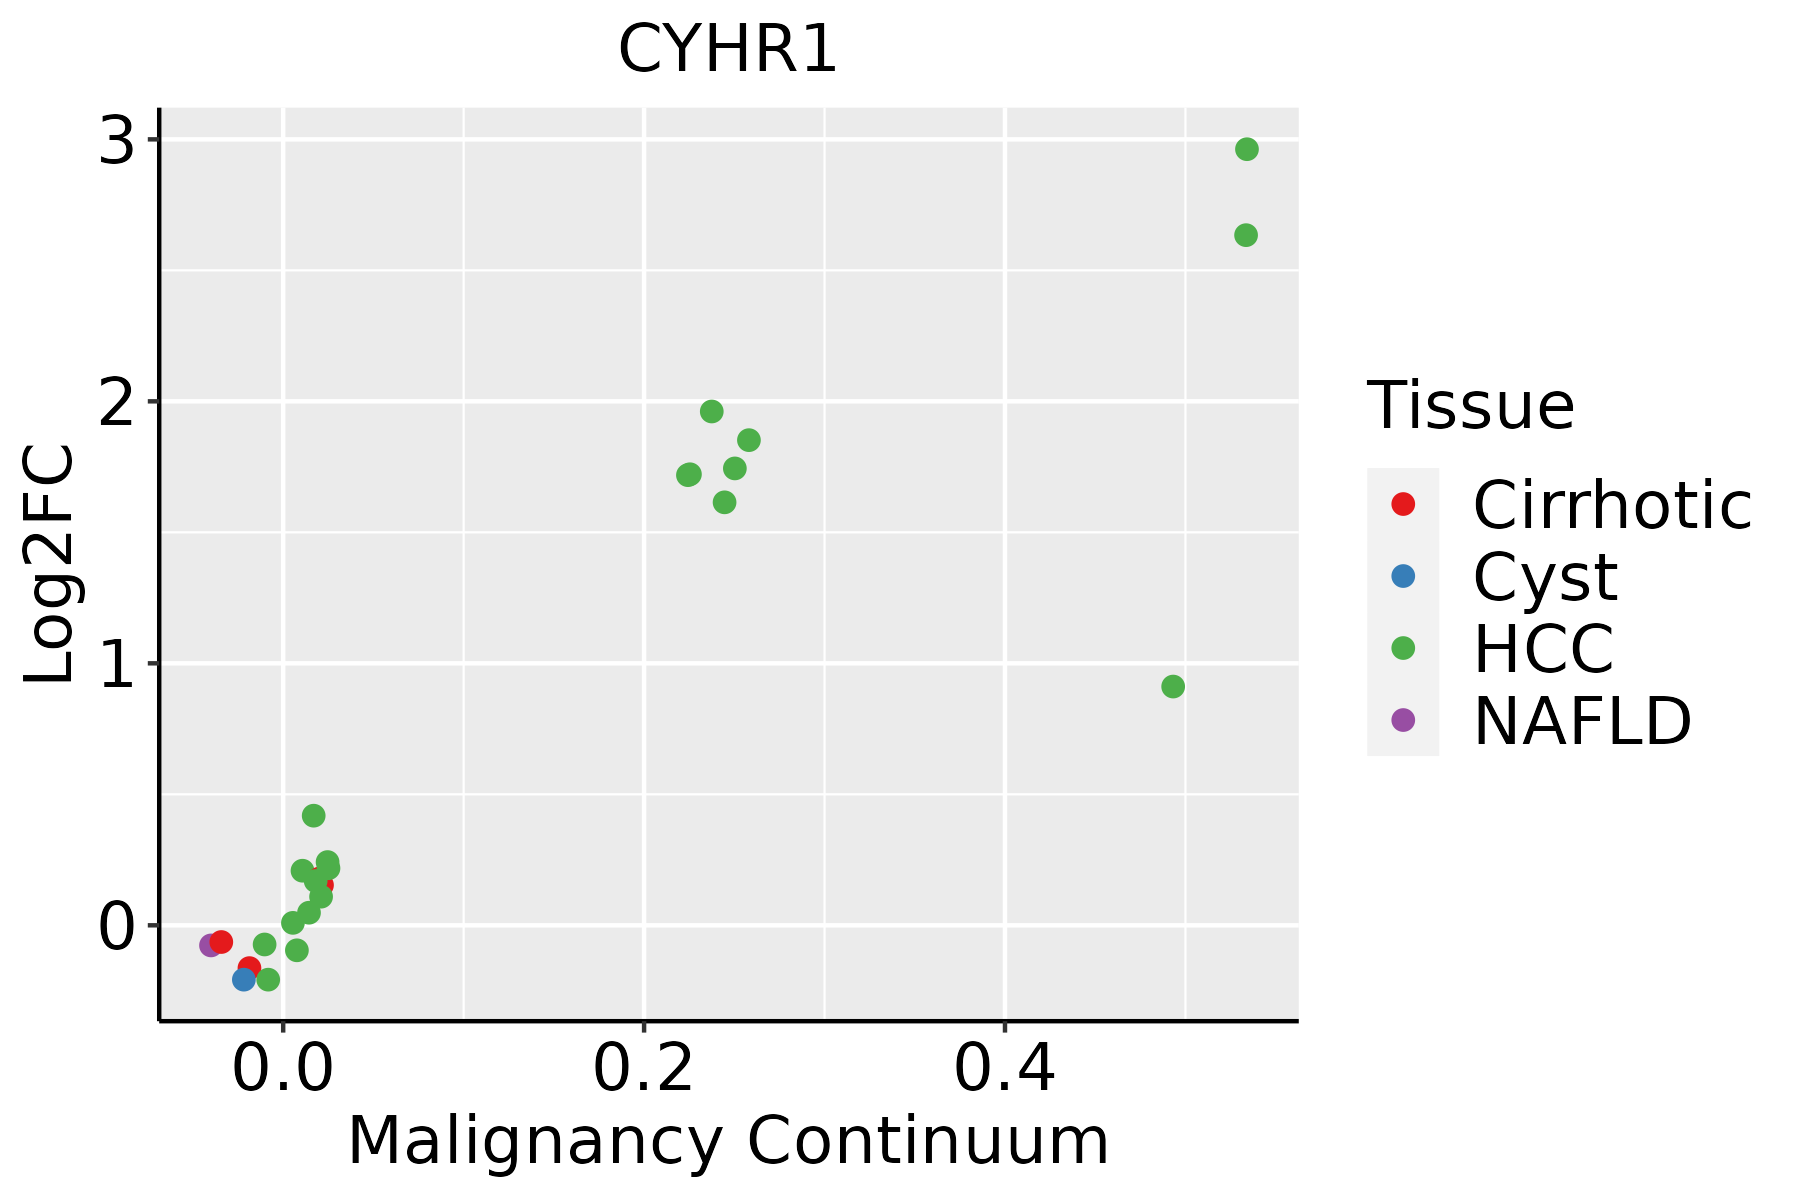 | HCC: Hepatocellular carcinoma |
| NAFLD: Non-alcoholic fatty liver disease | ||
| Oral Cavity |  | EOLP: Erosive Oral lichen planus |
| LP: leukoplakia | ||
| NEOLP: Non-erosive oral lichen planus | ||
| OSCC: Oral squamous cell carcinoma | ||
| Prostate | 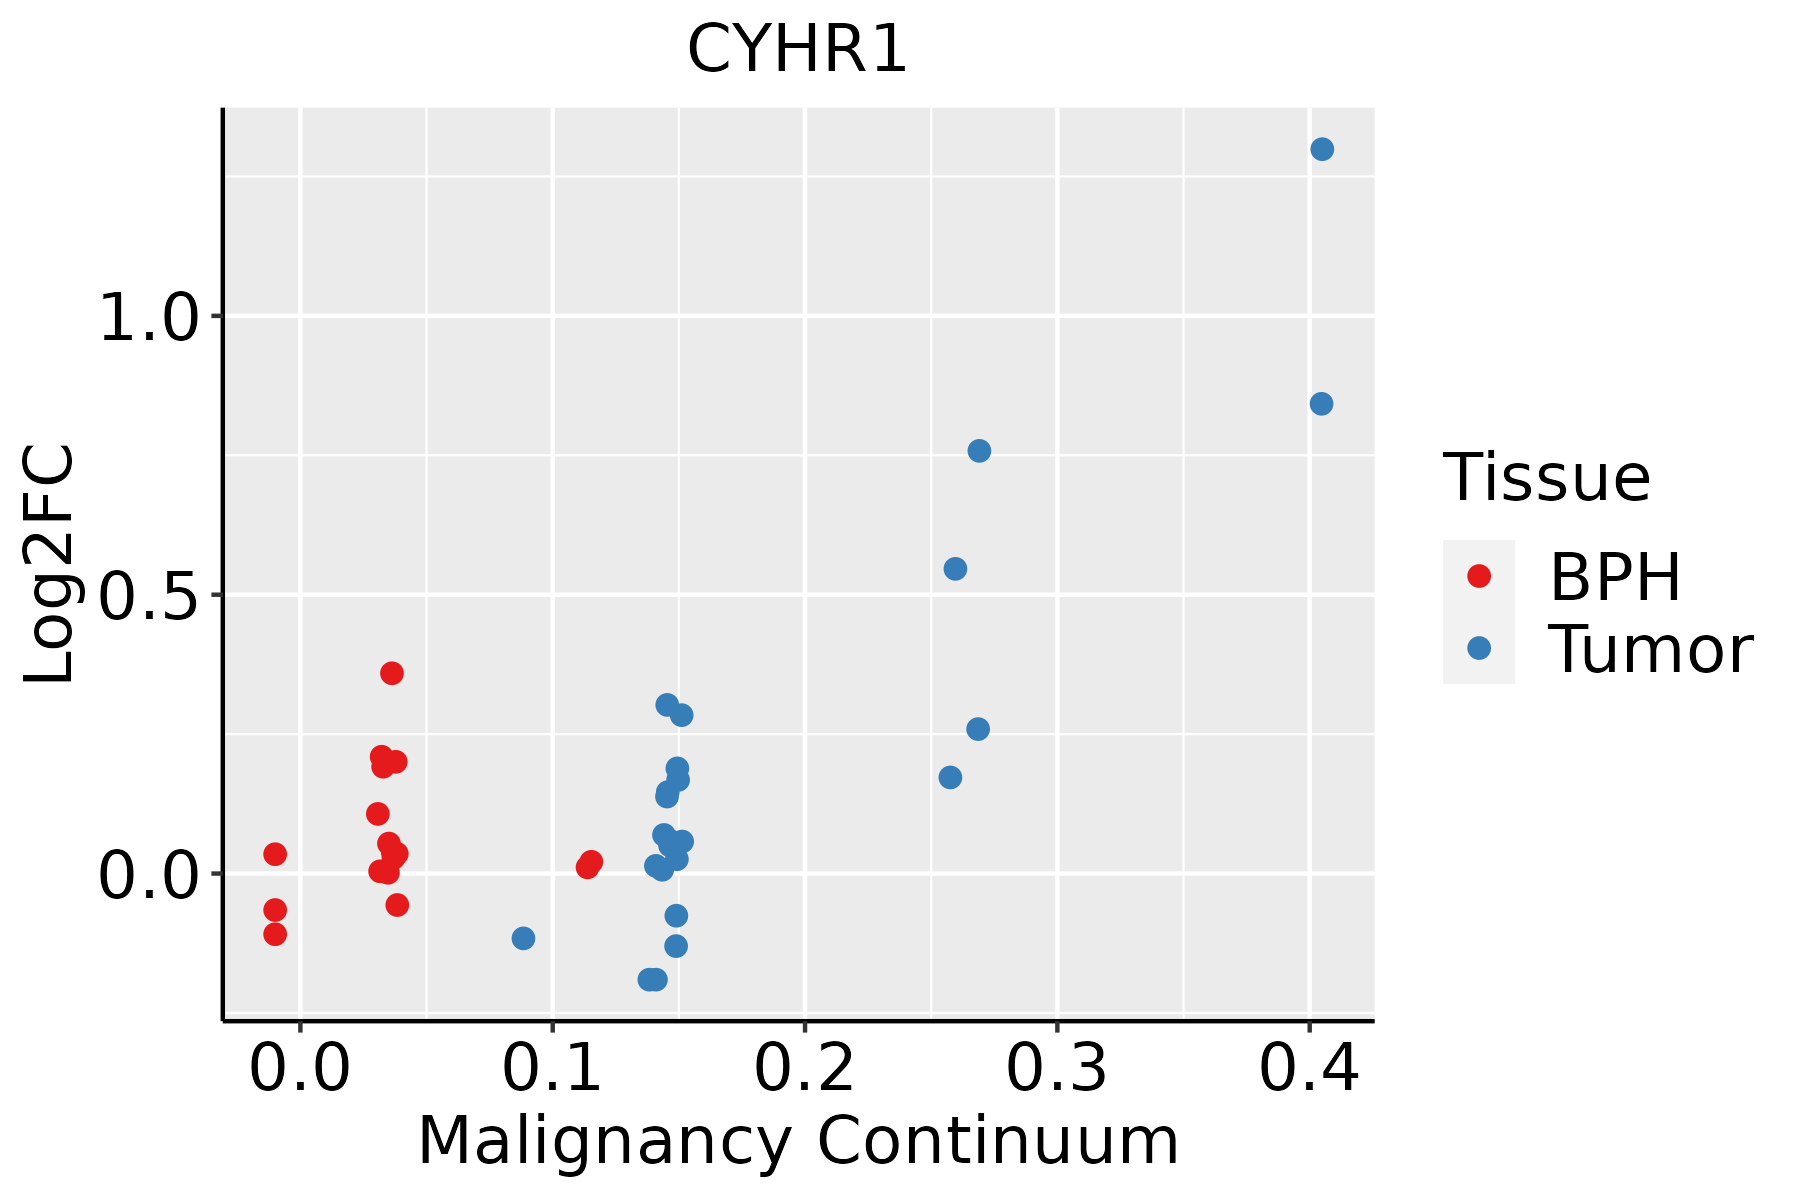 | BPH: Benign Prostatic Hyperplasia |
| Skin |  | AK: Actinic keratosis |
| cSCC: Cutaneous squamous cell carcinoma | ||
| SCCIS:squamous cell carcinoma in situ | ||
| Thyroid | 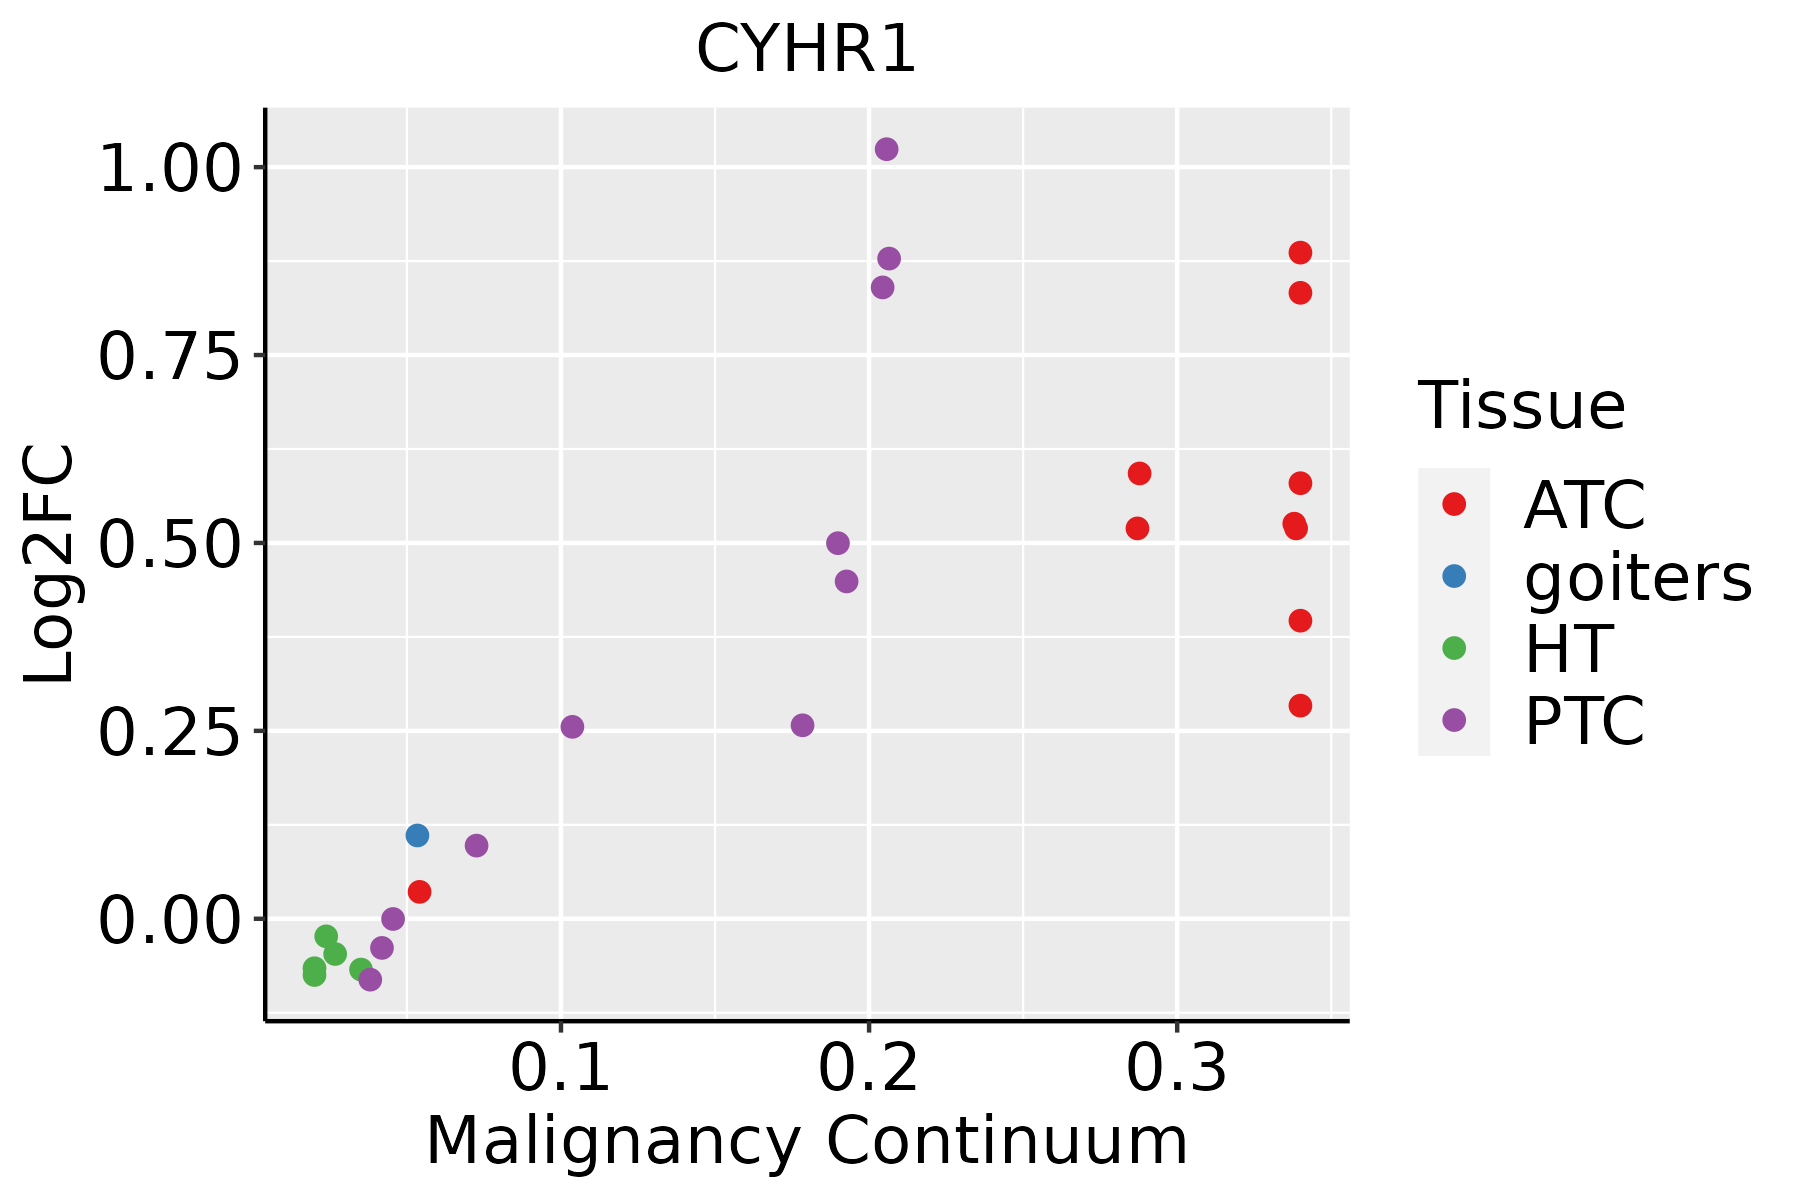 | ATC: Anaplastic thyroid cancer |
| HT: Hashimoto's thyroiditis | ||
| PTC: Papillary thyroid cancer |
| ∗log2FC in expression of this searched gene in stem-like cells from each diseased tissue sample relative to stem-like cells in normal samples in each tissue plotted against the malignancy continuum. Samples are colored based on if they are from different disease stage. |
Top |
Malignant transformation related pathway analysis |
| Find out the enriched GO biological processes and KEGG pathways involved in transition from healthy to precancer to cancer |
| Tissue | Disease Stage | Enriched GO biological Processes |
| Colorectum | AD |  |
| Colorectum | SER |  |
| Colorectum | MSS |  |
| Colorectum | MSI-H |  |
| Colorectum | FAP |  |
| ∗Top 15 enriched GO BP terms are showed in the bar plot of each disease state in each tissue. Each row represents a significant GO biological process which is colored according to the -log10(p.adjust). |
| Page: 1 2 3 4 5 6 7 8 9 |
| GO ID | Tissue | Disease Stage | Description | Gene Ratio | Bg Ratio | pvalue | p.adjust | Count |
| Page: 1 |
| Pathway ID | Tissue | Disease Stage | Description | Gene Ratio | Bg Ratio | pvalue | p.adjust | qvalue | Count |
| Page: 1 |
Top |
Cell-cell communication analysis |
| Identification of potential cell-cell interactions between two cell types and their ligand-receptor pairs for different disease states |
| Ligand | Receptor | LRpair | Pathway | Tissue | Disease Stage |
| Page: 1 |
Top |
Single-cell gene regulatory network inference analysis |
| Find out the significant the regulons (TFs) and the target genes of each regulon across cell types for different disease states |
| TF | Cell Type | Tissue | Disease Stage | Target Gene | RSS | Regulon Activity |
| ∗The dot plots of a searched regulon are shown for all cell subpopulations in each disease state of each tissue based on the regulon specific score inferred using pySCENIC and by calculating the average expression. |
| Page: 1 |
Top |
Somatic mutation of malignant transformation related genes |
| Annotation of somatic variants for genes involved in malignant transformation |
| Hugo Symbol | Variant Class | Variant Classification | dbSNP RS | HGVSc | HGVSp | HGVSp Short | SWISSPROT | BIOTYPE | SIFT | PolyPhen | Tumor Sample Barcode | Tissue | Histology | Sex | Age | Stage | Therapy Types | Drugs | Outcome |
| CYHR1 | SNV | Missense_Mutation | c.602N>A | p.Cys201Tyr | p.C201Y | protein_coding | deleterious(0) | probably_damaging(1) | TCGA-A8-A075-01 | Breast | breast invasive carcinoma | Female | <65 | I/II | Chemotherapy | epirubicin | CR | ||
| CYHR1 | SNV | Missense_Mutation | rs771932807 | c.1120G>A | p.Val374Met | p.V374M | protein_coding | tolerated(0.23) | benign(0.053) | TCGA-AC-A6IW-01 | Breast | breast invasive carcinoma | Female | >=65 | I/II | Unknown | Unknown | SD | |
| CYHR1 | SNV | Missense_Mutation | c.1053C>G | p.Asp351Glu | p.D351E | protein_coding | tolerated(0.18) | benign(0.003) | TCGA-E2-A1LI-01 | Breast | breast invasive carcinoma | Female | <65 | I/II | Chemotherapy | adriamycin | SD | ||
| CYHR1 | SNV | Missense_Mutation | c.568C>T | p.Arg190Cys | p.R190C | protein_coding | deleterious(0) | probably_damaging(0.997) | TCGA-AA-3864-01 | Colorectum | colon adenocarcinoma | Male | >=65 | I/II | Unknown | Unknown | SD | ||
| CYHR1 | SNV | Missense_Mutation | c.970N>G | p.Thr324Ala | p.T324A | protein_coding | tolerated(0.49) | benign(0.374) | TCGA-CK-5913-01 | Colorectum | colon adenocarcinoma | Female | <65 | I/II | Unknown | Unknown | SD | ||
| CYHR1 | SNV | Missense_Mutation | c.431N>A | p.Arg144Gln | p.R144Q | protein_coding | deleterious(0.04) | possibly_damaging(0.614) | TCGA-CM-6675-01 | Colorectum | colon adenocarcinoma | Male | <65 | I/II | Chemotherapy | fluorouracil | PD | ||
| CYHR1 | SNV | Missense_Mutation | c.1081N>G | p.His361Asp | p.H361D | protein_coding | tolerated(0.17) | benign(0.031) | TCGA-D5-5538-01 | Colorectum | colon adenocarcinoma | Female | <65 | III/IV | Chemotherapy | calcium | PD | ||
| CYHR1 | SNV | Missense_Mutation | c.634N>T | p.Arg212Cys | p.R212C | protein_coding | tolerated(0.08) | possibly_damaging(0.679) | TCGA-DM-A1HB-01 | Colorectum | colon adenocarcinoma | Male | >=65 | III/IV | Unknown | Unknown | SD | ||
| CYHR1 | SNV | Missense_Mutation | novel | c.881N>T | p.Thr294Met | p.T294M | protein_coding | deleterious(0) | probably_damaging(0.927) | TCGA-D1-A16F-01 | Endometrium | uterine corpus endometrioid carcinoma | Female | <65 | I/II | Unknown | Unknown | SD | |
| CYHR1 | SNV | Missense_Mutation | novel | c.643T>C | p.Cys215Arg | p.C215R | protein_coding | deleterious(0) | probably_damaging(1) | TCGA-DI-A1BU-01 | Endometrium | uterine corpus endometrioid carcinoma | Female | <65 | I/II | Chemotherapy | paclitaxel | SD |
| Page: 1 2 |
Top |
Related drugs of malignant transformation related genes |
| Identification of chemicals and drugs interact with genes involved in malignant transfromation |
| (DGIdb 4.0) |
| Entrez ID | Symbol | Category | Interaction Types | Drug Claim Name | Drug Name | PMIDs |
| Page: 1 |

Copyright 2023-Present -The University of Texas Health Science Center at Houston |