
|
|||||
|
 | |
| |
| |
| |
| |
| |
|
Gene: CYGB |
Gene summary for CYGB |
| Gene information | Species | Human | Gene symbol | CYGB | Gene ID | 114757 |
| Gene name | cytoglobin | |
| Gene Alias | HGB | |
| Cytomap | 17q25.1 | |
| Gene Type | protein-coding | GO ID | GO:0001666 | UniProtAcc | A0A1K0FUB6 |
Top |
Malignant transformation analysis |
| Identification of the aberrant gene expression in precancerous and cancerous lesions by comparing the gene expression of stem-like cells in diseased tissues with normal stem cells |
| Entrez ID | Symbol | Replicates | Species | Organ | Tissue | Adj P-value | Log2FC | Malignancy |
| 114757 | CYGB | C04 | Human | Oral cavity | OSCC | 4.41e-02 | 1.83e-01 | 0.2633 |
| 114757 | CYGB | C21 | Human | Oral cavity | OSCC | 4.30e-13 | 6.83e-01 | 0.2678 |
| 114757 | CYGB | C30 | Human | Oral cavity | OSCC | 4.51e-04 | 5.07e-01 | 0.3055 |
| 114757 | CYGB | C38 | Human | Oral cavity | OSCC | 7.72e-03 | 4.62e-01 | 0.172 |
| 114757 | CYGB | C51 | Human | Oral cavity | OSCC | 1.29e-05 | 2.52e-01 | 0.2674 |
| 114757 | CYGB | C08 | Human | Oral cavity | OSCC | 1.03e-07 | 2.41e-01 | 0.1919 |
| 114757 | CYGB | LN46 | Human | Oral cavity | OSCC | 6.46e-03 | 8.95e-02 | 0.1666 |
| 114757 | CYGB | ATC12 | Human | Thyroid | ATC | 1.13e-11 | 2.85e-01 | 0.34 |
| 114757 | CYGB | ATC13 | Human | Thyroid | ATC | 4.54e-53 | 1.24e+00 | 0.34 |
| 114757 | CYGB | ATC4 | Human | Thyroid | ATC | 1.06e-14 | 3.81e-01 | 0.34 |
| 114757 | CYGB | ATC5 | Human | Thyroid | ATC | 5.98e-58 | 1.30e+00 | 0.34 |
| Page: 1 |
| Tissue | Expression Dynamics | Abbreviation |
| Oral Cavity | 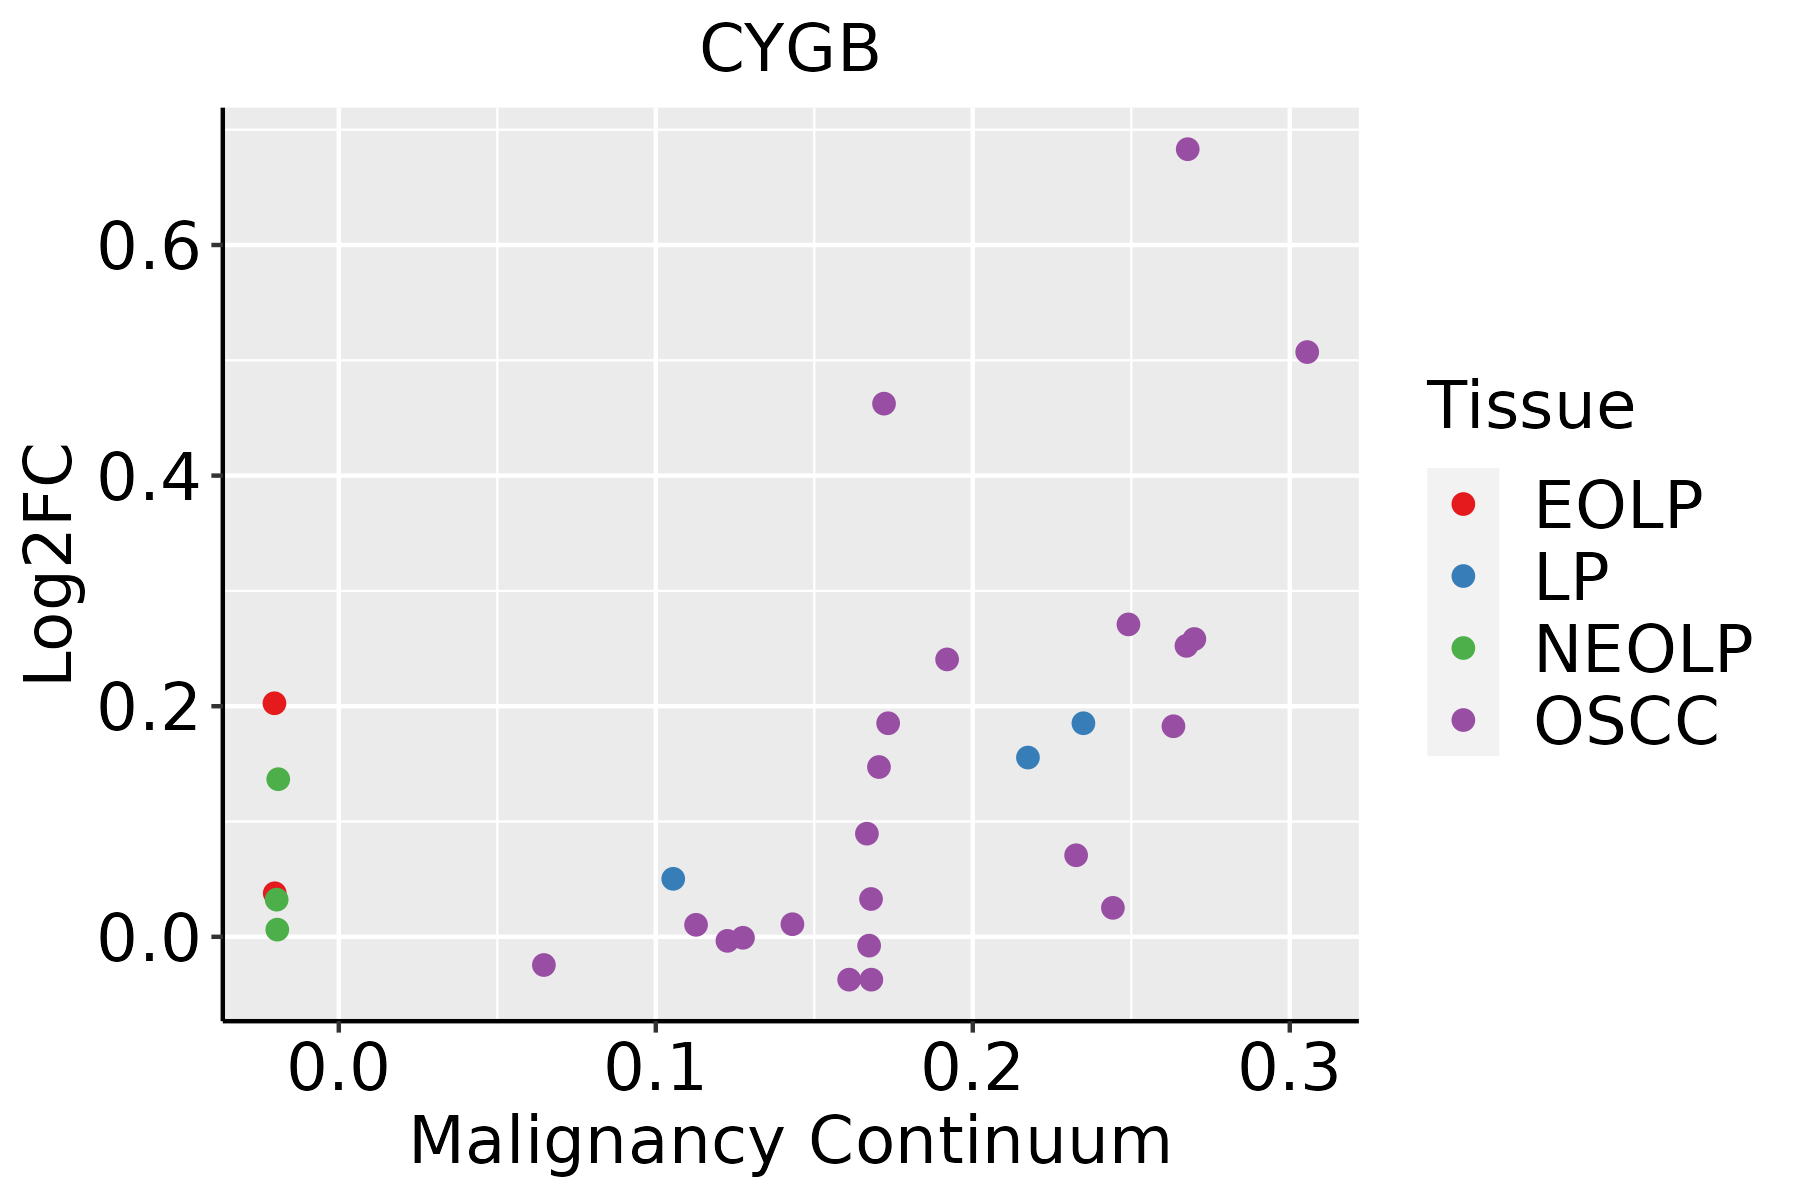 | EOLP: Erosive Oral lichen planus |
| LP: leukoplakia | ||
| NEOLP: Non-erosive oral lichen planus | ||
| OSCC: Oral squamous cell carcinoma | ||
| Thyroid | 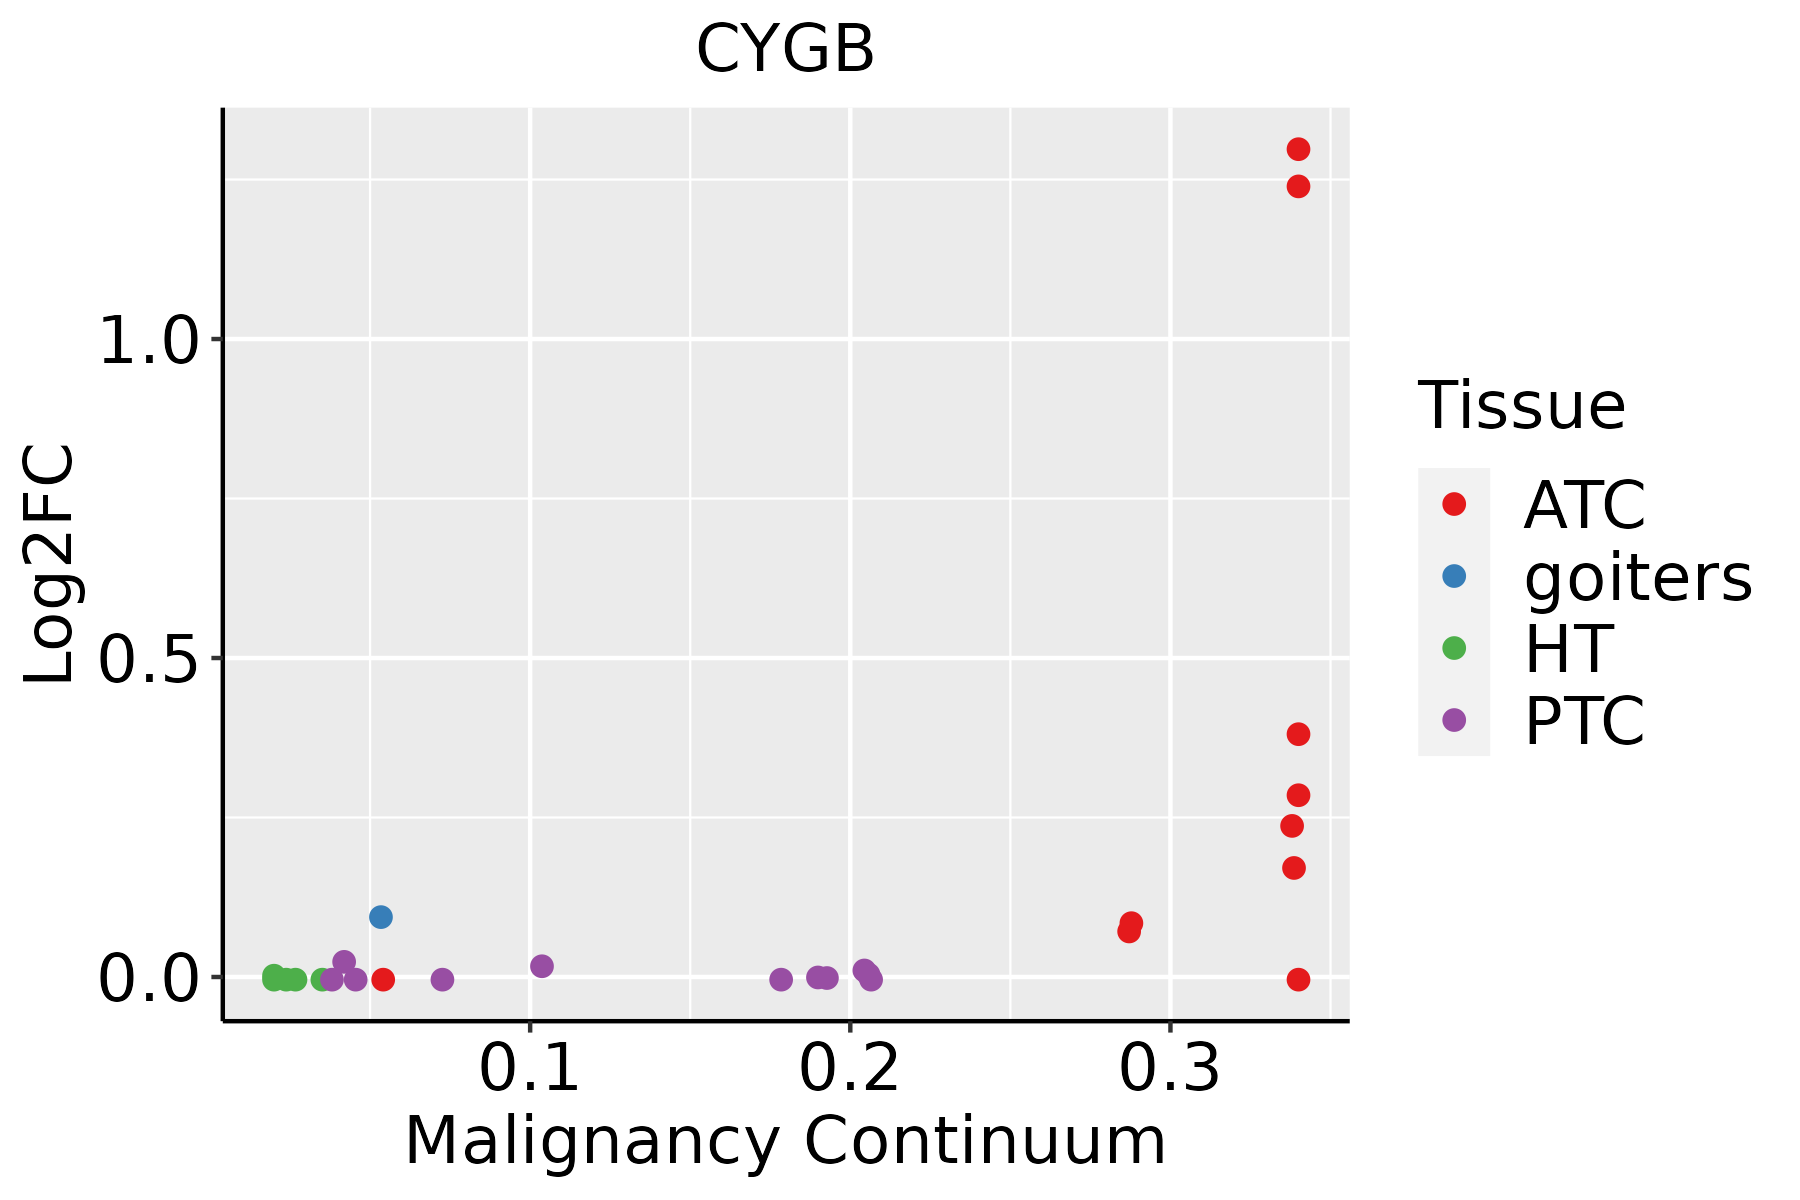 | ATC: Anaplastic thyroid cancer |
| HT: Hashimoto's thyroiditis | ||
| PTC: Papillary thyroid cancer |
| ∗log2FC in expression of this searched gene in stem-like cells from each diseased tissue sample relative to stem-like cells in normal samples in each tissue plotted against the malignancy continuum. Samples are colored based on if they are from different disease stage. |
Top |
Malignant transformation related pathway analysis |
| Find out the enriched GO biological processes and KEGG pathways involved in transition from healthy to precancer to cancer |
| Tissue | Disease Stage | Enriched GO biological Processes |
| Colorectum | AD |  |
| Colorectum | SER |  |
| Colorectum | MSS |  |
| Colorectum | MSI-H |  |
| Colorectum | FAP |  |
| ∗Top 15 enriched GO BP terms are showed in the bar plot of each disease state in each tissue. Each row represents a significant GO biological process which is colored according to the -log10(p.adjust). |
| Page: 1 2 3 4 5 6 7 8 9 |
| GO ID | Tissue | Disease Stage | Description | Gene Ratio | Bg Ratio | pvalue | p.adjust | Count |
| GO:000697920 | Oral cavity | OSCC | response to oxidative stress | 273/7305 | 446/18723 | 8.35e-22 | 1.65e-19 | 273 |
| GO:007048219 | Oral cavity | OSCC | response to oxygen levels | 200/7305 | 347/18723 | 1.17e-12 | 5.13e-11 | 200 |
| GO:000166619 | Oral cavity | OSCC | response to hypoxia | 177/7305 | 307/18723 | 2.21e-11 | 7.50e-10 | 177 |
| GO:003629319 | Oral cavity | OSCC | response to decreased oxygen levels | 182/7305 | 322/18723 | 1.14e-10 | 3.41e-09 | 182 |
| GO:000963618 | Oral cavity | OSCC | response to toxic substance | 137/7305 | 262/18723 | 7.94e-06 | 8.52e-05 | 137 |
| GO:00107618 | Oral cavity | OSCC | fibroblast migration | 33/7305 | 47/18723 | 1.43e-05 | 1.44e-04 | 33 |
| GO:000166719 | Oral cavity | OSCC | ameboidal-type cell migration | 228/7305 | 475/18723 | 3.46e-05 | 3.10e-04 | 228 |
| GO:00066317 | Oral cavity | OSCC | fatty acid metabolic process | 186/7305 | 390/18723 | 2.65e-04 | 1.69e-03 | 186 |
| GO:00193957 | Oral cavity | OSCC | fatty acid oxidation | 57/7305 | 103/18723 | 5.58e-04 | 3.23e-03 | 57 |
| GO:199074818 | Oral cavity | OSCC | cellular detoxification | 63/7305 | 116/18723 | 5.80e-04 | 3.31e-03 | 63 |
| GO:00344406 | Oral cavity | OSCC | lipid oxidation | 59/7305 | 108/18723 | 7.01e-04 | 3.89e-03 | 59 |
| GO:00107623 | Oral cavity | OSCC | regulation of fibroblast migration | 24/7305 | 36/18723 | 7.18e-04 | 3.95e-03 | 24 |
| GO:009886918 | Oral cavity | OSCC | cellular oxidant detoxification | 55/7305 | 101/18723 | 1.16e-03 | 5.89e-03 | 55 |
| GO:009723718 | Oral cavity | OSCC | cellular response to toxic substance | 65/7305 | 124/18723 | 1.63e-03 | 7.74e-03 | 65 |
| GO:0032963 | Oral cavity | OSCC | collagen metabolic process | 54/7305 | 104/18723 | 5.00e-03 | 1.96e-02 | 54 |
| GO:009875418 | Oral cavity | OSCC | detoxification | 75/7305 | 152/18723 | 5.99e-03 | 2.28e-02 | 75 |
| GO:000697934 | Thyroid | ATC | response to oxidative stress | 246/6293 | 446/18723 | 2.98e-21 | 6.09e-19 | 246 |
| GO:007048228 | Thyroid | ATC | response to oxygen levels | 193/6293 | 347/18723 | 1.83e-17 | 1.93e-15 | 193 |
| GO:003629328 | Thyroid | ATC | response to decreased oxygen levels | 177/6293 | 322/18723 | 1.81e-15 | 1.32e-13 | 177 |
| GO:000166628 | Thyroid | ATC | response to hypoxia | 169/6293 | 307/18723 | 6.58e-15 | 4.12e-13 | 169 |
| Page: 1 2 |
| Pathway ID | Tissue | Disease Stage | Description | Gene Ratio | Bg Ratio | pvalue | p.adjust | qvalue | Count |
| Page: 1 |
Top |
Cell-cell communication analysis |
| Identification of potential cell-cell interactions between two cell types and their ligand-receptor pairs for different disease states |
| Ligand | Receptor | LRpair | Pathway | Tissue | Disease Stage |
| Page: 1 |
Top |
Single-cell gene regulatory network inference analysis |
| Find out the significant the regulons (TFs) and the target genes of each regulon across cell types for different disease states |
| TF | Cell Type | Tissue | Disease Stage | Target Gene | RSS | Regulon Activity |
| ∗The dot plots of a searched regulon are shown for all cell subpopulations in each disease state of each tissue based on the regulon specific score inferred using pySCENIC and by calculating the average expression. |
| Page: 1 |
Top |
Somatic mutation of malignant transformation related genes |
| Annotation of somatic variants for genes involved in malignant transformation |
| Hugo Symbol | Variant Class | Variant Classification | dbSNP RS | HGVSc | HGVSp | HGVSp Short | SWISSPROT | BIOTYPE | SIFT | PolyPhen | Tumor Sample Barcode | Tissue | Histology | Sex | Age | Stage | Therapy Types | Drugs | Outcome |
| CYGB | SNV | Missense_Mutation | novel | c.69N>C | p.Glu23Asp | p.E23D | Q8WWM9 | protein_coding | tolerated(0.41) | benign(0.204) | TCGA-3C-AALI-01 | Breast | breast invasive carcinoma | Female | <65 | I/II | Unspecific | Poly E | Complete Response |
| CYGB | deletion | Frame_Shift_Del | novel | c.460delN | p.Leu154CysfsTer9 | p.L154Cfs*9 | Q8WWM9 | protein_coding | TCGA-D8-A27V-01 | Breast | breast invasive carcinoma | Female | <65 | I/II | Hormone Therapy | tamoxiphen | SD | ||
| CYGB | SNV | Missense_Mutation | novel | c.244N>A | p.Ala82Thr | p.A82T | Q8WWM9 | protein_coding | deleterious(0) | possibly_damaging(0.764) | TCGA-EA-A5ZE-01 | Cervix | cervical & endocervical cancer | Female | <65 | I/II | Unknown | Unknown | PD |
| CYGB | SNV | Missense_Mutation | novel | c.58N>G | p.Ser20Ala | p.S20A | Q8WWM9 | protein_coding | deleterious(0.03) | benign(0.007) | TCGA-ZJ-AB0H-01 | Cervix | cervical & endocervical cancer | Female | <65 | III/IV | Unknown | Unknown | SD |
| CYGB | insertion | Frame_Shift_Ins | novel | c.28_29insGGGG | p.Ile10ArgfsTer90 | p.I10Rfs*90 | Q8WWM9 | protein_coding | TCGA-DS-A1OD-01 | Cervix | cervical & endocervical cancer | Female | <65 | I/II | Chemotherapy | cisplatin | SD | ||
| CYGB | SNV | Missense_Mutation | c.463N>T | p.Arg155Cys | p.R155C | Q8WWM9 | protein_coding | tolerated(0.07) | benign(0.003) | TCGA-A6-2686-01 | Colorectum | colon adenocarcinoma | Female | >=65 | I/II | Unknown | Unknown | SD | |
| CYGB | SNV | Missense_Mutation | novel | c.563N>T | p.Ser188Leu | p.S188L | Q8WWM9 | protein_coding | deleterious_low_confidence(0.01) | benign(0.116) | TCGA-A6-6141-01 | Colorectum | colon adenocarcinoma | Male | <65 | I/II | Chemotherapy | 5-fu | SD |
| CYGB | SNV | Missense_Mutation | rs369705030 | c.277G>A | p.Val93Met | p.V93M | Q8WWM9 | protein_coding | deleterious(0) | probably_damaging(0.944) | TCGA-CK-4951-01 | Colorectum | colon adenocarcinoma | Female | >=65 | I/II | Unknown | Unknown | PD |
| CYGB | SNV | Missense_Mutation | c.34C>T | p.Arg12Cys | p.R12C | Q8WWM9 | protein_coding | deleterious(0.02) | possibly_damaging(0.66) | TCGA-CK-5913-01 | Colorectum | colon adenocarcinoma | Female | <65 | I/II | Unknown | Unknown | SD | |
| CYGB | SNV | Missense_Mutation | c.143G>T | p.Arg48Met | p.R48M | Q8WWM9 | protein_coding | deleterious(0.01) | probably_damaging(0.921) | TCGA-D5-6930-01 | Colorectum | colon adenocarcinoma | Male | >=65 | I/II | Unknown | Unknown | SD |
| Page: 1 2 3 |
Top |
Related drugs of malignant transformation related genes |
| Identification of chemicals and drugs interact with genes involved in malignant transfromation |
| (DGIdb 4.0) |
| Entrez ID | Symbol | Category | Interaction Types | Drug Claim Name | Drug Name | PMIDs |
| Page: 1 |

Copyright 2023-Present -The University of Texas Health Science Center at Houston |