
|
|||||
|
 | |
| |
| |
| |
| |
| |
|
Gene: CYFIP2 |
Gene summary for CYFIP2 |
| Gene information | Species | Human | Gene symbol | CYFIP2 | Gene ID | 26999 |
| Gene name | cytoplasmic FMR1 interacting protein 2 | |
| Gene Alias | DEE65 | |
| Cytomap | 5q33.3 | |
| Gene Type | protein-coding | GO ID | GO:0000902 | UniProtAcc | Q96F07 |
Top |
Malignant transformation analysis |
| Identification of the aberrant gene expression in precancerous and cancerous lesions by comparing the gene expression of stem-like cells in diseased tissues with normal stem cells |
| Entrez ID | Symbol | Replicates | Species | Organ | Tissue | Adj P-value | Log2FC | Malignancy |
| 26999 | CYFIP2 | NAFLD1 | Human | Liver | NAFLD | 1.91e-08 | 8.76e-01 | -0.04 |
| 26999 | CYFIP2 | HCC1_Meng | Human | Liver | HCC | 6.72e-19 | -1.61e-02 | 0.0246 |
| 26999 | CYFIP2 | HCC2 | Human | Liver | HCC | 1.92e-07 | 3.34e+00 | 0.5341 |
| Page: 1 |
| Tissue | Expression Dynamics | Abbreviation |
| Liver | 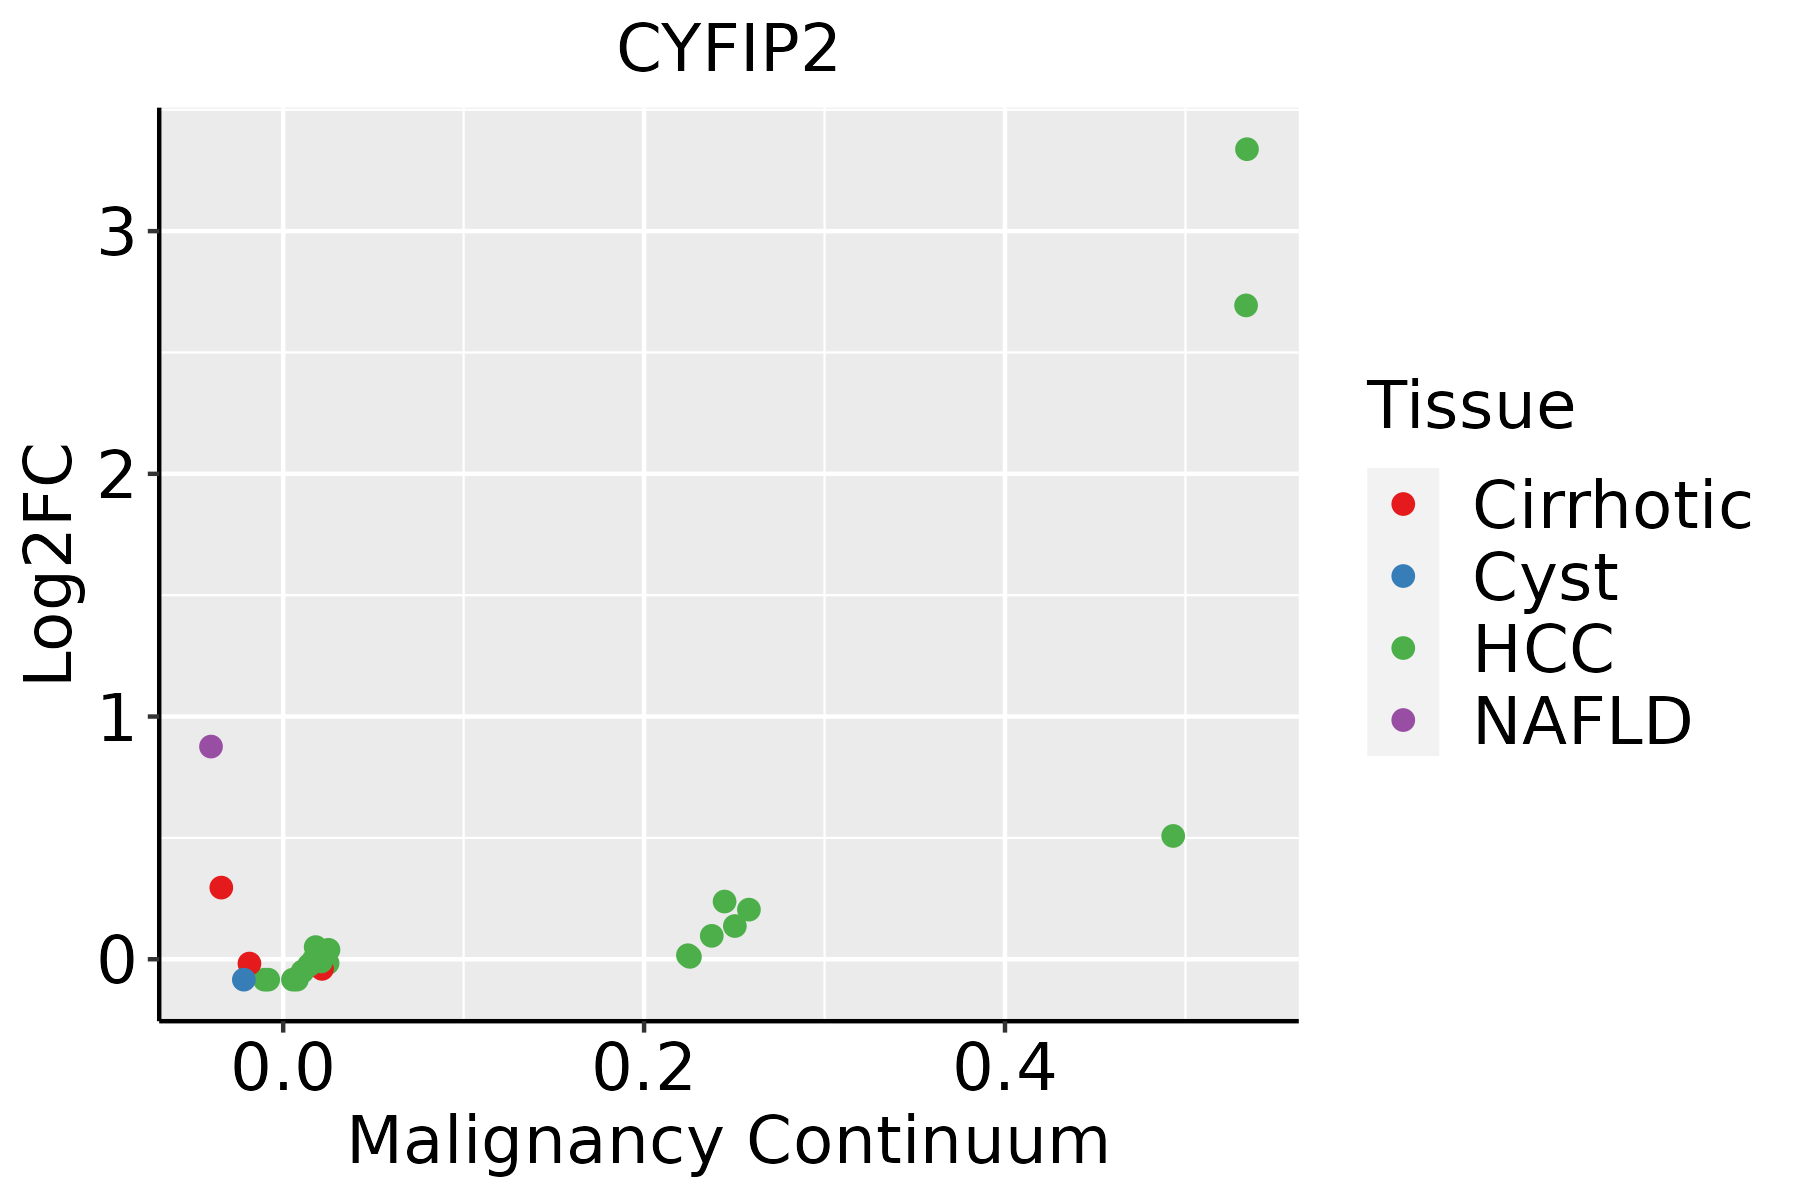 | HCC: Hepatocellular carcinoma |
| NAFLD: Non-alcoholic fatty liver disease |
| ∗log2FC in expression of this searched gene in stem-like cells from each diseased tissue sample relative to stem-like cells in normal samples in each tissue plotted against the malignancy continuum. Samples are colored based on if they are from different disease stage. |
Top |
Malignant transformation related pathway analysis |
| Find out the enriched GO biological processes and KEGG pathways involved in transition from healthy to precancer to cancer |
| Tissue | Disease Stage | Enriched GO biological Processes |
| Colorectum | AD |  |
| Colorectum | SER |  |
| Colorectum | MSS |  |
| Colorectum | MSI-H |  |
| Colorectum | FAP |  |
| ∗Top 15 enriched GO BP terms are showed in the bar plot of each disease state in each tissue. Each row represents a significant GO biological process which is colored according to the -log10(p.adjust). |
| Page: 1 2 3 4 5 6 7 8 9 |
| GO ID | Tissue | Disease Stage | Description | Gene Ratio | Bg Ratio | pvalue | p.adjust | Count |
| GO:00160495 | Liver | NAFLD | cell growth | 85/1882 | 482/18723 | 1.75e-07 | 1.25e-05 | 85 |
| GO:00070157 | Liver | NAFLD | actin filament organization | 78/1882 | 442/18723 | 5.44e-07 | 3.21e-05 | 78 |
| GO:00458627 | Liver | NAFLD | positive regulation of proteolysis | 65/1882 | 372/18723 | 6.58e-06 | 2.29e-04 | 65 |
| GO:19029037 | Liver | NAFLD | regulation of supramolecular fiber organization | 66/1882 | 383/18723 | 8.97e-06 | 2.96e-04 | 66 |
| GO:00485884 | Liver | NAFLD | developmental cell growth | 45/1882 | 234/18723 | 1.50e-05 | 4.38e-04 | 45 |
| GO:00329707 | Liver | NAFLD | regulation of actin filament-based process | 66/1882 | 397/18723 | 2.92e-05 | 7.72e-04 | 66 |
| GO:00329567 | Liver | NAFLD | regulation of actin cytoskeleton organization | 60/1882 | 358/18723 | 5.20e-05 | 1.20e-03 | 60 |
| GO:01100537 | Liver | NAFLD | regulation of actin filament organization | 49/1882 | 278/18723 | 6.88e-05 | 1.46e-03 | 49 |
| GO:00525477 | Liver | NAFLD | regulation of peptidase activity | 72/1882 | 461/18723 | 1.03e-04 | 2.03e-03 | 72 |
| GO:0031638 | Liver | NAFLD | zymogen activation | 16/1882 | 60/18723 | 2.08e-04 | 3.60e-03 | 16 |
| GO:00525487 | Liver | NAFLD | regulation of endopeptidase activity | 67/1882 | 432/18723 | 2.17e-04 | 3.70e-03 | 67 |
| GO:00432547 | Liver | NAFLD | regulation of protein-containing complex assembly | 66/1882 | 428/18723 | 2.83e-04 | 4.53e-03 | 66 |
| GO:00512587 | Liver | NAFLD | protein polymerization | 49/1882 | 297/18723 | 3.54e-04 | 5.36e-03 | 49 |
| GO:0038179 | Liver | NAFLD | neurotrophin signaling pathway | 11/1882 | 36/18723 | 5.73e-04 | 7.66e-03 | 11 |
| GO:00605604 | Liver | NAFLD | developmental growth involved in morphogenesis | 39/1882 | 234/18723 | 1.11e-03 | 1.28e-02 | 39 |
| GO:00322717 | Liver | NAFLD | regulation of protein polymerization | 38/1882 | 233/18723 | 1.90e-03 | 1.93e-02 | 38 |
| GO:19901383 | Liver | NAFLD | neuron projection extension | 30/1882 | 172/18723 | 1.93e-03 | 1.94e-02 | 30 |
| GO:00081547 | Liver | NAFLD | actin polymerization or depolymerization | 36/1882 | 218/18723 | 1.98e-03 | 1.98e-02 | 36 |
| GO:00325356 | Liver | NAFLD | regulation of cellular component size | 55/1882 | 383/18723 | 4.31e-03 | 3.55e-02 | 55 |
| GO:00300417 | Liver | NAFLD | actin filament polymerization | 31/1882 | 191/18723 | 5.06e-03 | 3.96e-02 | 31 |
| Page: 1 2 3 |
| Pathway ID | Tissue | Disease Stage | Description | Gene Ratio | Bg Ratio | pvalue | p.adjust | qvalue | Count |
| hsa0513214 | Liver | NAFLD | Salmonella infection | 55/1043 | 249/8465 | 8.48e-06 | 3.09e-04 | 2.49e-04 | 55 |
| hsa0513014 | Liver | NAFLD | Pathogenic Escherichia coli infection | 45/1043 | 197/8465 | 2.31e-05 | 6.88e-04 | 5.54e-04 | 45 |
| hsa0481010 | Liver | NAFLD | Regulation of actin cytoskeleton | 50/1043 | 229/8465 | 3.01e-05 | 7.59e-04 | 6.11e-04 | 50 |
| hsa0513215 | Liver | NAFLD | Salmonella infection | 55/1043 | 249/8465 | 8.48e-06 | 3.09e-04 | 2.49e-04 | 55 |
| hsa0513015 | Liver | NAFLD | Pathogenic Escherichia coli infection | 45/1043 | 197/8465 | 2.31e-05 | 6.88e-04 | 5.54e-04 | 45 |
| hsa0481011 | Liver | NAFLD | Regulation of actin cytoskeleton | 50/1043 | 229/8465 | 3.01e-05 | 7.59e-04 | 6.11e-04 | 50 |
| hsa0513242 | Liver | HCC | Salmonella infection | 178/4020 | 249/8465 | 5.90e-15 | 1.98e-13 | 1.10e-13 | 178 |
| hsa0513042 | Liver | HCC | Pathogenic Escherichia coli infection | 129/4020 | 197/8465 | 2.02e-07 | 2.50e-06 | 1.39e-06 | 129 |
| hsa0481041 | Liver | HCC | Regulation of actin cytoskeleton | 134/4020 | 229/8465 | 4.48e-04 | 1.94e-03 | 1.08e-03 | 134 |
| hsa0513252 | Liver | HCC | Salmonella infection | 178/4020 | 249/8465 | 5.90e-15 | 1.98e-13 | 1.10e-13 | 178 |
| hsa0513052 | Liver | HCC | Pathogenic Escherichia coli infection | 129/4020 | 197/8465 | 2.02e-07 | 2.50e-06 | 1.39e-06 | 129 |
| hsa0481051 | Liver | HCC | Regulation of actin cytoskeleton | 134/4020 | 229/8465 | 4.48e-04 | 1.94e-03 | 1.08e-03 | 134 |
| Page: 1 |
Top |
Cell-cell communication analysis |
| Identification of potential cell-cell interactions between two cell types and their ligand-receptor pairs for different disease states |
| Ligand | Receptor | LRpair | Pathway | Tissue | Disease Stage |
| Page: 1 |
Top |
Single-cell gene regulatory network inference analysis |
| Find out the significant the regulons (TFs) and the target genes of each regulon across cell types for different disease states |
| TF | Cell Type | Tissue | Disease Stage | Target Gene | RSS | Regulon Activity |
| ∗The dot plots of a searched regulon are shown for all cell subpopulations in each disease state of each tissue based on the regulon specific score inferred using pySCENIC and by calculating the average expression. |
| Page: 1 |
Top |
Somatic mutation of malignant transformation related genes |
| Annotation of somatic variants for genes involved in malignant transformation |
| Hugo Symbol | Variant Class | Variant Classification | dbSNP RS | HGVSc | HGVSp | HGVSp Short | SWISSPROT | BIOTYPE | SIFT | PolyPhen | Tumor Sample Barcode | Tissue | Histology | Sex | Age | Stage | Therapy Types | Drugs | Outcome |
| CYFIP2 | SNV | Missense_Mutation | rs755329609 | c.1475G>A | p.Arg492His | p.R492H | Q96F07 | protein_coding | deleterious(0) | probably_damaging(0.957) | TCGA-A8-A06Q-01 | Breast | breast invasive carcinoma | Female | <65 | III/IV | Unknown | Unknown | SD |
| CYFIP2 | SNV | Missense_Mutation | c.3663G>C | p.Lys1221Asn | p.K1221N | Q96F07 | protein_coding | tolerated(0.24) | probably_damaging(0.932) | TCGA-AC-A2B8-01 | Breast | breast invasive carcinoma | Female | >=65 | I/II | Chemotherapy | chemo | PD | |
| CYFIP2 | SNV | Missense_Mutation | novel | c.894N>A | p.Phe298Leu | p.F298L | Q96F07 | protein_coding | tolerated(0.17) | benign(0.24) | TCGA-AN-A046-01 | Breast | breast invasive carcinoma | Female | >=65 | I/II | Unknown | Unknown | SD |
| CYFIP2 | SNV | Missense_Mutation | c.2413N>T | p.Asp805Tyr | p.D805Y | Q96F07 | protein_coding | deleterious(0) | possibly_damaging(0.761) | TCGA-BH-A0DG-01 | Breast | breast invasive carcinoma | Female | <65 | I/II | Chemotherapy | taxotere | CR | |
| CYFIP2 | SNV | Missense_Mutation | c.1498N>T | p.Arg500Trp | p.R500W | Q96F07 | protein_coding | deleterious(0) | possibly_damaging(0.826) | TCGA-BH-A0W7-01 | Breast | breast invasive carcinoma | Female | <65 | I/II | Chemotherapy | taxotere | CR | |
| CYFIP2 | SNV | Missense_Mutation | c.1975C>G | p.Arg659Gly | p.R659G | Q96F07 | protein_coding | deleterious(0.01) | possibly_damaging(0.871) | TCGA-C8-A1HJ-01 | Breast | breast invasive carcinoma | Female | <65 | I/II | Unknown | Unknown | SD | |
| CYFIP2 | SNV | Missense_Mutation | novel | c.2709A>C | p.Lys903Asn | p.K903N | Q96F07 | protein_coding | tolerated(0.05) | probably_damaging(0.932) | TCGA-E9-A1RE-01 | Breast | breast invasive carcinoma | Female | >=65 | III/IV | Hormone Therapy | tamoxiphen | SD |
| CYFIP2 | SNV | Missense_Mutation | novel | c.2636N>G | p.Tyr879Cys | p.Y879C | Q96F07 | protein_coding | deleterious(0) | probably_damaging(0.985) | TCGA-EW-A1IZ-01 | Breast | breast invasive carcinoma | Female | <65 | III/IV | Chemotherapy | taxotere | SD |
| CYFIP2 | deletion | Frame_Shift_Del | c.3661_3664delNNNN | p.Lys1221MetfsTer4 | p.K1221Mfs*4 | Q96F07 | protein_coding | TCGA-A2-A0YD-01 | Breast | breast invasive carcinoma | Female | <65 | I/II | Chemotherapy | cytoxan | SD | |||
| CYFIP2 | insertion | Frame_Shift_Ins | novel | c.2149_2150insTCCCAGGTGGAGGTGGGACAAGAACCCAGGTCTC | p.Ala717ValfsTer13 | p.A717Vfs*13 | Q96F07 | protein_coding | TCGA-A8-A06U-01 | Breast | breast invasive carcinoma | Female | >=65 | I/II | Unknown | Unknown | SD |
| Page: 1 2 3 4 5 6 7 8 9 10 11 12 13 14 15 16 |
Top |
Related drugs of malignant transformation related genes |
| Identification of chemicals and drugs interact with genes involved in malignant transfromation |
| (DGIdb 4.0) |
| Entrez ID | Symbol | Category | Interaction Types | Drug Claim Name | Drug Name | PMIDs |
| Page: 1 |

Copyright 2023-Present -The University of Texas Health Science Center at Houston |