| Tissue | Expression Dynamics | Abbreviation |
| Colorectum (GSE201348) |  | FAP: Familial adenomatous polyposis |
| CRC: Colorectal cancer |
| Colorectum (HTA11) |  | AD: Adenomas |
| SER: Sessile serrated lesions |
| MSI-H: Microsatellite-high colorectal cancer |
| MSS: Microsatellite stable colorectal cancer |
| Esophagus |  | ESCC: Esophageal squamous cell carcinoma |
| HGIN: High-grade intraepithelial neoplasias |
| LGIN: Low-grade intraepithelial neoplasias |
| Liver | 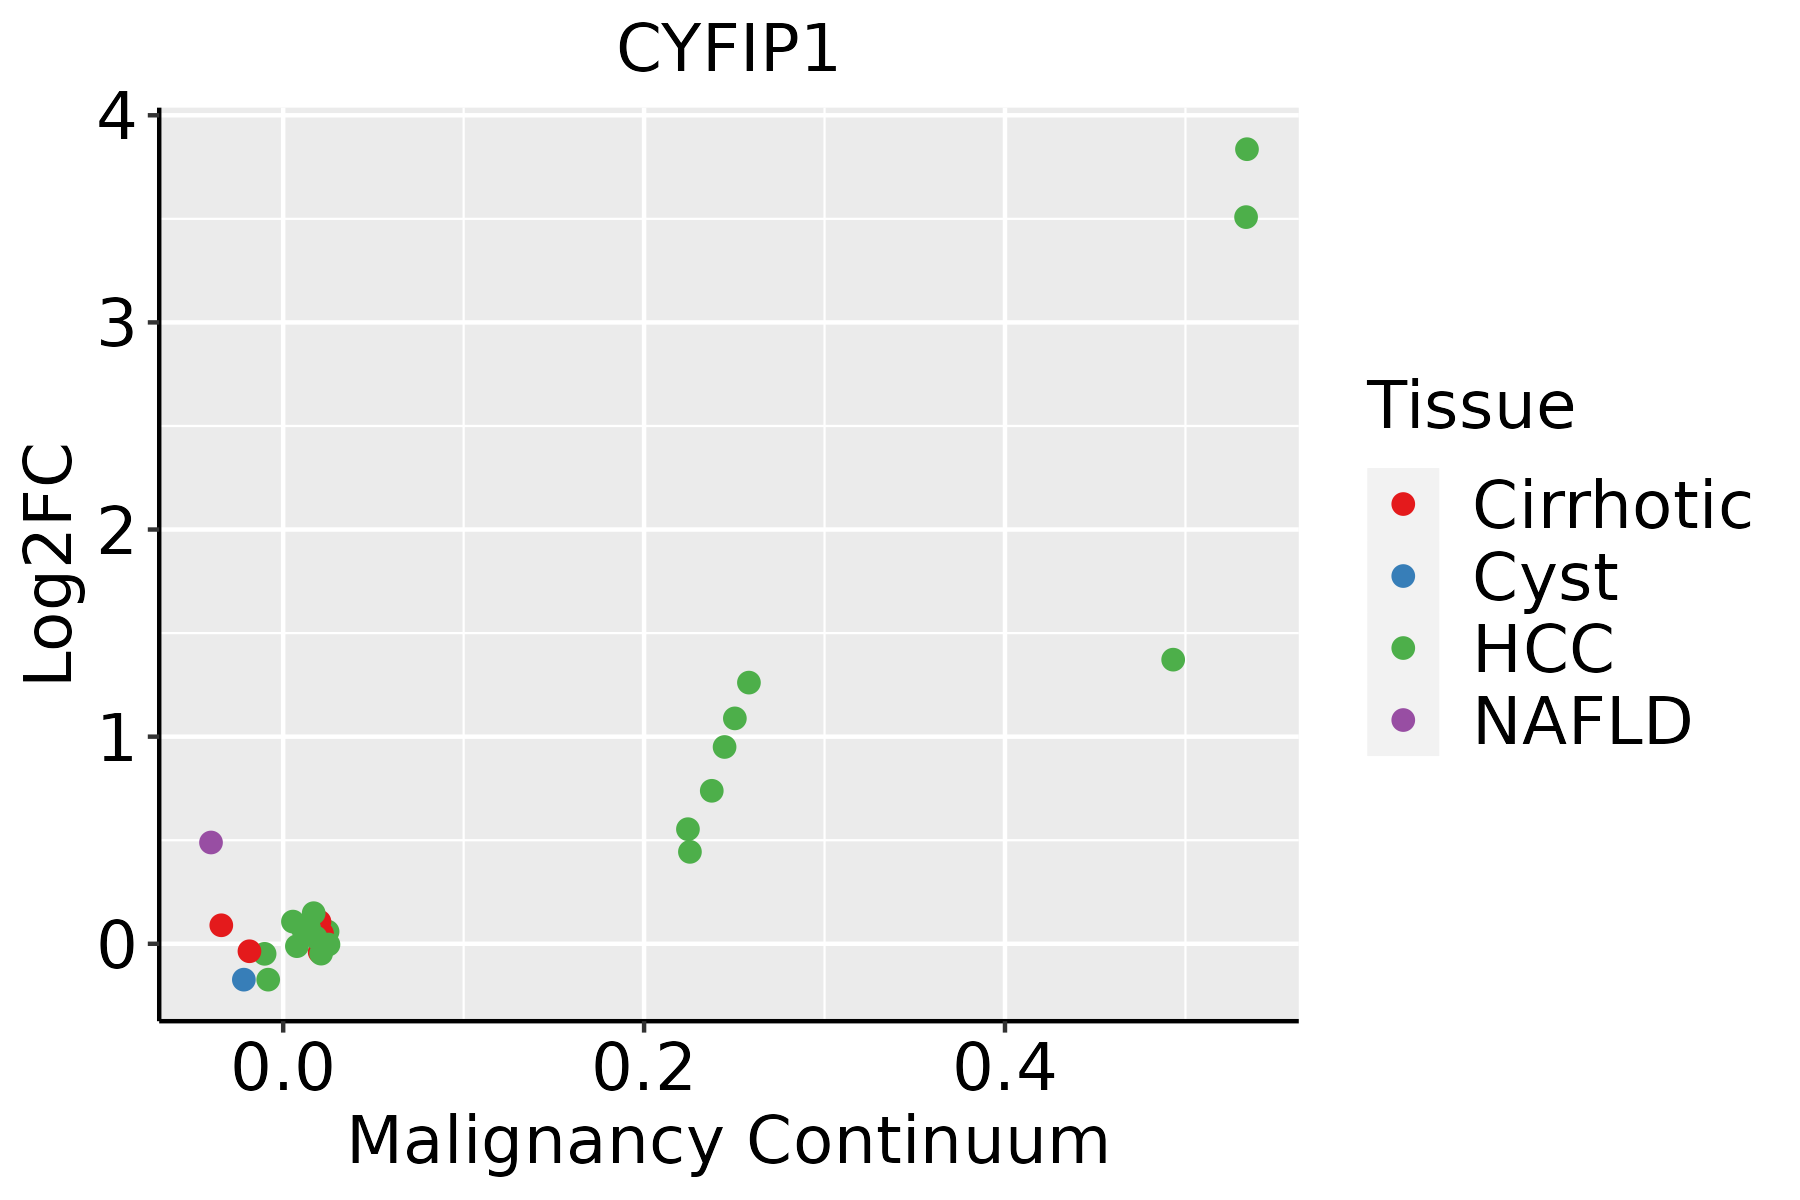 | HCC: Hepatocellular carcinoma |
| NAFLD: Non-alcoholic fatty liver disease |
| Oral Cavity | 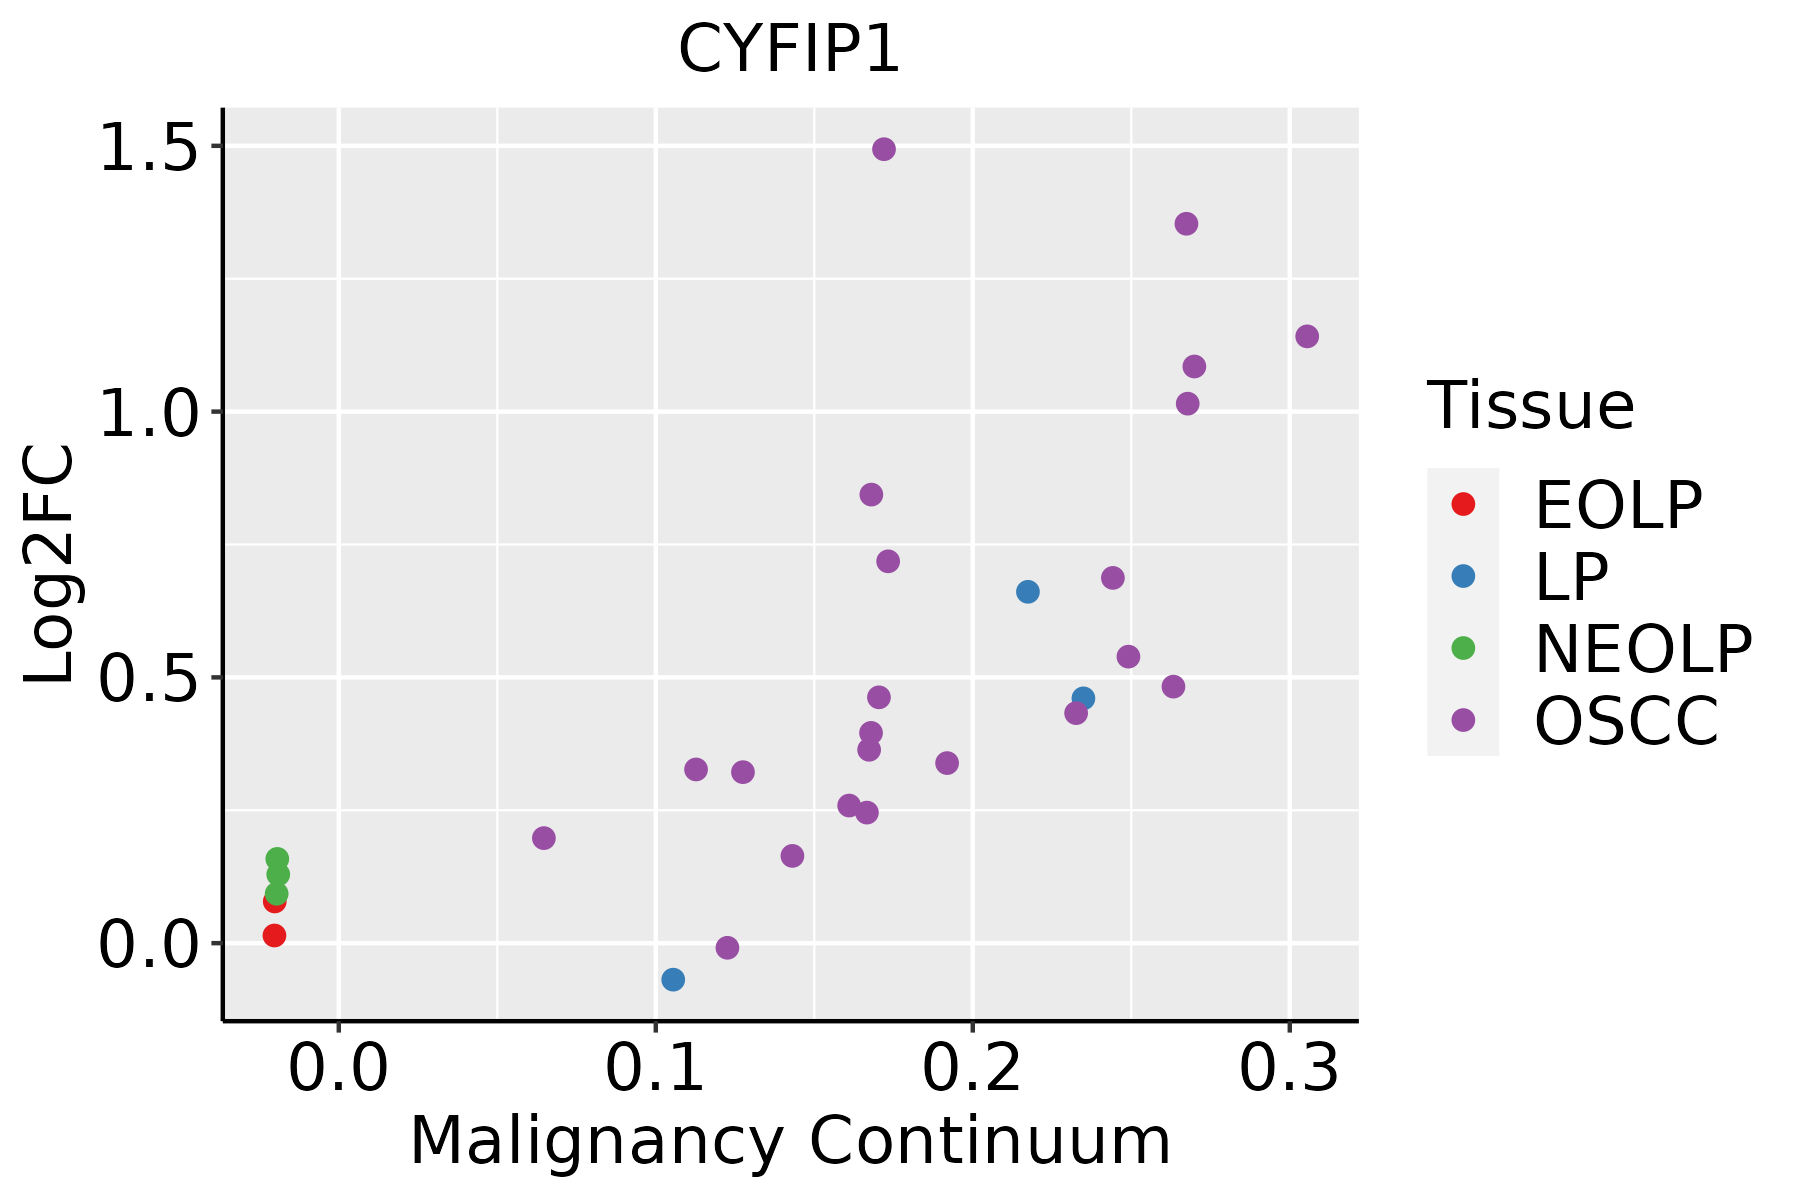 | EOLP: Erosive Oral lichen planus |
| LP: leukoplakia |
| NEOLP: Non-erosive oral lichen planus |
| OSCC: Oral squamous cell carcinoma |
| Prostate | 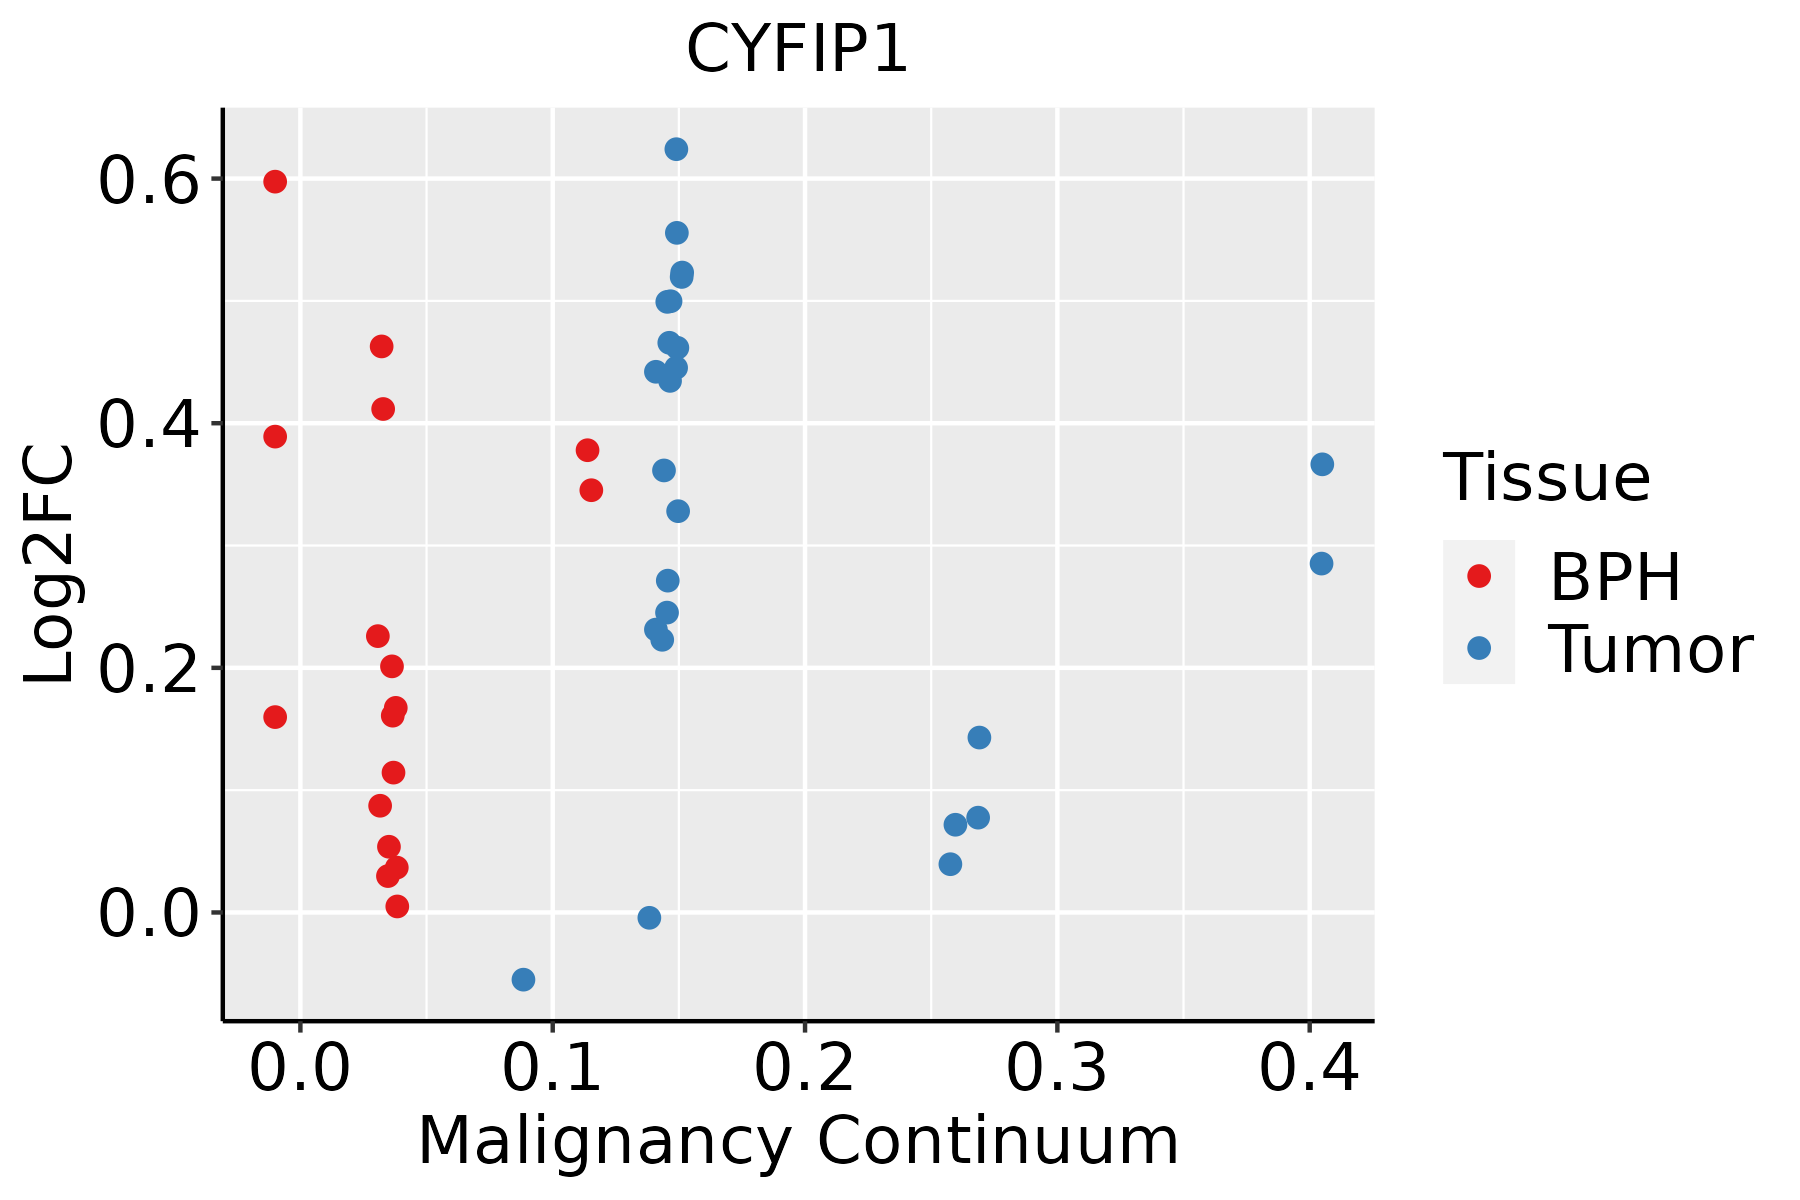 | BPH: Benign Prostatic Hyperplasia |
| Skin | 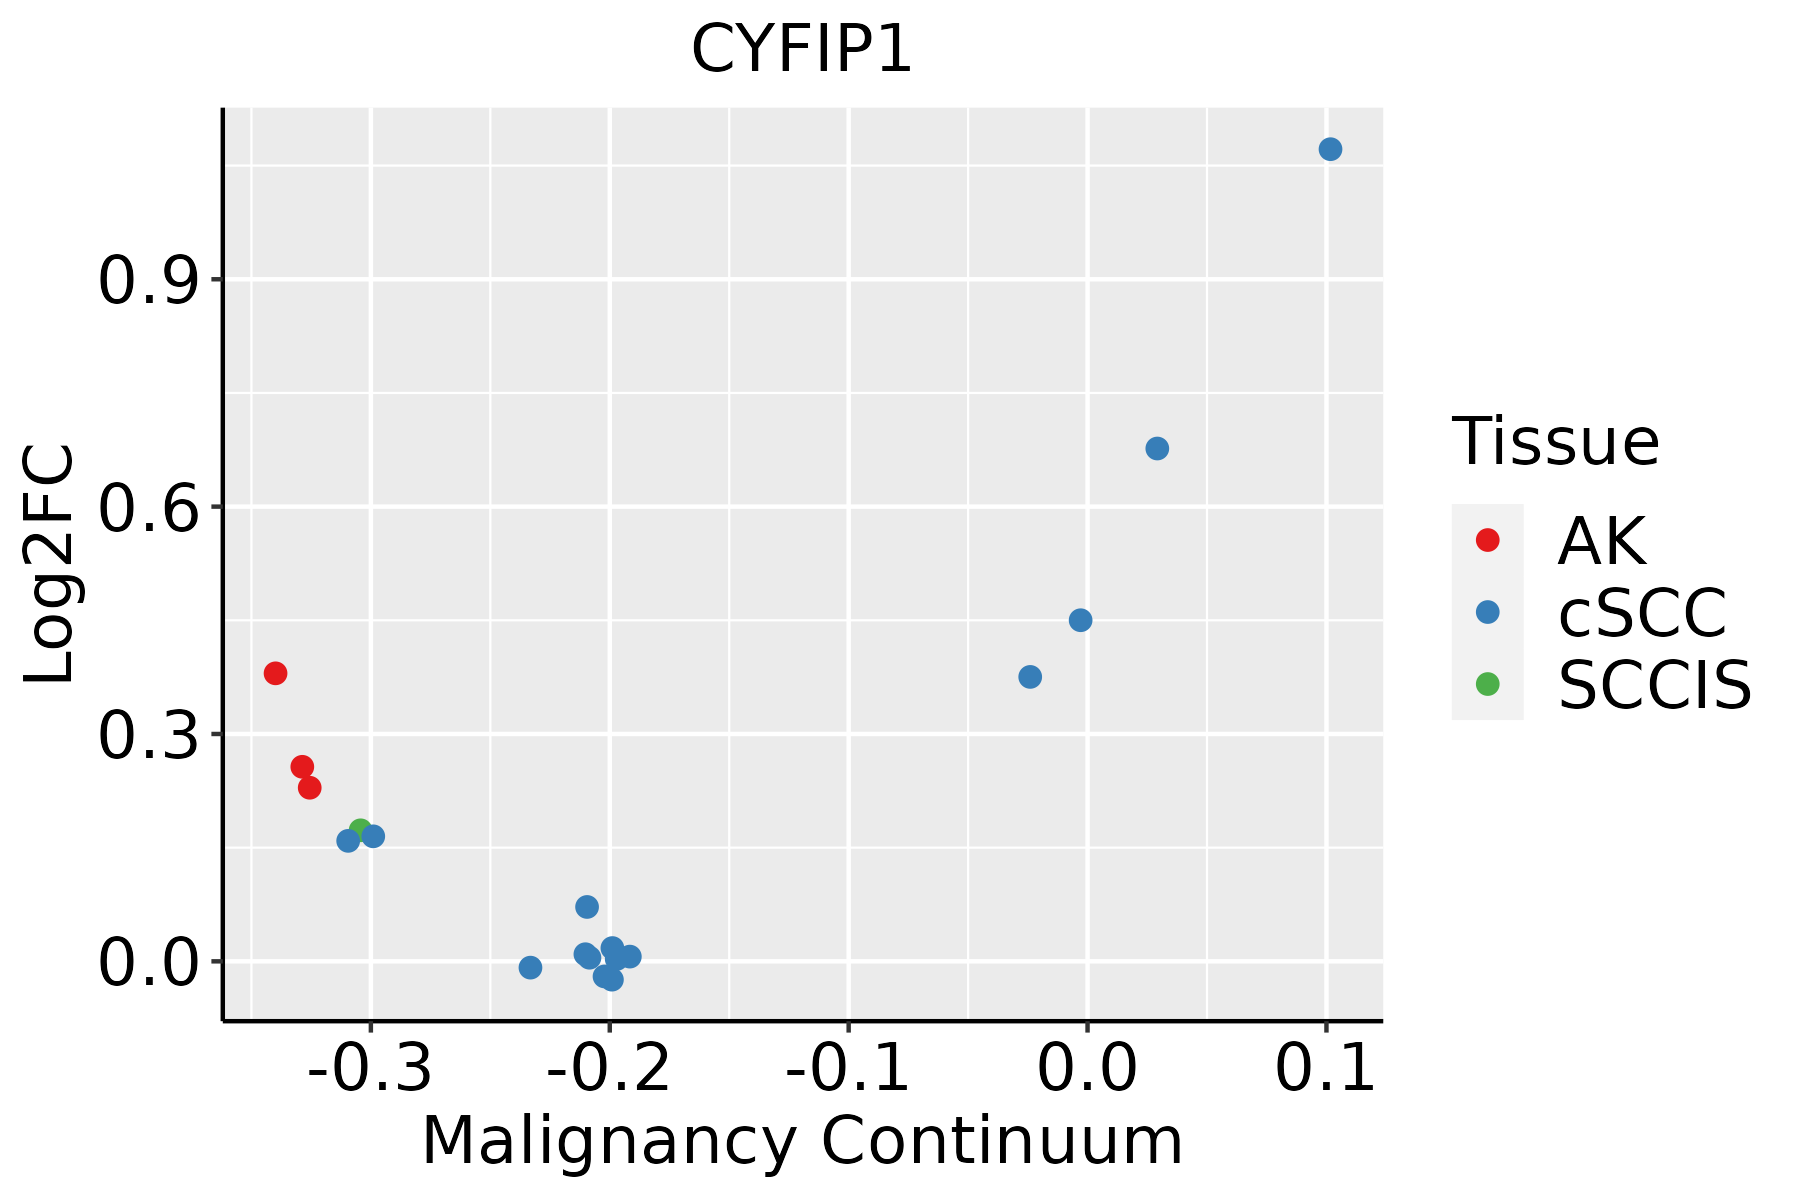 | AK: Actinic keratosis |
| cSCC: Cutaneous squamous cell carcinoma |
| SCCIS:squamous cell carcinoma in situ |
| Thyroid |  | ATC: Anaplastic thyroid cancer |
| HT: Hashimoto's thyroiditis |
| PTC: Papillary thyroid cancer |
| GO ID | Tissue | Disease Stage | Description | Gene Ratio | Bg Ratio | pvalue | p.adjust | Count |
| GO:0007015 | Colorectum | AD | actin filament organization | 167/3918 | 442/18723 | 1.65e-16 | 7.94e-14 | 167 |
| GO:0032535 | Colorectum | AD | regulation of cellular component size | 142/3918 | 383/18723 | 1.74e-13 | 3.41e-11 | 142 |
| GO:1902903 | Colorectum | AD | regulation of supramolecular fiber organization | 139/3918 | 383/18723 | 2.01e-12 | 3.19e-10 | 139 |
| GO:0032970 | Colorectum | AD | regulation of actin filament-based process | 142/3918 | 397/18723 | 4.05e-12 | 5.90e-10 | 142 |
| GO:0110053 | Colorectum | AD | regulation of actin filament organization | 108/3918 | 278/18723 | 5.02e-12 | 6.98e-10 | 108 |
| GO:0008154 | Colorectum | AD | actin polymerization or depolymerization | 90/3918 | 218/18723 | 6.14e-12 | 8.23e-10 | 90 |
| GO:0032271 | Colorectum | AD | regulation of protein polymerization | 94/3918 | 233/18723 | 1.01e-11 | 1.29e-09 | 94 |
| GO:0030041 | Colorectum | AD | actin filament polymerization | 81/3918 | 191/18723 | 1.35e-11 | 1.69e-09 | 81 |
| GO:0051258 | Colorectum | AD | protein polymerization | 112/3918 | 297/18723 | 1.85e-11 | 2.27e-09 | 112 |
| GO:0043254 | Colorectum | AD | regulation of protein-containing complex assembly | 148/3918 | 428/18723 | 2.64e-11 | 3.18e-09 | 148 |
| GO:0008064 | Colorectum | AD | regulation of actin polymerization or depolymerization | 79/3918 | 188/18723 | 4.17e-11 | 4.74e-09 | 79 |
| GO:0030833 | Colorectum | AD | regulation of actin filament polymerization | 74/3918 | 172/18723 | 4.50e-11 | 5.03e-09 | 74 |
| GO:0030832 | Colorectum | AD | regulation of actin filament length | 79/3918 | 189/18723 | 5.71e-11 | 6.27e-09 | 79 |
| GO:1902905 | Colorectum | AD | positive regulation of supramolecular fiber organization | 85/3918 | 209/18723 | 5.95e-11 | 6.33e-09 | 85 |
| GO:0032956 | Colorectum | AD | regulation of actin cytoskeleton organization | 127/3918 | 358/18723 | 1.03e-10 | 1.04e-08 | 127 |
| GO:0051495 | Colorectum | AD | positive regulation of cytoskeleton organization | 89/3918 | 226/18723 | 1.61e-10 | 1.56e-08 | 89 |
| GO:0032273 | Colorectum | AD | positive regulation of protein polymerization | 62/3918 | 138/18723 | 1.94e-10 | 1.76e-08 | 62 |
| GO:0031334 | Colorectum | AD | positive regulation of protein-containing complex assembly | 91/3918 | 237/18723 | 4.78e-10 | 3.99e-08 | 91 |
| GO:0030838 | Colorectum | AD | positive regulation of actin filament polymerization | 48/3918 | 99/18723 | 9.21e-10 | 7.03e-08 | 48 |
| GO:0022604 | Colorectum | AD | regulation of cell morphogenesis | 109/3918 | 309/18723 | 3.08e-09 | 2.07e-07 | 109 |
| Pathway ID | Tissue | Disease Stage | Description | Gene Ratio | Bg Ratio | pvalue | p.adjust | qvalue | Count |
| hsa05132 | Colorectum | AD | Salmonella infection | 102/2092 | 249/8465 | 7.65e-09 | 1.28e-07 | 8.17e-08 | 102 |
| hsa05130 | Colorectum | AD | Pathogenic Escherichia coli infection | 79/2092 | 197/8465 | 1.05e-06 | 1.36e-05 | 8.65e-06 | 79 |
| hsa04810 | Colorectum | AD | Regulation of actin cytoskeleton | 75/2092 | 229/8465 | 3.36e-03 | 1.76e-02 | 1.12e-02 | 75 |
| hsa051321 | Colorectum | AD | Salmonella infection | 102/2092 | 249/8465 | 7.65e-09 | 1.28e-07 | 8.17e-08 | 102 |
| hsa051301 | Colorectum | AD | Pathogenic Escherichia coli infection | 79/2092 | 197/8465 | 1.05e-06 | 1.36e-05 | 8.65e-06 | 79 |
| hsa048101 | Colorectum | AD | Regulation of actin cytoskeleton | 75/2092 | 229/8465 | 3.36e-03 | 1.76e-02 | 1.12e-02 | 75 |
| hsa051308 | Colorectum | FAP | Pathogenic Escherichia coli infection | 62/1404 | 197/8465 | 1.37e-07 | 3.08e-06 | 1.87e-06 | 62 |
| hsa048106 | Colorectum | FAP | Regulation of actin cytoskeleton | 65/1404 | 229/8465 | 4.07e-06 | 5.91e-05 | 3.59e-05 | 65 |
| hsa051328 | Colorectum | FAP | Salmonella infection | 67/1404 | 249/8465 | 2.04e-05 | 2.52e-04 | 1.53e-04 | 67 |
| hsa051309 | Colorectum | FAP | Pathogenic Escherichia coli infection | 62/1404 | 197/8465 | 1.37e-07 | 3.08e-06 | 1.87e-06 | 62 |
| hsa048107 | Colorectum | FAP | Regulation of actin cytoskeleton | 65/1404 | 229/8465 | 4.07e-06 | 5.91e-05 | 3.59e-05 | 65 |
| hsa051329 | Colorectum | FAP | Salmonella infection | 67/1404 | 249/8465 | 2.04e-05 | 2.52e-04 | 1.53e-04 | 67 |
| hsa0513010 | Colorectum | CRC | Pathogenic Escherichia coli infection | 47/1091 | 197/8465 | 1.49e-05 | 3.84e-04 | 2.60e-04 | 47 |
| hsa048108 | Colorectum | CRC | Regulation of actin cytoskeleton | 52/1091 | 229/8465 | 2.34e-05 | 5.57e-04 | 3.78e-04 | 52 |
| hsa0513210 | Colorectum | CRC | Salmonella infection | 48/1091 | 249/8465 | 2.43e-03 | 1.69e-02 | 1.15e-02 | 48 |
| hsa0513011 | Colorectum | CRC | Pathogenic Escherichia coli infection | 47/1091 | 197/8465 | 1.49e-05 | 3.84e-04 | 2.60e-04 | 47 |
| hsa048109 | Colorectum | CRC | Regulation of actin cytoskeleton | 52/1091 | 229/8465 | 2.34e-05 | 5.57e-04 | 3.78e-04 | 52 |
| hsa0513211 | Colorectum | CRC | Salmonella infection | 48/1091 | 249/8465 | 2.43e-03 | 1.69e-02 | 1.15e-02 | 48 |
| hsa05132211 | Esophagus | ESCC | Salmonella infection | 191/4205 | 249/8465 | 6.51e-19 | 5.45e-17 | 2.79e-17 | 191 |
| hsa05130211 | Esophagus | ESCC | Pathogenic Escherichia coli infection | 142/4205 | 197/8465 | 8.21e-11 | 1.06e-09 | 5.42e-10 | 142 |
| Hugo Symbol | Variant Class | Variant Classification | dbSNP RS | HGVSc | HGVSp | HGVSp Short | SWISSPROT | BIOTYPE | SIFT | PolyPhen | Tumor Sample Barcode | Tissue | Histology | Sex | Age | Stage | Therapy Types | Drugs | Outcome |
| CYFIP1 | SNV | Missense_Mutation | rs748203521 | c.3367N>A | p.Glu1123Lys | p.E1123K | Q7L576 | protein_coding | tolerated(0.06) | benign(0.442) | TCGA-5L-AAT1-01 | Breast | breast invasive carcinoma | Female | <65 | III/IV | Hormone Therapy | letrozol | SD |
| CYFIP1 | SNV | Missense_Mutation | novel | c.1339G>A | p.Glu447Lys | p.E447K | Q7L576 | protein_coding | deleterious(0) | probably_damaging(0.975) | TCGA-A1-A0SP-01 | Breast | breast invasive carcinoma | Female | <65 | I/II | Chemotherapy | | SD |
| CYFIP1 | SNV | Missense_Mutation | novel | c.1986N>C | p.Glu662Asp | p.E662D | Q7L576 | protein_coding | deleterious(0.03) | probably_damaging(0.998) | TCGA-AN-A0AT-01 | Breast | breast invasive carcinoma | Female | <65 | I/II | Unknown | Unknown | SD |
| CYFIP1 | SNV | Missense_Mutation | novel | c.3055G>A | p.Val1019Met | p.V1019M | Q7L576 | protein_coding | tolerated(0.08) | possibly_damaging(0.873) | TCGA-BH-A0BM-01 | Breast | breast invasive carcinoma | Female | <65 | I/II | Chemotherapy | adriamycin | SD |
| CYFIP1 | SNV | Missense_Mutation | novel | c.2717G>T | p.Arg906Leu | p.R906L | Q7L576 | protein_coding | tolerated(0.24) | benign(0.175) | TCGA-BH-A0GZ-01 | Breast | breast invasive carcinoma | Female | <65 | I/II | Hormone Therapy | arimidex | SD |
| CYFIP1 | SNV | Missense_Mutation | rs761297983 | c.29N>T | p.Ala10Val | p.A10V | Q7L576 | protein_coding | deleterious(0.01) | probably_damaging(0.986) | TCGA-BH-A18G-01 | Breast | breast invasive carcinoma | Female | >=65 | I/II | Unknown | Unknown | SD |
| CYFIP1 | SNV | Missense_Mutation | novel | c.506N>T | p.Ala169Val | p.A169V | Q7L576 | protein_coding | deleterious(0.03) | benign(0.057) | TCGA-C8-A27B-01 | Breast | breast invasive carcinoma | Female | <65 | I/II | Chemotherapy | 5-fluorouracil | CR |
| CYFIP1 | SNV | Missense_Mutation | novel | c.2357G>A | p.Arg786Gln | p.R786Q | Q7L576 | protein_coding | deleterious(0.01) | possibly_damaging(0.647) | TCGA-GM-A2D9-01 | Breast | breast invasive carcinoma | Female | >=65 | I/II | Hormone Therapy | arimidex | SD |
| CYFIP1 | SNV | Missense_Mutation | novel | c.1066N>A | p.His356Asn | p.H356N | Q7L576 | protein_coding | deleterious(0.01) | benign(0.056) | TCGA-OL-A66P-01 | Breast | breast invasive carcinoma | Female | >=65 | I/II | Chemotherapy | cytoxan | CR |
| CYFIP1 | insertion | Nonsense_Mutation | novel | c.2129_2130insCCTTCCCTG | p.Ile710_Phe711insLeuProTer | p.I710_F711insLP* | Q7L576 | protein_coding | | | TCGA-AN-A03X-01 | Breast | breast invasive carcinoma | Female | >=65 | I/II | Unknown | Unknown | SD |


