
|
|||||
|
 | |
| |
| |
| |
| |
| |
|
Gene: CYBRD1 |
Gene summary for CYBRD1 |
| Gene information | Species | Human | Gene symbol | CYBRD1 | Gene ID | 79901 |
| Gene name | cytochrome b reductase 1 | |
| Gene Alias | CYB561A2 | |
| Cytomap | 2q31.1 | |
| Gene Type | protein-coding | GO ID | GO:0000041 | UniProtAcc | Q53TN4 |
Top |
Malignant transformation analysis |
| Identification of the aberrant gene expression in precancerous and cancerous lesions by comparing the gene expression of stem-like cells in diseased tissues with normal stem cells |
| Entrez ID | Symbol | Replicates | Species | Organ | Tissue | Adj P-value | Log2FC | Malignancy |
| 79901 | CYBRD1 | GSM4909299 | Human | Breast | IDC | 8.34e-08 | 3.28e-01 | 0.035 |
| 79901 | CYBRD1 | GSM4909300 | Human | Breast | IDC | 1.61e-02 | 2.94e-01 | 0.0334 |
| 79901 | CYBRD1 | GSM4909307 | Human | Breast | IDC | 9.14e-09 | 3.57e-01 | 0.1569 |
| 79901 | CYBRD1 | GSM4909308 | Human | Breast | IDC | 3.57e-19 | 4.73e-01 | 0.158 |
| 79901 | CYBRD1 | GSM4909311 | Human | Breast | IDC | 8.80e-04 | -6.18e-03 | 0.1534 |
| 79901 | CYBRD1 | GSM4909312 | Human | Breast | IDC | 7.26e-03 | 2.37e-01 | 0.1552 |
| 79901 | CYBRD1 | GSM4909319 | Human | Breast | IDC | 6.48e-05 | -7.86e-02 | 0.1563 |
| 79901 | CYBRD1 | M5 | Human | Breast | IDC | 1.76e-06 | 7.07e-01 | 0.1598 |
| 79901 | CYBRD1 | DCIS2 | Human | Breast | DCIS | 7.72e-45 | 2.20e-01 | 0.0085 |
| 79901 | CYBRD1 | LZE5T | Human | Esophagus | ESCC | 2.70e-02 | 5.14e-02 | 0.0514 |
| 79901 | CYBRD1 | LZE24T | Human | Esophagus | ESCC | 4.64e-05 | -2.99e-04 | 0.0596 |
| 79901 | CYBRD1 | P2T-E | Human | Esophagus | ESCC | 5.61e-10 | -4.04e-02 | 0.1177 |
| 79901 | CYBRD1 | P4T-E | Human | Esophagus | ESCC | 1.61e-12 | 1.59e-01 | 0.1323 |
| 79901 | CYBRD1 | P8T-E | Human | Esophagus | ESCC | 6.24e-21 | 4.05e-01 | 0.0889 |
| 79901 | CYBRD1 | P9T-E | Human | Esophagus | ESCC | 1.19e-08 | 9.64e-02 | 0.1131 |
| 79901 | CYBRD1 | P10T-E | Human | Esophagus | ESCC | 4.94e-08 | 2.36e-01 | 0.116 |
| 79901 | CYBRD1 | P11T-E | Human | Esophagus | ESCC | 6.88e-05 | 7.79e-02 | 0.1426 |
| 79901 | CYBRD1 | P12T-E | Human | Esophagus | ESCC | 7.29e-15 | 2.30e-01 | 0.1122 |
| 79901 | CYBRD1 | P16T-E | Human | Esophagus | ESCC | 8.41e-16 | 1.07e-01 | 0.1153 |
| 79901 | CYBRD1 | P19T-E | Human | Esophagus | ESCC | 1.03e-04 | 1.52e-01 | 0.1662 |
| Page: 1 2 3 4 5 6 |
| Tissue | Expression Dynamics | Abbreviation |
| Breast | 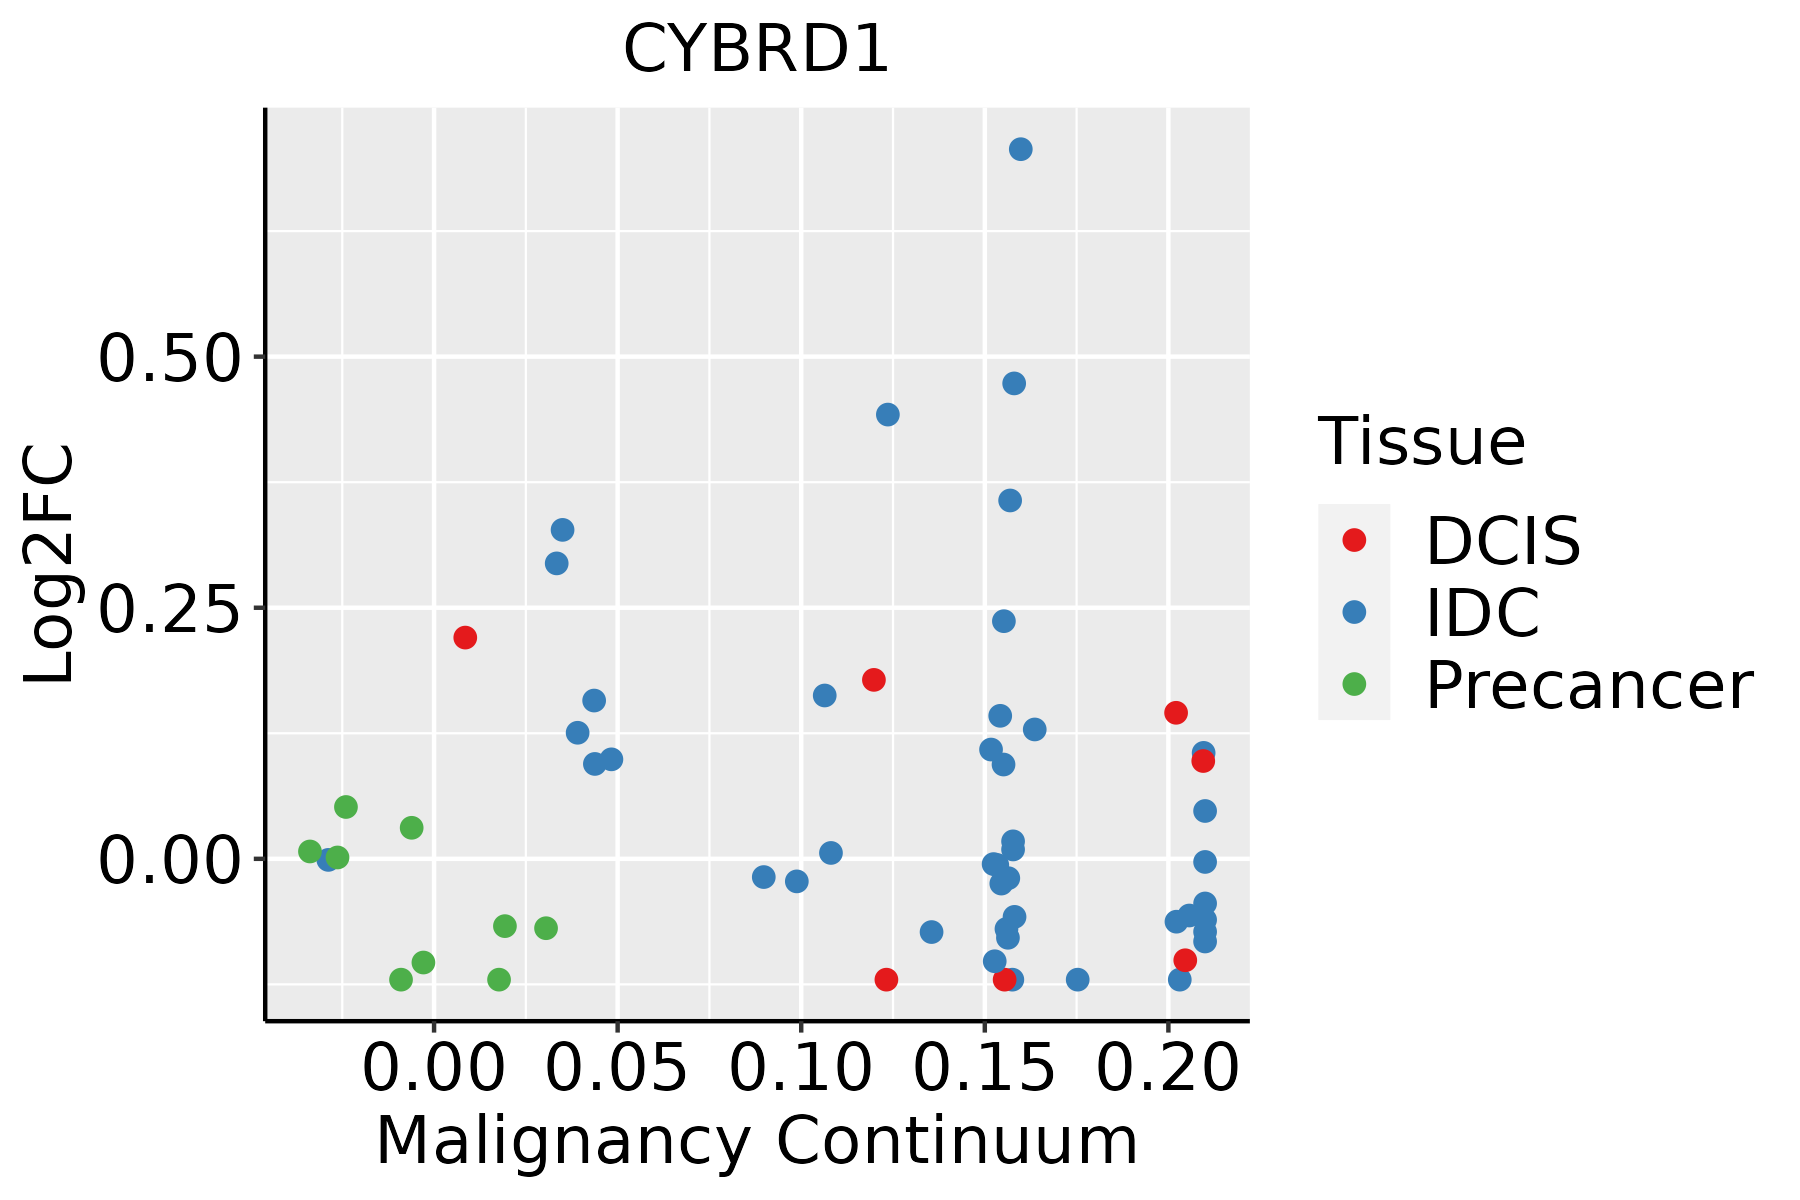 | IDC: Invasive ductal carcinoma |
| DCIS: Ductal carcinoma in situ | ||
| Precancer(BRCA1-mut): Precancerous lesion from BRCA1 mutation carriers | ||
| Esophagus | 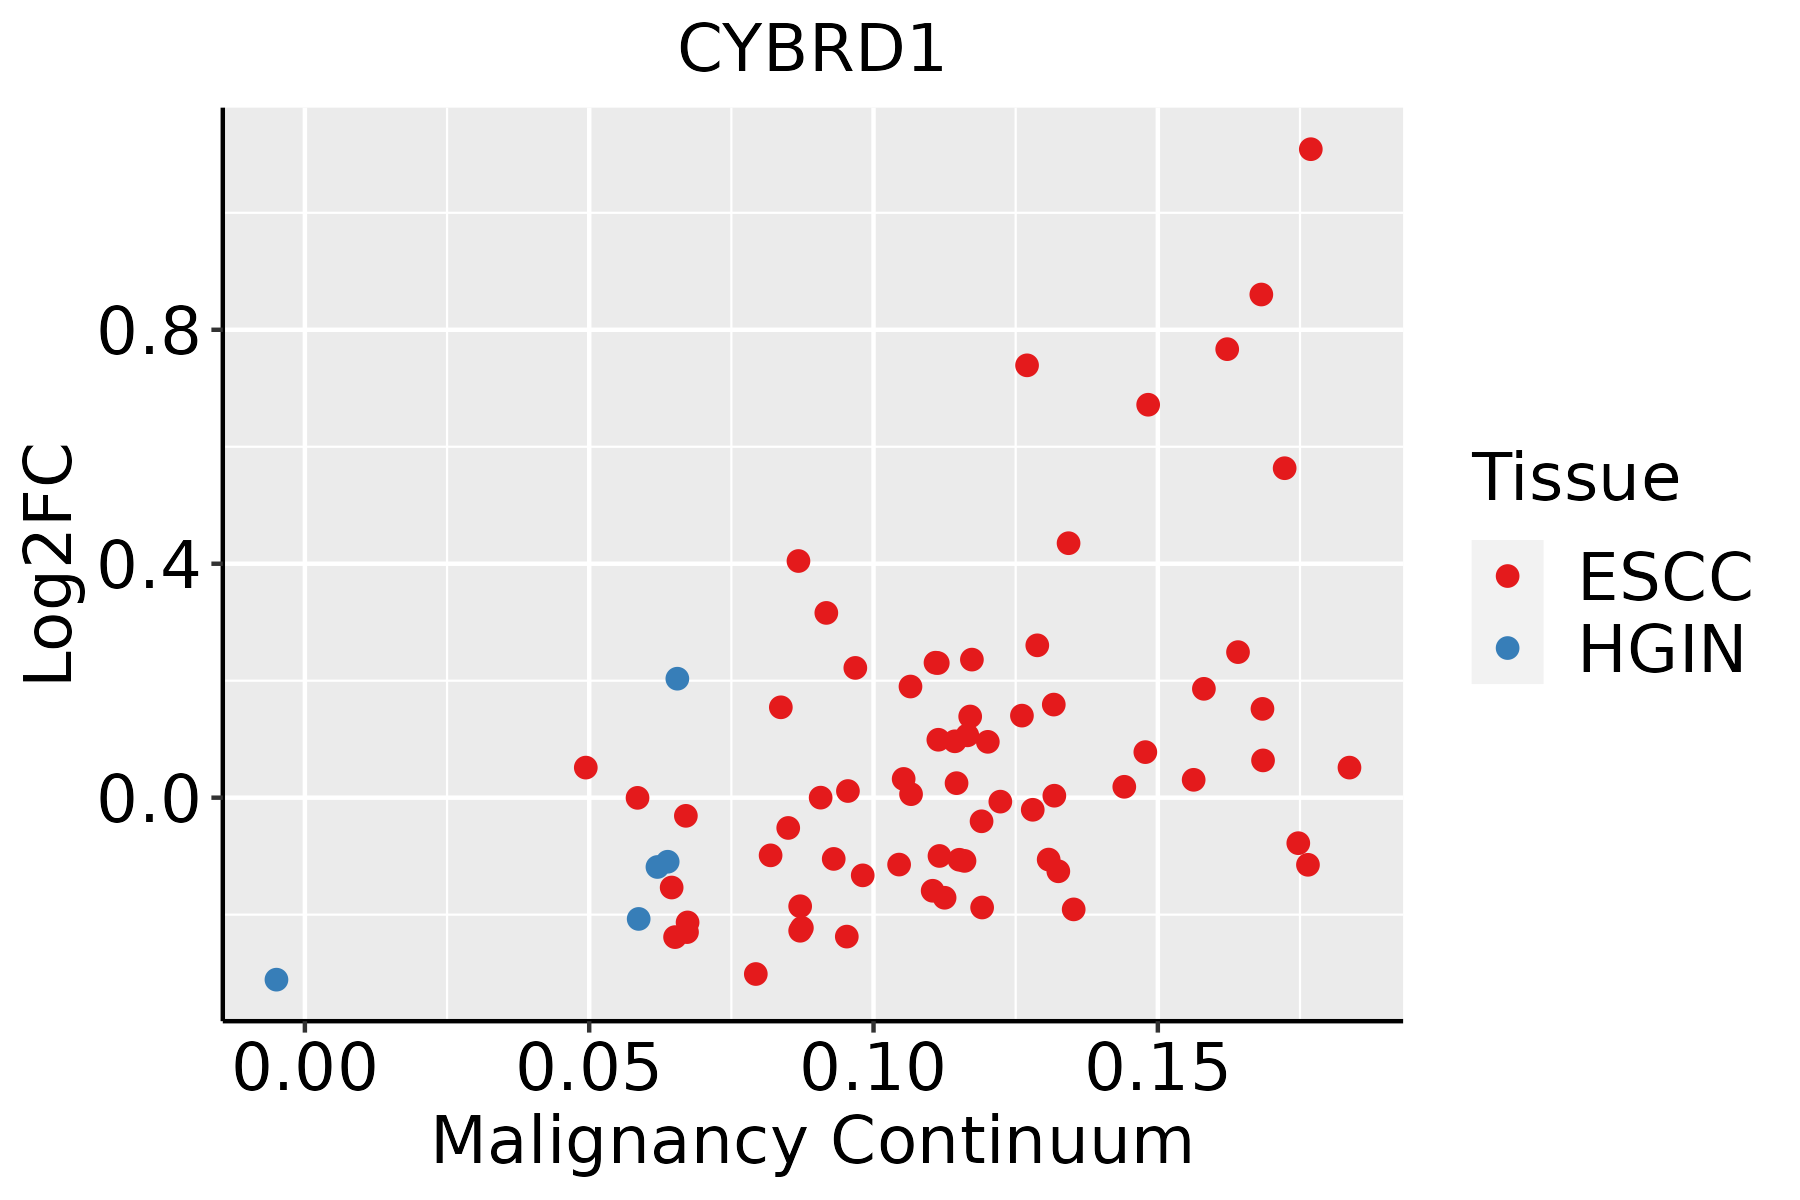 | ESCC: Esophageal squamous cell carcinoma |
| HGIN: High-grade intraepithelial neoplasias | ||
| LGIN: Low-grade intraepithelial neoplasias | ||
| Oral Cavity | 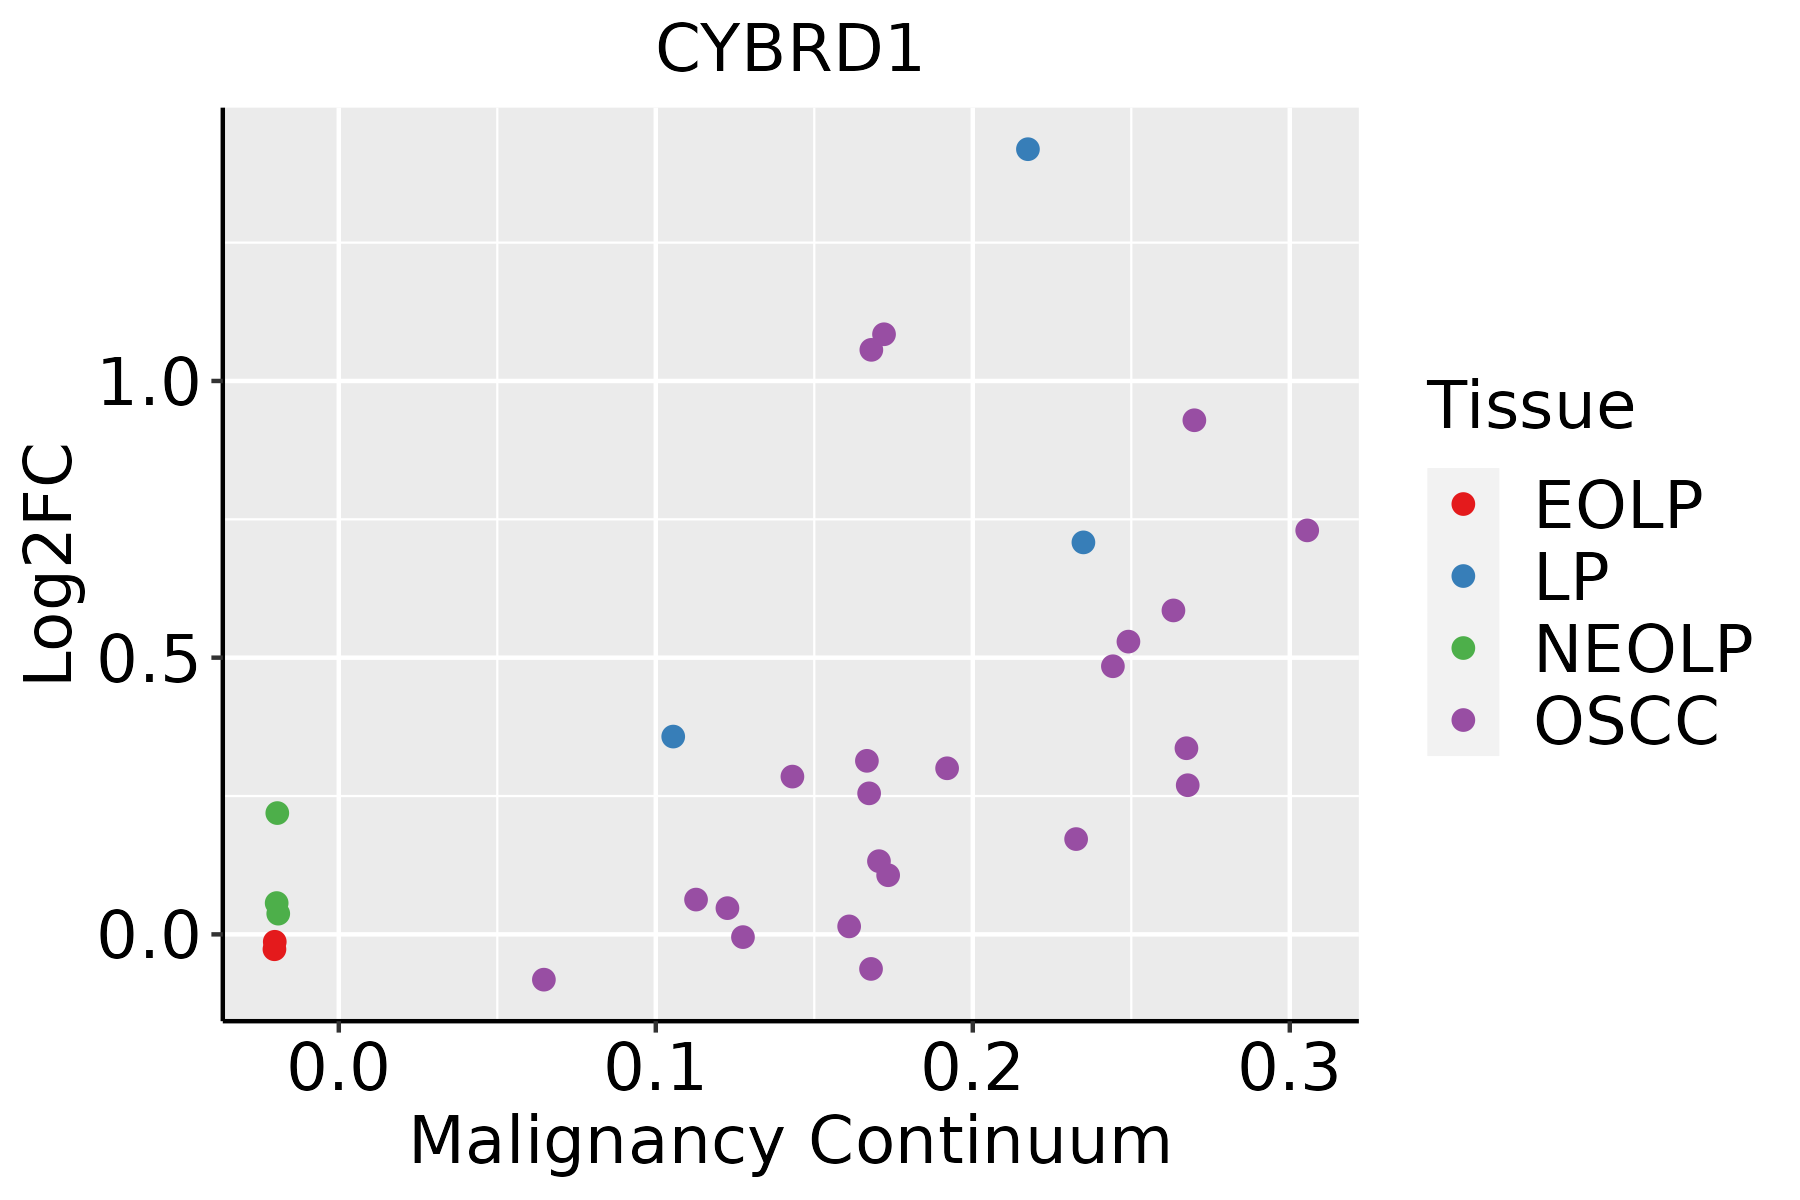 | EOLP: Erosive Oral lichen planus |
| LP: leukoplakia | ||
| NEOLP: Non-erosive oral lichen planus | ||
| OSCC: Oral squamous cell carcinoma | ||
| Prostate | 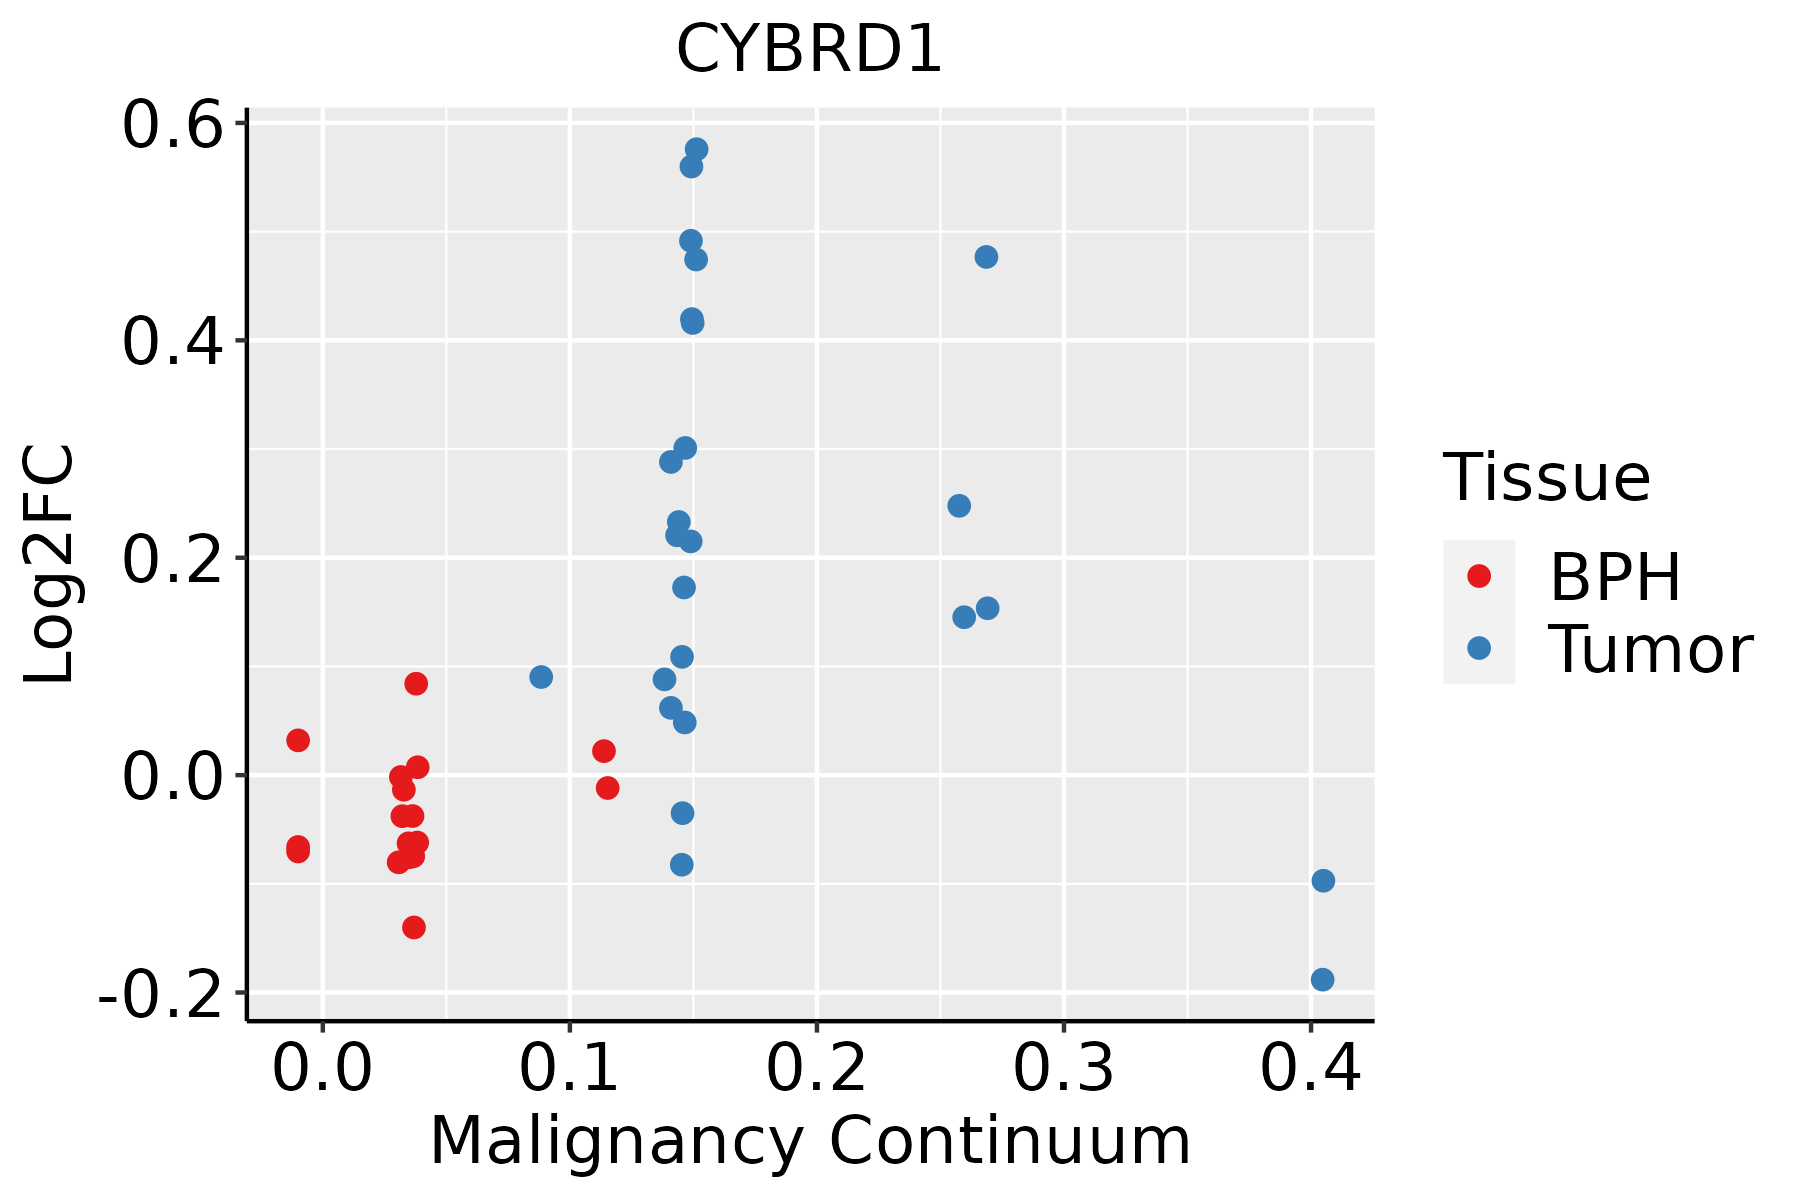 | BPH: Benign Prostatic Hyperplasia |
| Skin | 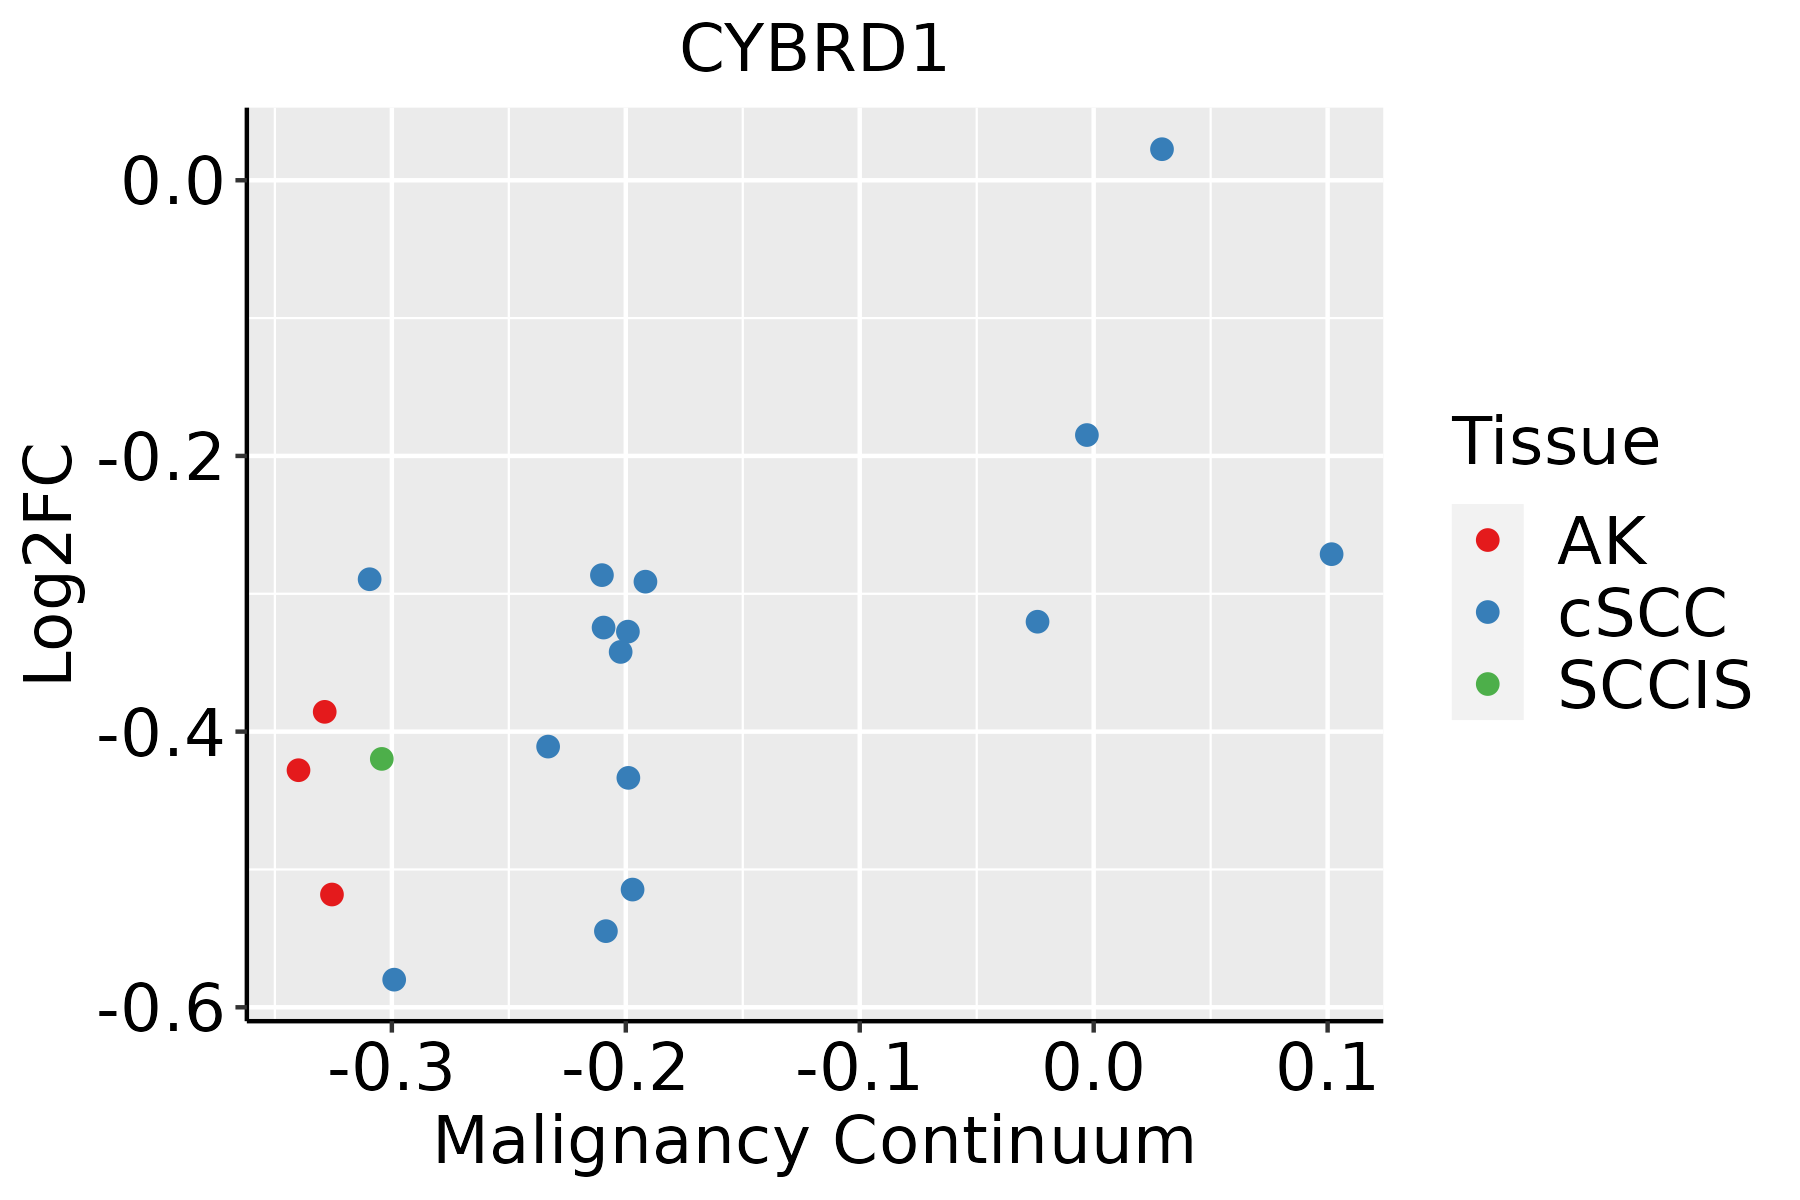 | AK: Actinic keratosis |
| cSCC: Cutaneous squamous cell carcinoma | ||
| SCCIS:squamous cell carcinoma in situ | ||
| Thyroid | 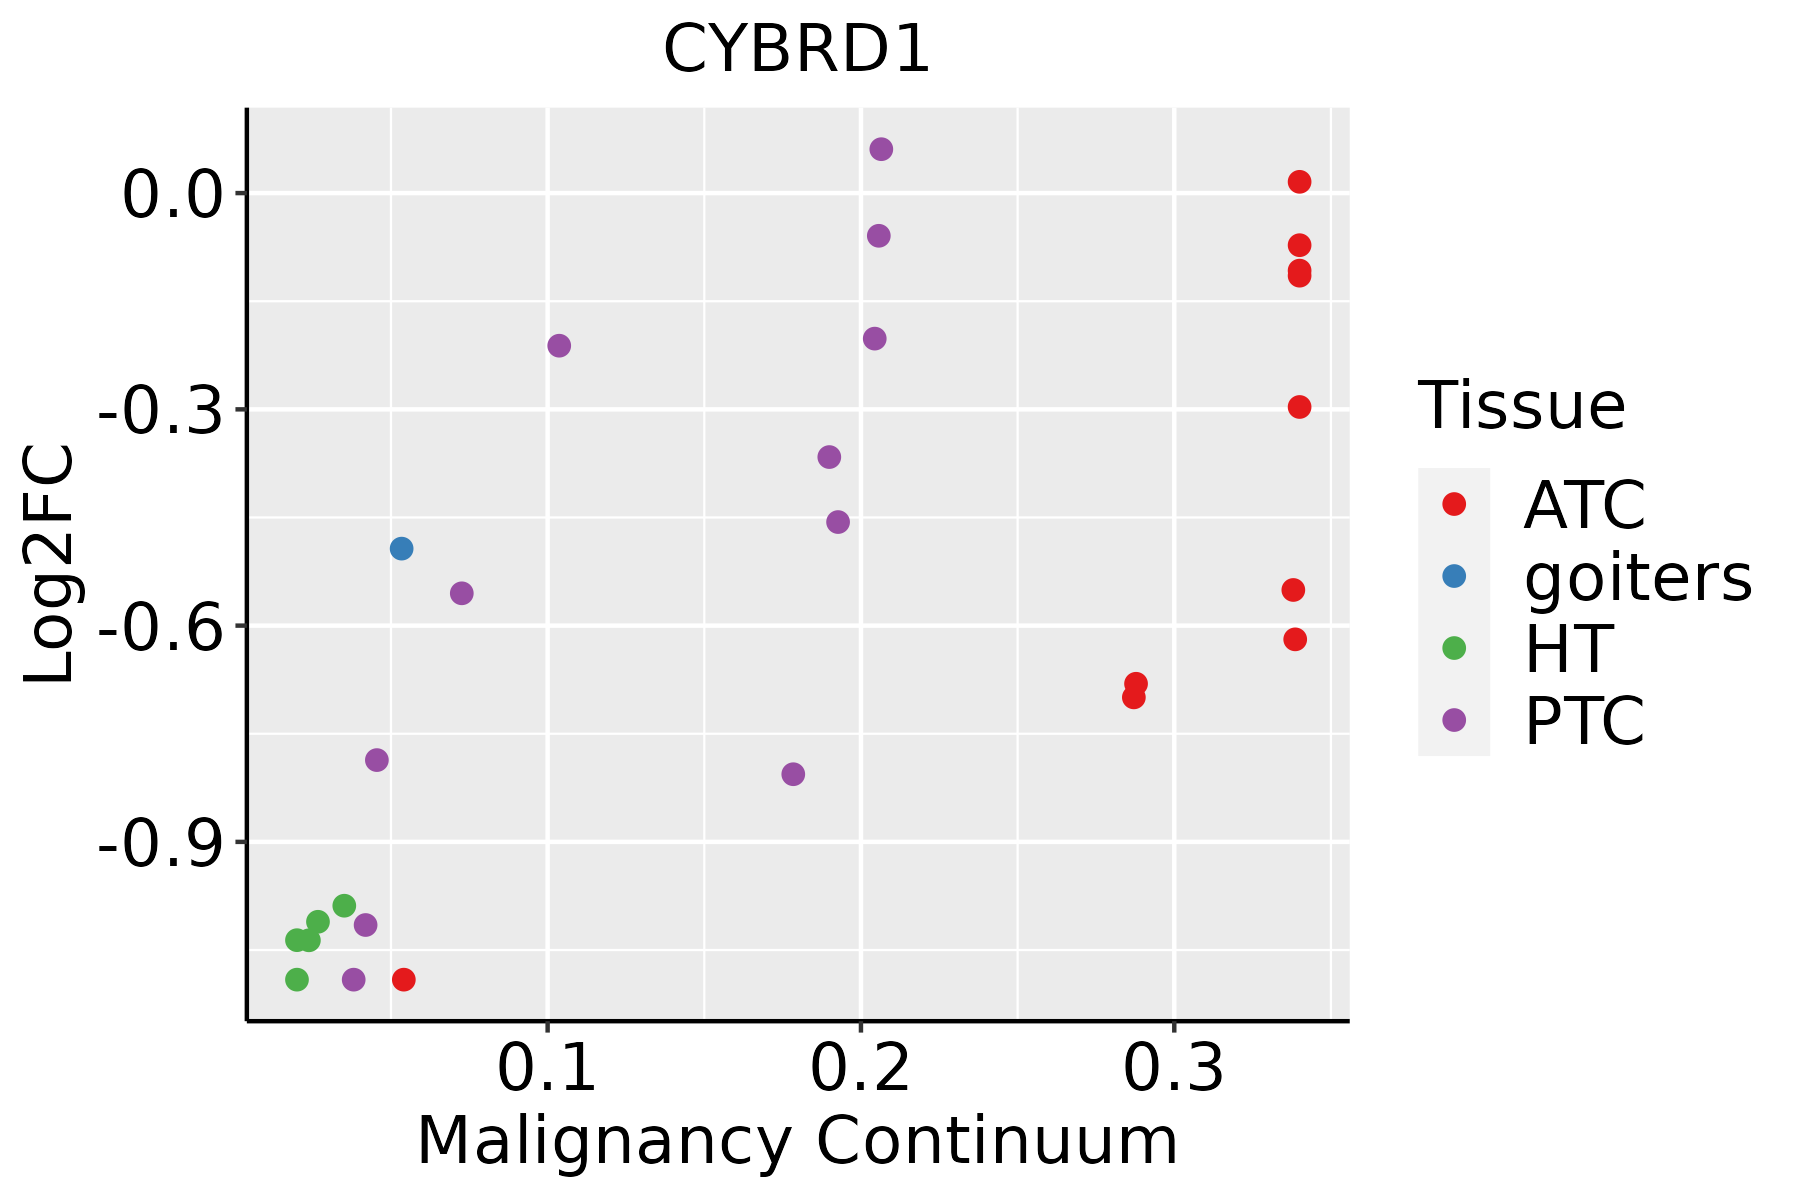 | ATC: Anaplastic thyroid cancer |
| HT: Hashimoto's thyroiditis | ||
| PTC: Papillary thyroid cancer |
| ∗log2FC in expression of this searched gene in stem-like cells from each diseased tissue sample relative to stem-like cells in normal samples in each tissue plotted against the malignancy continuum. Samples are colored based on if they are from different disease stage. |
Top |
Malignant transformation related pathway analysis |
| Find out the enriched GO biological processes and KEGG pathways involved in transition from healthy to precancer to cancer |
| Tissue | Disease Stage | Enriched GO biological Processes |
| Colorectum | AD |  |
| Colorectum | SER |  |
| Colorectum | MSS |  |
| Colorectum | MSI-H |  |
| Colorectum | FAP |  |
| ∗Top 15 enriched GO BP terms are showed in the bar plot of each disease state in each tissue. Each row represents a significant GO biological process which is colored according to the -log10(p.adjust). |
| Page: 1 2 3 4 5 6 7 8 9 |
| GO ID | Tissue | Disease Stage | Description | Gene Ratio | Bg Ratio | pvalue | p.adjust | Count |
| GO:001003814 | Breast | IDC | response to metal ion | 65/1434 | 373/18723 | 2.95e-10 | 3.42e-08 | 65 |
| GO:005507613 | Breast | IDC | transition metal ion homeostasis | 23/1434 | 138/18723 | 3.20e-04 | 4.79e-03 | 23 |
| GO:004691612 | Breast | IDC | cellular transition metal ion homeostasis | 20/1434 | 115/18723 | 4.35e-04 | 5.90e-03 | 20 |
| GO:0010039 | Breast | IDC | response to iron ion | 8/1434 | 32/18723 | 2.32e-03 | 2.10e-02 | 8 |
| GO:000682611 | Breast | IDC | iron ion transport | 11/1434 | 58/18723 | 4.10e-03 | 3.25e-02 | 11 |
| GO:005507212 | Breast | IDC | iron ion homeostasis | 14/1434 | 85/18723 | 4.98e-03 | 3.77e-02 | 14 |
| GO:001003824 | Breast | DCIS | response to metal ion | 65/1390 | 373/18723 | 8.03e-11 | 9.88e-09 | 65 |
| GO:005507622 | Breast | DCIS | transition metal ion homeostasis | 23/1390 | 138/18723 | 2.04e-04 | 3.27e-03 | 23 |
| GO:004691621 | Breast | DCIS | cellular transition metal ion homeostasis | 20/1390 | 115/18723 | 2.91e-04 | 4.27e-03 | 20 |
| GO:00100391 | Breast | DCIS | response to iron ion | 8/1390 | 32/18723 | 1.90e-03 | 1.81e-02 | 8 |
| GO:000682621 | Breast | DCIS | iron ion transport | 11/1390 | 58/18723 | 3.23e-03 | 2.73e-02 | 11 |
| GO:005507221 | Breast | DCIS | iron ion homeostasis | 14/1390 | 85/18723 | 3.78e-03 | 3.03e-02 | 14 |
| GO:005507617 | Esophagus | ESCC | transition metal ion homeostasis | 87/8552 | 138/18723 | 2.85e-05 | 2.37e-04 | 87 |
| GO:001003827 | Esophagus | ESCC | response to metal ion | 208/8552 | 373/18723 | 5.02e-05 | 3.90e-04 | 208 |
| GO:00469169 | Esophagus | ESCC | cellular transition metal ion homeostasis | 70/8552 | 115/18723 | 7.28e-04 | 3.79e-03 | 70 |
| GO:00550729 | Esophagus | ESCC | iron ion homeostasis | 52/8552 | 85/18723 | 2.86e-03 | 1.21e-02 | 52 |
| GO:005507610 | Oral cavity | OSCC | transition metal ion homeostasis | 81/7305 | 138/18723 | 2.13e-06 | 2.72e-05 | 81 |
| GO:001003820 | Oral cavity | OSCC | response to metal ion | 188/7305 | 373/18723 | 4.34e-06 | 5.00e-05 | 188 |
| GO:00469168 | Oral cavity | OSCC | cellular transition metal ion homeostasis | 64/7305 | 115/18723 | 2.13e-04 | 1.40e-03 | 64 |
| GO:00550728 | Oral cavity | OSCC | iron ion homeostasis | 46/7305 | 85/18723 | 3.31e-03 | 1.42e-02 | 46 |
| Page: 1 2 3 |
| Pathway ID | Tissue | Disease Stage | Description | Gene Ratio | Bg Ratio | pvalue | p.adjust | qvalue | Count |
| hsa0497814 | Prostate | BPH | Mineral absorption | 20/1718 | 60/8465 | 1.22e-02 | 3.61e-02 | 2.23e-02 | 20 |
| hsa0497815 | Prostate | BPH | Mineral absorption | 20/1718 | 60/8465 | 1.22e-02 | 3.61e-02 | 2.23e-02 | 20 |
| Page: 1 |
Top |
Cell-cell communication analysis |
| Identification of potential cell-cell interactions between two cell types and their ligand-receptor pairs for different disease states |
| Ligand | Receptor | LRpair | Pathway | Tissue | Disease Stage |
| Page: 1 |
Top |
Single-cell gene regulatory network inference analysis |
| Find out the significant the regulons (TFs) and the target genes of each regulon across cell types for different disease states |
| TF | Cell Type | Tissue | Disease Stage | Target Gene | RSS | Regulon Activity |
| ∗The dot plots of a searched regulon are shown for all cell subpopulations in each disease state of each tissue based on the regulon specific score inferred using pySCENIC and by calculating the average expression. |
| Page: 1 |
Top |
Somatic mutation of malignant transformation related genes |
| Annotation of somatic variants for genes involved in malignant transformation |
| Hugo Symbol | Variant Class | Variant Classification | dbSNP RS | HGVSc | HGVSp | HGVSp Short | SWISSPROT | BIOTYPE | SIFT | PolyPhen | Tumor Sample Barcode | Tissue | Histology | Sex | Age | Stage | Therapy Types | Drugs | Outcome |
| CYBRD1 | SNV | Missense_Mutation | c.787N>C | p.Glu263Gln | p.E263Q | Q53TN4 | protein_coding | deleterious(0.03) | benign(0.307) | TCGA-AC-A23H-01 | Breast | breast invasive carcinoma | Female | >=65 | I/II | Unknown | Unknown | PD | |
| CYBRD1 | SNV | Missense_Mutation | c.827C>T | p.Ala276Val | p.A276V | Q53TN4 | protein_coding | tolerated_low_confidence(0.15) | benign(0.01) | TCGA-AO-A1KR-01 | Breast | breast invasive carcinoma | Female | <65 | I/II | Chemotherapy | cyclophosphamide | SD | |
| CYBRD1 | SNV | Missense_Mutation | novel | c.676C>T | p.Arg226Cys | p.R226C | Q53TN4 | protein_coding | deleterious(0) | probably_damaging(1) | TCGA-2W-A8YY-01 | Cervix | cervical & endocervical cancer | Female | <65 | I/II | Chemotherapy | cisplatin | CR |
| CYBRD1 | SNV | Missense_Mutation | c.21N>T | p.Trp7Cys | p.W7C | Q53TN4 | protein_coding | tolerated(0.18) | benign(0) | TCGA-A6-5661-01 | Colorectum | colon adenocarcinoma | Female | >=65 | I/II | Unknown | Unknown | SD | |
| CYBRD1 | SNV | Missense_Mutation | c.530G>A | p.Gly177Glu | p.G177E | Q53TN4 | protein_coding | deleterious(0.02) | probably_damaging(1) | TCGA-AA-3710-01 | Colorectum | colon adenocarcinoma | Female | >=65 | I/II | Unknown | Unknown | SD | |
| CYBRD1 | SNV | Missense_Mutation | novel | c.256N>A | p.His86Asn | p.H86N | Q53TN4 | protein_coding | deleterious(0) | probably_damaging(0.999) | TCGA-AG-A002-01 | Colorectum | rectum adenocarcinoma | Male | <65 | I/II | Unknown | Unknown | SD |
| CYBRD1 | SNV | Missense_Mutation | novel | c.225N>T | p.Trp75Cys | p.W75C | Q53TN4 | protein_coding | deleterious(0) | probably_damaging(0.999) | TCGA-A5-A2K5-01 | Endometrium | uterine corpus endometrioid carcinoma | Female | >=65 | I/II | Unknown | Unknown | SD |
| CYBRD1 | SNV | Missense_Mutation | c.474N>G | p.Ile158Met | p.I158M | Q53TN4 | protein_coding | tolerated(0.05) | benign(0.079) | TCGA-AP-A0LM-01 | Endometrium | uterine corpus endometrioid carcinoma | Female | <65 | III/IV | Chemotherapy | cisplatin | SD | |
| CYBRD1 | SNV | Missense_Mutation | c.549N>G | p.Ile183Met | p.I183M | Q53TN4 | protein_coding | deleterious(0.03) | possibly_damaging(0.718) | TCGA-AX-A05Z-01 | Endometrium | uterine corpus endometrioid carcinoma | Female | <65 | III/IV | Chemotherapy | adriamycin | SD | |
| CYBRD1 | SNV | Missense_Mutation | novel | c.562G>T | p.Asp188Tyr | p.D188Y | Q53TN4 | protein_coding | deleterious(0.02) | benign(0) | TCGA-B5-A1MR-01 | Endometrium | uterine corpus endometrioid carcinoma | Female | >=65 | III/IV | Unknown | Unknown | SD |
| Page: 1 2 3 4 |
Top |
Related drugs of malignant transformation related genes |
| Identification of chemicals and drugs interact with genes involved in malignant transfromation |
| (DGIdb 4.0) |
| Entrez ID | Symbol | Category | Interaction Types | Drug Claim Name | Drug Name | PMIDs |
| Page: 1 |

Copyright 2023-Present -The University of Texas Health Science Center at Houston |