
|
|||||
|
 | |
| |
| |
| |
| |
| |
|
Gene: CYB5R3 |
Gene summary for CYB5R3 |
| Gene information | Species | Human | Gene symbol | CYB5R3 | Gene ID | 1727 |
| Gene name | cytochrome b5 reductase 3 | |
| Gene Alias | B5R | |
| Cytomap | 22q13.2 | |
| Gene Type | protein-coding | GO ID | GO:0003008 | UniProtAcc | P00387 |
Top |
Malignant transformation analysis |
| Identification of the aberrant gene expression in precancerous and cancerous lesions by comparing the gene expression of stem-like cells in diseased tissues with normal stem cells |
| Entrez ID | Symbol | Replicates | Species | Organ | Tissue | Adj P-value | Log2FC | Malignancy |
| 1727 | CYB5R3 | HTA11_3410_2000001011 | Human | Colorectum | AD | 2.38e-04 | 1.47e-01 | 0.0155 |
| 1727 | CYB5R3 | HTA11_2487_2000001011 | Human | Colorectum | SER | 1.46e-27 | 1.03e+00 | -0.1808 |
| 1727 | CYB5R3 | HTA11_2951_2000001011 | Human | Colorectum | AD | 1.16e-02 | 4.44e-01 | 0.0216 |
| 1727 | CYB5R3 | HTA11_1938_2000001011 | Human | Colorectum | AD | 5.21e-10 | 5.46e-01 | -0.0811 |
| 1727 | CYB5R3 | HTA11_78_2000001011 | Human | Colorectum | AD | 4.72e-05 | 3.17e-01 | -0.1088 |
| 1727 | CYB5R3 | HTA11_347_2000001011 | Human | Colorectum | AD | 2.34e-32 | 7.27e-01 | -0.1954 |
| 1727 | CYB5R3 | HTA11_411_2000001011 | Human | Colorectum | SER | 2.39e-10 | 1.53e+00 | -0.2602 |
| 1727 | CYB5R3 | HTA11_2112_2000001011 | Human | Colorectum | SER | 8.16e-10 | 8.88e-01 | -0.2196 |
| 1727 | CYB5R3 | HTA11_3361_2000001011 | Human | Colorectum | AD | 2.17e-09 | 5.01e-01 | -0.1207 |
| 1727 | CYB5R3 | HTA11_83_2000001011 | Human | Colorectum | SER | 1.26e-02 | 3.56e-01 | -0.1526 |
| 1727 | CYB5R3 | HTA11_696_2000001011 | Human | Colorectum | AD | 5.94e-24 | 6.85e-01 | -0.1464 |
| 1727 | CYB5R3 | HTA11_866_2000001011 | Human | Colorectum | AD | 1.62e-11 | 4.60e-01 | -0.1001 |
| 1727 | CYB5R3 | HTA11_1391_2000001011 | Human | Colorectum | AD | 2.05e-16 | 6.22e-01 | -0.059 |
| 1727 | CYB5R3 | HTA11_2992_2000001011 | Human | Colorectum | SER | 4.96e-11 | 9.38e-01 | -0.1706 |
| 1727 | CYB5R3 | HTA11_5212_2000001011 | Human | Colorectum | AD | 2.09e-02 | 4.33e-01 | -0.2061 |
| 1727 | CYB5R3 | HTA11_546_2000001011 | Human | Colorectum | AD | 2.40e-06 | 5.72e-01 | -0.0842 |
| 1727 | CYB5R3 | HTA11_7862_2000001011 | Human | Colorectum | AD | 2.56e-04 | 3.56e-01 | -0.0179 |
| 1727 | CYB5R3 | HTA11_866_3004761011 | Human | Colorectum | AD | 1.59e-08 | 4.16e-01 | 0.096 |
| 1727 | CYB5R3 | HTA11_4255_2000001011 | Human | Colorectum | SER | 3.45e-04 | 6.50e-01 | 0.0446 |
| 1727 | CYB5R3 | HTA11_8622_2000001021 | Human | Colorectum | SER | 3.05e-03 | 4.70e-01 | 0.0528 |
| Page: 1 2 3 4 5 6 7 8 9 |
| Tissue | Expression Dynamics | Abbreviation |
| Colorectum (GSE201348) |  | FAP: Familial adenomatous polyposis |
| CRC: Colorectal cancer | ||
| Colorectum (HTA11) |  | AD: Adenomas |
| SER: Sessile serrated lesions | ||
| MSI-H: Microsatellite-high colorectal cancer | ||
| MSS: Microsatellite stable colorectal cancer | ||
| Esophagus | 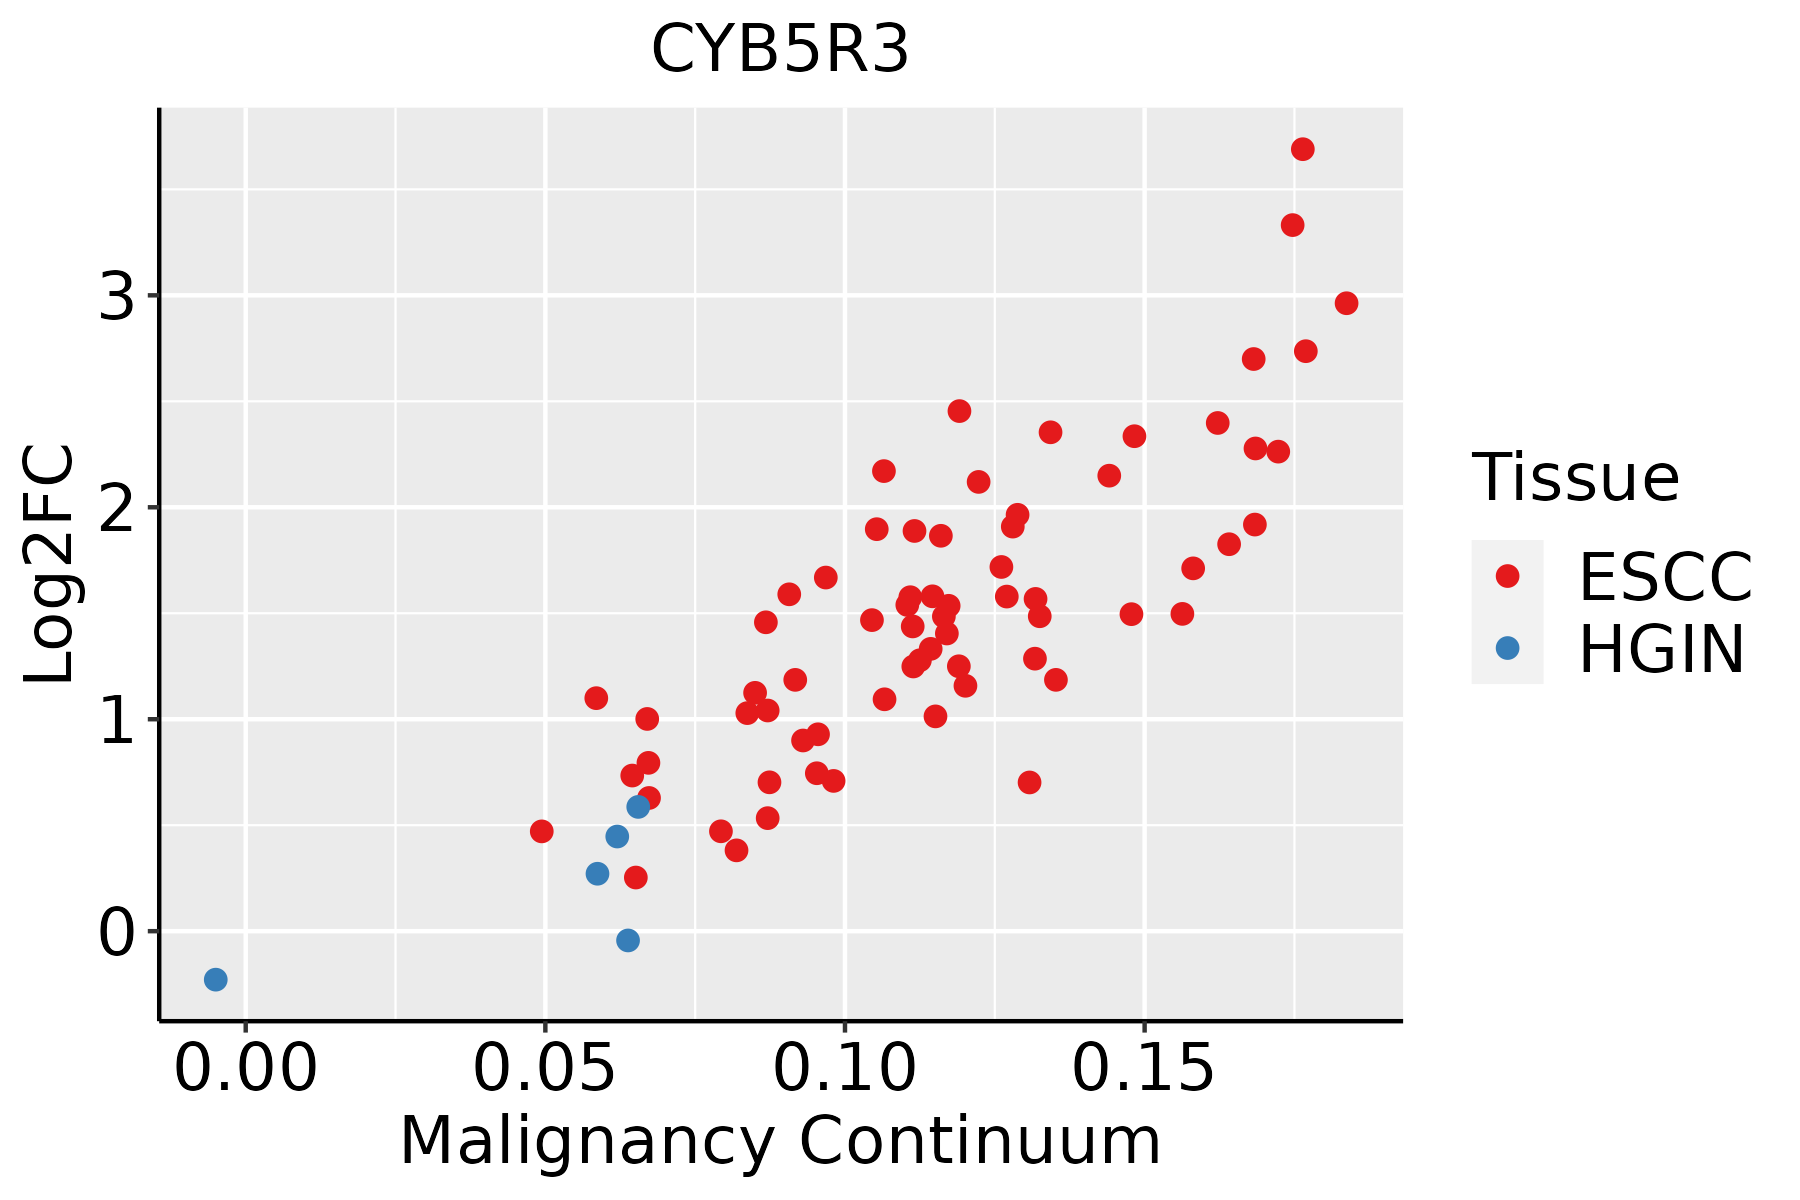 | ESCC: Esophageal squamous cell carcinoma |
| HGIN: High-grade intraepithelial neoplasias | ||
| LGIN: Low-grade intraepithelial neoplasias | ||
| Liver |  | HCC: Hepatocellular carcinoma |
| NAFLD: Non-alcoholic fatty liver disease | ||
| Oral Cavity |  | EOLP: Erosive Oral lichen planus |
| LP: leukoplakia | ||
| NEOLP: Non-erosive oral lichen planus | ||
| OSCC: Oral squamous cell carcinoma | ||
| Skin |  | AK: Actinic keratosis |
| cSCC: Cutaneous squamous cell carcinoma | ||
| SCCIS:squamous cell carcinoma in situ | ||
| Thyroid |  | ATC: Anaplastic thyroid cancer |
| HT: Hashimoto's thyroiditis | ||
| PTC: Papillary thyroid cancer |
| ∗log2FC in expression of this searched gene in stem-like cells from each diseased tissue sample relative to stem-like cells in normal samples in each tissue plotted against the malignancy continuum. Samples are colored based on if they are from different disease stage. |
Top |
Malignant transformation related pathway analysis |
| Find out the enriched GO biological processes and KEGG pathways involved in transition from healthy to precancer to cancer |
| Tissue | Disease Stage | Enriched GO biological Processes |
| Colorectum | AD |  |
| Colorectum | SER |  |
| Colorectum | MSS |  |
| Colorectum | MSI-H |  |
| Colorectum | FAP |  |
| ∗Top 15 enriched GO BP terms are showed in the bar plot of each disease state in each tissue. Each row represents a significant GO biological process which is colored according to the -log10(p.adjust). |
| Page: 1 2 3 4 5 6 7 8 9 |
| GO ID | Tissue | Disease Stage | Description | Gene Ratio | Bg Ratio | pvalue | p.adjust | Count |
| GO:0006066 | Colorectum | AD | alcohol metabolic process | 106/3918 | 353/18723 | 3.02e-05 | 5.57e-04 | 106 |
| GO:0006809 | Colorectum | AD | nitric oxide biosynthetic process | 30/3918 | 76/18723 | 1.72e-04 | 2.33e-03 | 30 |
| GO:0046209 | Colorectum | AD | nitric oxide metabolic process | 31/3918 | 81/18723 | 2.61e-04 | 3.25e-03 | 31 |
| GO:2001057 | Colorectum | AD | reactive nitrogen species metabolic process | 31/3918 | 82/18723 | 3.37e-04 | 3.94e-03 | 31 |
| GO:0008202 | Colorectum | AD | steroid metabolic process | 85/3918 | 319/18723 | 8.07e-03 | 4.75e-02 | 85 |
| GO:00068091 | Colorectum | SER | nitric oxide biosynthetic process | 27/2897 | 76/18723 | 1.38e-05 | 4.28e-04 | 27 |
| GO:00462091 | Colorectum | SER | nitric oxide metabolic process | 28/2897 | 81/18723 | 1.73e-05 | 5.15e-04 | 28 |
| GO:20010571 | Colorectum | SER | reactive nitrogen species metabolic process | 28/2897 | 82/18723 | 2.24e-05 | 6.43e-04 | 28 |
| GO:00060661 | Colorectum | SER | alcohol metabolic process | 79/2897 | 353/18723 | 3.50e-04 | 5.50e-03 | 79 |
| GO:00060662 | Colorectum | MSS | alcohol metabolic process | 92/3467 | 353/18723 | 2.57e-04 | 3.46e-03 | 92 |
| GO:00068092 | Colorectum | FAP | nitric oxide biosynthetic process | 22/2622 | 76/18723 | 5.36e-04 | 6.06e-03 | 22 |
| GO:00462092 | Colorectum | FAP | nitric oxide metabolic process | 23/2622 | 81/18723 | 5.48e-04 | 6.15e-03 | 23 |
| GO:20010572 | Colorectum | FAP | reactive nitrogen species metabolic process | 23/2622 | 82/18723 | 6.62e-04 | 7.21e-03 | 23 |
| GO:00060663 | Colorectum | FAP | alcohol metabolic process | 69/2622 | 353/18723 | 2.29e-03 | 1.85e-02 | 69 |
| GO:00060668 | Esophagus | ESCC | alcohol metabolic process | 202/8552 | 353/18723 | 7.32e-06 | 7.26e-05 | 202 |
| GO:00161263 | Esophagus | ESCC | sterol biosynthetic process | 46/8552 | 64/18723 | 1.91e-05 | 1.67e-04 | 46 |
| GO:00066953 | Esophagus | ESCC | cholesterol biosynthetic process | 41/8552 | 57/18723 | 5.25e-05 | 4.06e-04 | 41 |
| GO:19026533 | Esophagus | ESCC | secondary alcohol biosynthetic process | 41/8552 | 57/18723 | 5.25e-05 | 4.06e-04 | 41 |
| GO:19026524 | Esophagus | ESCC | secondary alcohol metabolic process | 87/8552 | 147/18723 | 6.58e-04 | 3.50e-03 | 87 |
| GO:00461653 | Esophagus | ESCC | alcohol biosynthetic process | 83/8552 | 140/18723 | 8.04e-04 | 4.16e-03 | 83 |
| Page: 1 2 3 4 5 |
| Pathway ID | Tissue | Disease Stage | Description | Gene Ratio | Bg Ratio | pvalue | p.adjust | qvalue | Count |
| hsa005202 | Esophagus | ESCC | Amino sugar and nucleotide sugar metabolism | 35/4205 | 49/8465 | 1.60e-03 | 4.88e-03 | 2.50e-03 | 35 |
| hsa0052011 | Esophagus | ESCC | Amino sugar and nucleotide sugar metabolism | 35/4205 | 49/8465 | 1.60e-03 | 4.88e-03 | 2.50e-03 | 35 |
| hsa00520 | Oral cavity | OSCC | Amino sugar and nucleotide sugar metabolism | 34/3704 | 49/8465 | 2.48e-04 | 8.08e-04 | 4.11e-04 | 34 |
| hsa005201 | Oral cavity | OSCC | Amino sugar and nucleotide sugar metabolism | 34/3704 | 49/8465 | 2.48e-04 | 8.08e-04 | 4.11e-04 | 34 |
| Page: 1 |
Top |
Cell-cell communication analysis |
| Identification of potential cell-cell interactions between two cell types and their ligand-receptor pairs for different disease states |
| Ligand | Receptor | LRpair | Pathway | Tissue | Disease Stage |
| Page: 1 |
Top |
Single-cell gene regulatory network inference analysis |
| Find out the significant the regulons (TFs) and the target genes of each regulon across cell types for different disease states |
| TF | Cell Type | Tissue | Disease Stage | Target Gene | RSS | Regulon Activity |
| ∗The dot plots of a searched regulon are shown for all cell subpopulations in each disease state of each tissue based on the regulon specific score inferred using pySCENIC and by calculating the average expression. |
| Page: 1 |
Top |
Somatic mutation of malignant transformation related genes |
| Annotation of somatic variants for genes involved in malignant transformation |
| Hugo Symbol | Variant Class | Variant Classification | dbSNP RS | HGVSc | HGVSp | HGVSp Short | SWISSPROT | BIOTYPE | SIFT | PolyPhen | Tumor Sample Barcode | Tissue | Histology | Sex | Age | Stage | Therapy Types | Drugs | Outcome |
| CYB5R3 | SNV | Missense_Mutation | rs769788490 | c.875N>A | p.Arg292Gln | p.R292Q | P00387 | protein_coding | tolerated(0.13) | benign(0.031) | TCGA-VS-A9UI-01 | Cervix | cervical & endocervical cancer | Female | >=65 | I/II | Unknown | Unknown | SD |
| CYB5R3 | SNV | Missense_Mutation | rs201232518 | c.635C>T | p.Ala212Val | p.A212V | P00387 | protein_coding | deleterious(0) | probably_damaging(0.999) | TCGA-AM-5821-01 | Colorectum | colon adenocarcinoma | Female | >=65 | I/II | Unknown | Unknown | SD |
| CYB5R3 | SNV | Missense_Mutation | c.731N>G | p.Gln244Arg | p.Q244R | P00387 | protein_coding | tolerated(0.24) | probably_damaging(0.997) | TCGA-DM-A28A-01 | Colorectum | colon adenocarcinoma | Male | >=65 | III/IV | Unknown | Unknown | SD | |
| CYB5R3 | SNV | Missense_Mutation | c.213N>A | p.Ser71Arg | p.S71R | P00387 | protein_coding | deleterious(0) | benign(0.28) | TCGA-DM-A28F-01 | Colorectum | colon adenocarcinoma | Male | >=65 | III/IV | Unknown | Unknown | SD | |
| CYB5R3 | SNV | Missense_Mutation | c.169N>G | p.Met57Val | p.M57V | P00387 | protein_coding | tolerated(0.49) | benign(0.009) | TCGA-EI-6507-01 | Colorectum | rectum adenocarcinoma | Male | <65 | I/II | Unknown | Unknown | SD | |
| CYB5R3 | SNV | Missense_Mutation | novel | c.827N>A | p.Pro276His | p.P276H | P00387 | protein_coding | deleterious(0.01) | probably_damaging(0.991) | TCGA-A5-A1OF-01 | Endometrium | uterine corpus endometrioid carcinoma | Female | <65 | I/II | Unknown | Unknown | SD |
| CYB5R3 | SNV | Missense_Mutation | c.504G>T | p.Gln168His | p.Q168H | P00387 | protein_coding | deleterious(0.01) | benign(0.369) | TCGA-AP-A059-01 | Endometrium | uterine corpus endometrioid carcinoma | Female | >=65 | I/II | Unknown | Unknown | SD | |
| CYB5R3 | SNV | Missense_Mutation | c.475A>G | p.Lys159Glu | p.K159E | P00387 | protein_coding | deleterious(0) | probably_damaging(0.996) | TCGA-AP-A0LM-01 | Endometrium | uterine corpus endometrioid carcinoma | Female | <65 | III/IV | Chemotherapy | cisplatin | SD | |
| CYB5R3 | SNV | Missense_Mutation | novel | c.43A>G | p.Ile15Val | p.I15V | P00387 | protein_coding | tolerated_low_confidence(0.05) | benign(0) | TCGA-AP-A0LM-01 | Endometrium | uterine corpus endometrioid carcinoma | Female | <65 | III/IV | Chemotherapy | cisplatin | SD |
| CYB5R3 | SNV | Missense_Mutation | novel | c.950N>A | p.Cys317Tyr | p.C317Y | P00387 | protein_coding | deleterious(0) | probably_damaging(0.983) | TCGA-AX-A1CE-01 | Endometrium | uterine corpus endometrioid carcinoma | Female | <65 | I/II | Unspecific | Paclitaxel | SD |
| Page: 1 2 3 4 |
Top |
Related drugs of malignant transformation related genes |
| Identification of chemicals and drugs interact with genes involved in malignant transfromation |
| (DGIdb 4.0) |
| Entrez ID | Symbol | Category | Interaction Types | Drug Claim Name | Drug Name | PMIDs |
| 1727 | CYB5R3 | DRUGGABLE GENOME, ENZYME | methylene blue | |||
| 1727 | CYB5R3 | DRUGGABLE GENOME, ENZYME | primaquine | PRIMAQUINE | 25058800 | |
| 1727 | CYB5R3 | DRUGGABLE GENOME, ENZYME | mepivacaine | MEPIVACAINE | ||
| 1727 | CYB5R3 | DRUGGABLE GENOME, ENZYME | sodium nitrite | |||
| 1727 | CYB5R3 | DRUGGABLE GENOME, ENZYME | isosorbide mononitrate | |||
| 1727 | CYB5R3 | DRUGGABLE GENOME, ENZYME | chloroprocaine | CHLOROPROCAINE | ||
| 1727 | CYB5R3 | DRUGGABLE GENOME, ENZYME | metoclopramide | METOCLOPRAMIDE | 11418378 | |
| 1727 | CYB5R3 | DRUGGABLE GENOME, ENZYME | ceftriaxone | CEFTRIAXONE | ||
| 1727 | CYB5R3 | DRUGGABLE GENOME, ENZYME | dapsone | DAPSONE | ||
| 1727 | CYB5R3 | DRUGGABLE GENOME, ENZYME | rasburicase | RASBURICASE |
| Page: 1 2 |

Copyright 2023-Present -The University of Texas Health Science Center at Houston |