
|
|||||
|
 | |
| |
| |
| |
| |
| |
|
Gene: CYB5R1 |
Gene summary for CYB5R1 |
| Gene information | Species | Human | Gene symbol | CYB5R1 | Gene ID | 51706 |
| Gene name | cytochrome b5 reductase 1 | |
| Gene Alias | B5R.1 | |
| Cytomap | 1q32.1 | |
| Gene Type | protein-coding | GO ID | GO:0006629 | UniProtAcc | Q9UHQ9 |
Top |
Malignant transformation analysis |
| Identification of the aberrant gene expression in precancerous and cancerous lesions by comparing the gene expression of stem-like cells in diseased tissues with normal stem cells |
| Entrez ID | Symbol | Replicates | Species | Organ | Tissue | Adj P-value | Log2FC | Malignancy |
| 51706 | CYB5R1 | LZE4T | Human | Esophagus | ESCC | 2.87e-07 | 2.84e-01 | 0.0811 |
| 51706 | CYB5R1 | LZE5T | Human | Esophagus | ESCC | 1.91e-07 | 6.47e-01 | 0.0514 |
| 51706 | CYB5R1 | LZE7T | Human | Esophagus | ESCC | 5.23e-09 | 3.46e-01 | 0.0667 |
| 51706 | CYB5R1 | LZE20T | Human | Esophagus | ESCC | 8.28e-08 | 3.51e-01 | 0.0662 |
| 51706 | CYB5R1 | LZE22T | Human | Esophagus | ESCC | 2.98e-04 | 4.54e-01 | 0.068 |
| 51706 | CYB5R1 | LZE24T | Human | Esophagus | ESCC | 1.52e-18 | 5.29e-01 | 0.0596 |
| 51706 | CYB5R1 | P1T-E | Human | Esophagus | ESCC | 4.31e-04 | 6.06e-01 | 0.0875 |
| 51706 | CYB5R1 | P2T-E | Human | Esophagus | ESCC | 1.73e-17 | 4.56e-01 | 0.1177 |
| 51706 | CYB5R1 | P4T-E | Human | Esophagus | ESCC | 1.97e-20 | 5.56e-01 | 0.1323 |
| 51706 | CYB5R1 | P5T-E | Human | Esophagus | ESCC | 1.73e-14 | 3.07e-01 | 0.1327 |
| 51706 | CYB5R1 | P8T-E | Human | Esophagus | ESCC | 5.71e-28 | 3.91e-01 | 0.0889 |
| 51706 | CYB5R1 | P9T-E | Human | Esophagus | ESCC | 1.55e-20 | 2.77e-01 | 0.1131 |
| 51706 | CYB5R1 | P10T-E | Human | Esophagus | ESCC | 5.23e-15 | 2.30e-01 | 0.116 |
| 51706 | CYB5R1 | P11T-E | Human | Esophagus | ESCC | 2.13e-24 | 1.41e+00 | 0.1426 |
| 51706 | CYB5R1 | P12T-E | Human | Esophagus | ESCC | 9.75e-23 | 2.46e-01 | 0.1122 |
| 51706 | CYB5R1 | P15T-E | Human | Esophagus | ESCC | 1.31e-20 | 4.52e-01 | 0.1149 |
| 51706 | CYB5R1 | P16T-E | Human | Esophagus | ESCC | 1.55e-24 | 6.01e-01 | 0.1153 |
| 51706 | CYB5R1 | P17T-E | Human | Esophagus | ESCC | 1.50e-13 | 5.95e-01 | 0.1278 |
| 51706 | CYB5R1 | P19T-E | Human | Esophagus | ESCC | 1.25e-08 | 9.45e-01 | 0.1662 |
| 51706 | CYB5R1 | P20T-E | Human | Esophagus | ESCC | 5.08e-15 | 4.68e-01 | 0.1124 |
| Page: 1 2 3 4 5 6 |
| Tissue | Expression Dynamics | Abbreviation |
| Esophagus | 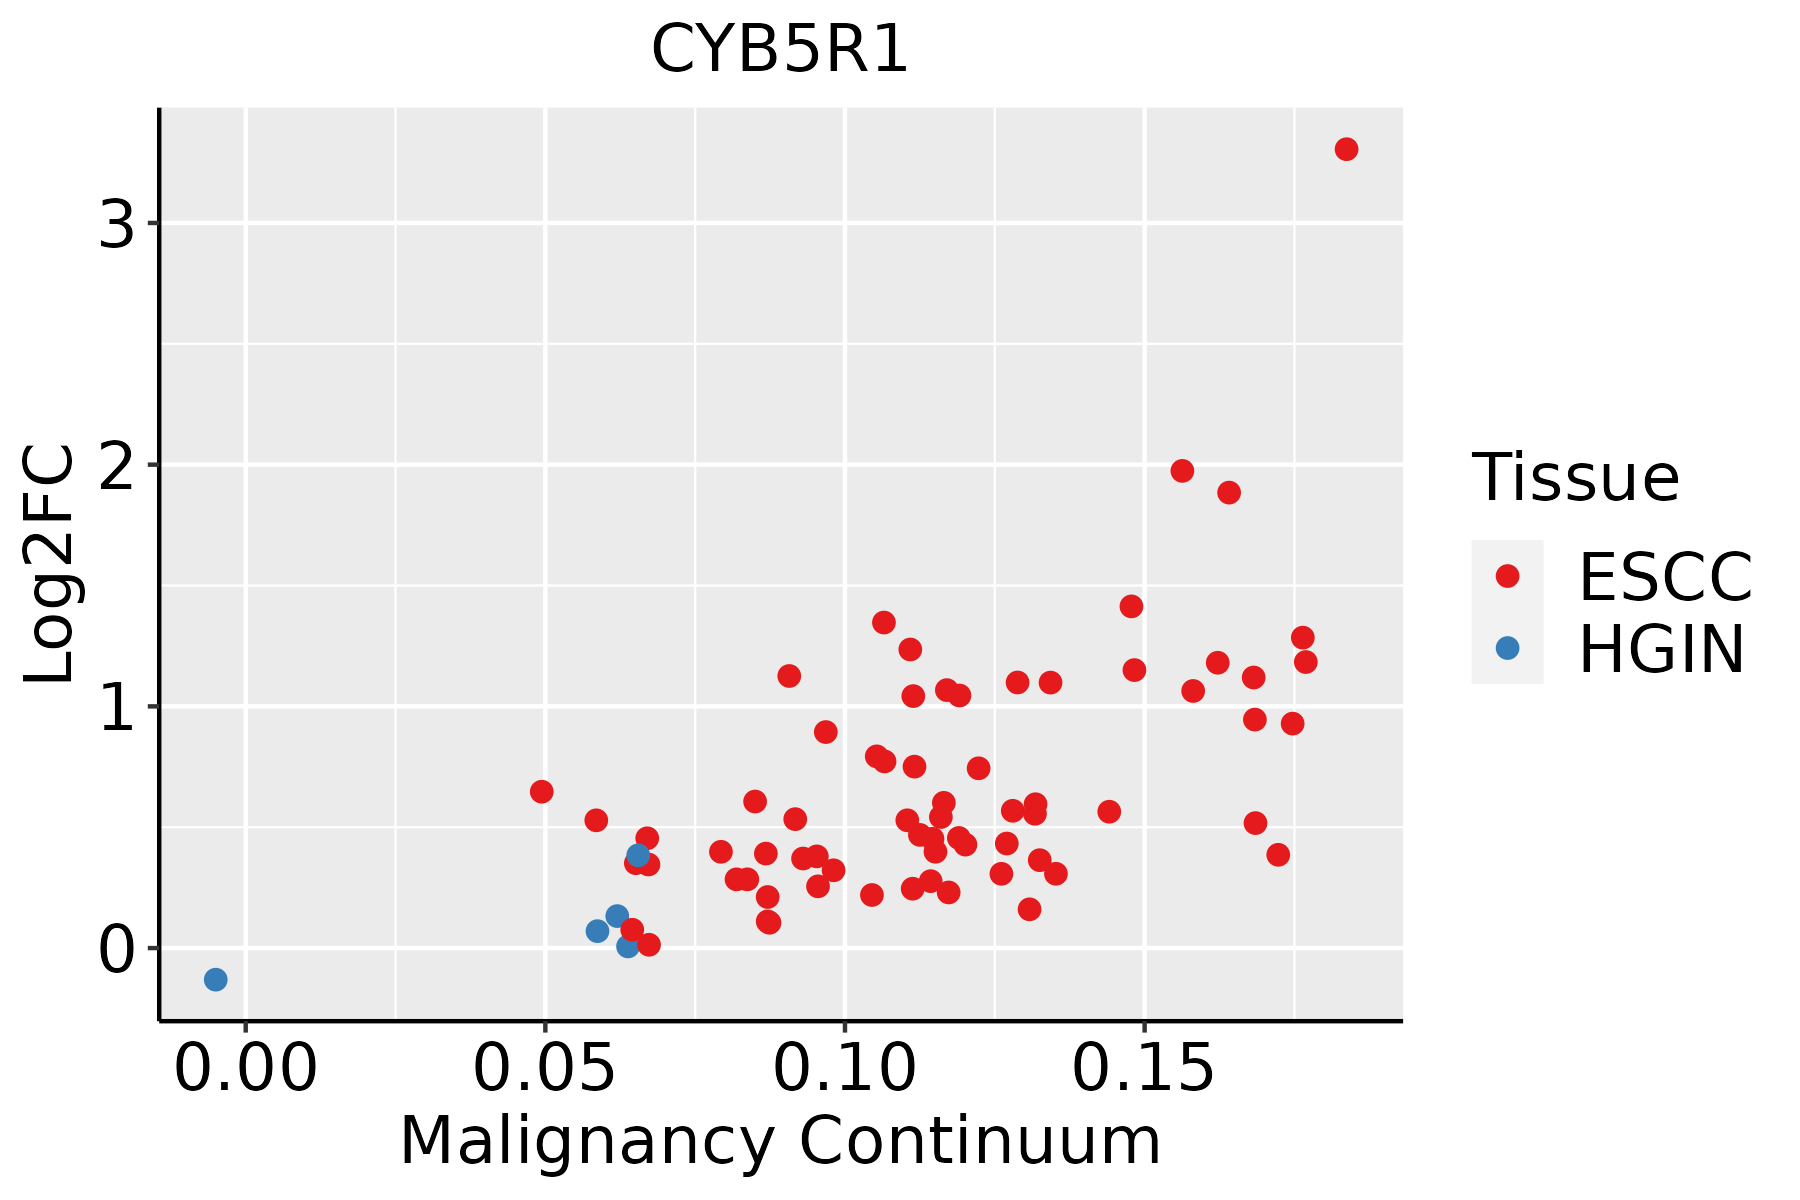 | ESCC: Esophageal squamous cell carcinoma |
| HGIN: High-grade intraepithelial neoplasias | ||
| LGIN: Low-grade intraepithelial neoplasias | ||
| Liver |  | HCC: Hepatocellular carcinoma |
| NAFLD: Non-alcoholic fatty liver disease | ||
| Oral Cavity | 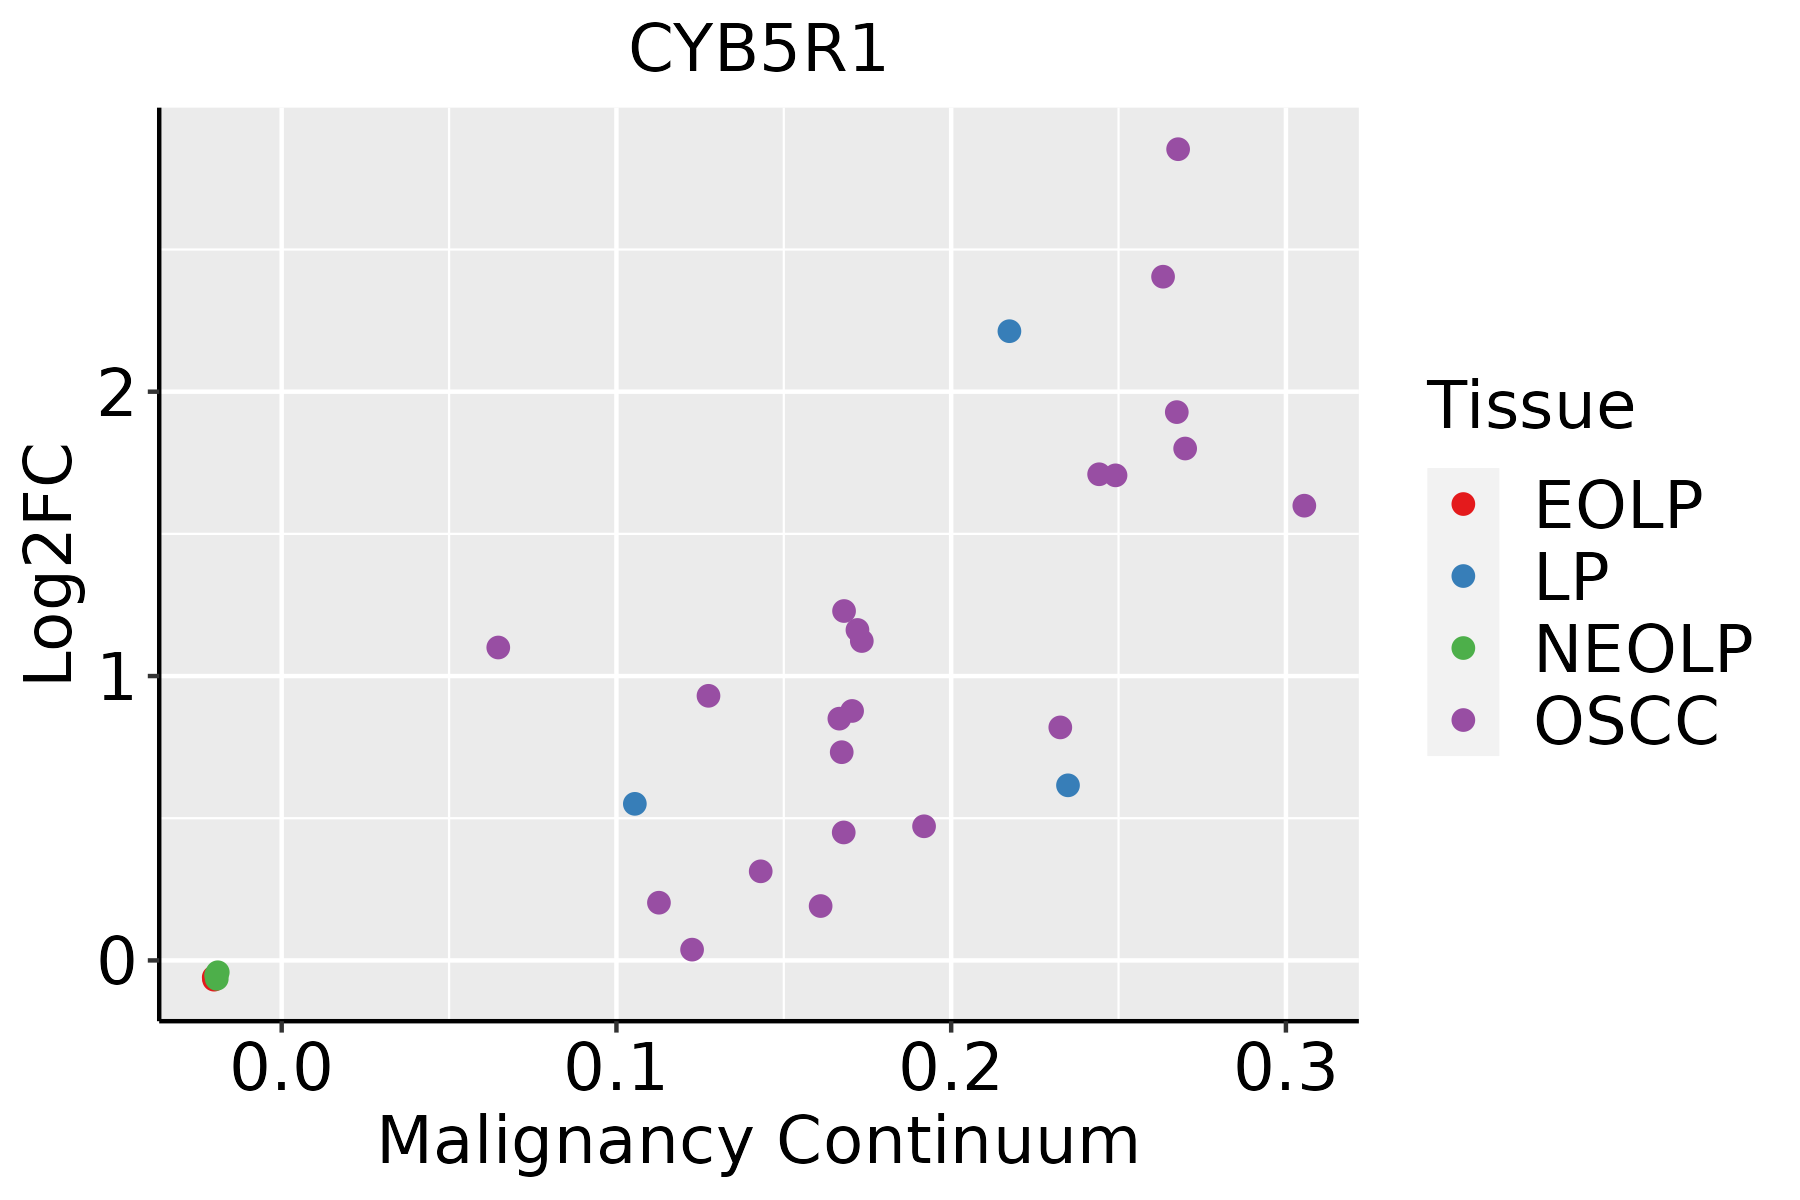 | EOLP: Erosive Oral lichen planus |
| LP: leukoplakia | ||
| NEOLP: Non-erosive oral lichen planus | ||
| OSCC: Oral squamous cell carcinoma | ||
| Skin |  | AK: Actinic keratosis |
| cSCC: Cutaneous squamous cell carcinoma | ||
| SCCIS:squamous cell carcinoma in situ |
| ∗log2FC in expression of this searched gene in stem-like cells from each diseased tissue sample relative to stem-like cells in normal samples in each tissue plotted against the malignancy continuum. Samples are colored based on if they are from different disease stage. |
Top |
Malignant transformation related pathway analysis |
| Find out the enriched GO biological processes and KEGG pathways involved in transition from healthy to precancer to cancer |
| Tissue | Disease Stage | Enriched GO biological Processes |
| Colorectum | AD |  |
| Colorectum | SER |  |
| Colorectum | MSS |  |
| Colorectum | MSI-H |  |
| Colorectum | FAP |  |
| ∗Top 15 enriched GO BP terms are showed in the bar plot of each disease state in each tissue. Each row represents a significant GO biological process which is colored according to the -log10(p.adjust). |
| Page: 1 2 3 4 5 6 7 8 9 |
| GO ID | Tissue | Disease Stage | Description | Gene Ratio | Bg Ratio | pvalue | p.adjust | Count |
| GO:00161263 | Esophagus | ESCC | sterol biosynthetic process | 46/8552 | 64/18723 | 1.91e-05 | 1.67e-04 | 46 |
| GO:00066946 | Esophagus | ESCC | steroid biosynthetic process | 98/8552 | 173/18723 | 2.34e-03 | 1.03e-02 | 98 |
| GO:00161254 | Esophagus | ESCC | sterol metabolic process | 86/8552 | 152/18723 | 4.37e-03 | 1.73e-02 | 86 |
| GO:19016174 | Esophagus | ESCC | organic hydroxy compound biosynthetic process | 128/8552 | 237/18723 | 5.86e-03 | 2.16e-02 | 128 |
| GO:000820211 | Liver | Cirrhotic | steroid metabolic process | 143/4634 | 319/18723 | 2.79e-15 | 3.18e-13 | 143 |
| GO:00161251 | Liver | Cirrhotic | sterol metabolic process | 75/4634 | 152/18723 | 4.54e-11 | 2.61e-09 | 75 |
| GO:00066941 | Liver | Cirrhotic | steroid biosynthetic process | 77/4634 | 173/18723 | 1.02e-08 | 3.91e-07 | 77 |
| GO:0016126 | Liver | Cirrhotic | sterol biosynthetic process | 37/4634 | 64/18723 | 1.74e-08 | 6.32e-07 | 37 |
| GO:19016171 | Liver | Cirrhotic | organic hydroxy compound biosynthetic process | 81/4634 | 237/18723 | 6.73e-04 | 5.06e-03 | 81 |
| GO:00082022 | Liver | HCC | steroid metabolic process | 188/7958 | 319/18723 | 1.96e-09 | 5.63e-08 | 188 |
| GO:00161252 | Liver | HCC | sterol metabolic process | 101/7958 | 152/18723 | 1.99e-09 | 5.63e-08 | 101 |
| GO:00161261 | Liver | HCC | sterol biosynthetic process | 47/7958 | 64/18723 | 5.00e-07 | 8.11e-06 | 47 |
| GO:00066942 | Liver | HCC | steroid biosynthetic process | 104/7958 | 173/18723 | 2.13e-06 | 2.91e-05 | 104 |
| GO:19016172 | Liver | HCC | organic hydroxy compound biosynthetic process | 129/7958 | 237/18723 | 1.32e-04 | 1.08e-03 | 129 |
| GO:00161262 | Oral cavity | OSCC | sterol biosynthetic process | 39/7305 | 64/18723 | 3.12e-04 | 1.94e-03 | 39 |
| GO:00066945 | Oral cavity | OSCC | steroid biosynthetic process | 89/7305 | 173/18723 | 5.77e-04 | 3.30e-03 | 89 |
| GO:19016173 | Oral cavity | OSCC | organic hydroxy compound biosynthetic process | 115/7305 | 237/18723 | 1.73e-03 | 8.18e-03 | 115 |
| GO:00161253 | Oral cavity | OSCC | sterol metabolic process | 77/7305 | 152/18723 | 2.26e-03 | 1.00e-02 | 77 |
| GO:00082024 | Oral cavity | OSCC | steroid metabolic process | 146/7305 | 319/18723 | 7.78e-03 | 2.85e-02 | 146 |
| GO:001612611 | Oral cavity | LP | sterol biosynthetic process | 27/4623 | 64/18723 | 1.57e-03 | 1.21e-02 | 27 |
| Page: 1 2 |
| Pathway ID | Tissue | Disease Stage | Description | Gene Ratio | Bg Ratio | pvalue | p.adjust | qvalue | Count |
| hsa005202 | Esophagus | ESCC | Amino sugar and nucleotide sugar metabolism | 35/4205 | 49/8465 | 1.60e-03 | 4.88e-03 | 2.50e-03 | 35 |
| hsa0052011 | Esophagus | ESCC | Amino sugar and nucleotide sugar metabolism | 35/4205 | 49/8465 | 1.60e-03 | 4.88e-03 | 2.50e-03 | 35 |
| hsa00520 | Oral cavity | OSCC | Amino sugar and nucleotide sugar metabolism | 34/3704 | 49/8465 | 2.48e-04 | 8.08e-04 | 4.11e-04 | 34 |
| hsa005201 | Oral cavity | OSCC | Amino sugar and nucleotide sugar metabolism | 34/3704 | 49/8465 | 2.48e-04 | 8.08e-04 | 4.11e-04 | 34 |
| Page: 1 |
Top |
Cell-cell communication analysis |
| Identification of potential cell-cell interactions between two cell types and their ligand-receptor pairs for different disease states |
| Ligand | Receptor | LRpair | Pathway | Tissue | Disease Stage |
| Page: 1 |
Top |
Single-cell gene regulatory network inference analysis |
| Find out the significant the regulons (TFs) and the target genes of each regulon across cell types for different disease states |
| TF | Cell Type | Tissue | Disease Stage | Target Gene | RSS | Regulon Activity |
| ∗The dot plots of a searched regulon are shown for all cell subpopulations in each disease state of each tissue based on the regulon specific score inferred using pySCENIC and by calculating the average expression. |
| Page: 1 |
Top |
Somatic mutation of malignant transformation related genes |
| Annotation of somatic variants for genes involved in malignant transformation |
| Hugo Symbol | Variant Class | Variant Classification | dbSNP RS | HGVSc | HGVSp | HGVSp Short | SWISSPROT | BIOTYPE | SIFT | PolyPhen | Tumor Sample Barcode | Tissue | Histology | Sex | Age | Stage | Therapy Types | Drugs | Outcome |
| CYB5R1 | SNV | Missense_Mutation | c.298N>G | p.Pro100Ala | p.P100A | Q9UHQ9 | protein_coding | deleterious(0) | probably_damaging(0.998) | TCGA-A2-A04P-01 | Breast | breast invasive carcinoma | Female | <65 | III/IV | Chemotherapy | taxol | PD | |
| CYB5R1 | SNV | Missense_Mutation | novel | c.390N>T | p.Lys130Asn | p.K130N | Q9UHQ9 | protein_coding | deleterious(0) | probably_damaging(0.996) | TCGA-AR-A2LE-01 | Breast | breast invasive carcinoma | Female | >=65 | I/II | Hormone Therapy | tamoxiphen | PD |
| CYB5R1 | SNV | Missense_Mutation | c.896A>T | p.Gln299Leu | p.Q299L | Q9UHQ9 | protein_coding | tolerated(0.06) | benign(0.01) | TCGA-B6-A0X1-01 | Breast | breast invasive carcinoma | Female | <65 | I/II | Unknown | Unknown | PD | |
| CYB5R1 | SNV | Missense_Mutation | c.139T>A | p.Tyr47Asn | p.Y47N | Q9UHQ9 | protein_coding | deleterious(0) | probably_damaging(0.971) | TCGA-BH-A18G-01 | Breast | breast invasive carcinoma | Female | >=65 | I/II | Unknown | Unknown | SD | |
| CYB5R1 | deletion | In_Frame_Del | novel | c.884_889delNNNNNN | p.Leu295_Tyr297delinsHis | p.L295_Y297delinsH | Q9UHQ9 | protein_coding | TCGA-AO-A03P-01 | Breast | breast invasive carcinoma | Female | <65 | I/II | Hormone Therapy | letrozole | PD | ||
| CYB5R1 | insertion | Nonsense_Mutation | novel | c.815_816insGGCCCCTGTGTGATATTGAAAGGGTTGTTGTGTCTGGGGTCCT | p.Asp272GlufsTer5 | p.D272Efs*5 | Q9UHQ9 | protein_coding | TCGA-AO-A03T-01 | Breast | breast invasive carcinoma | Female | <65 | I/II | Chemotherapy | cyclophosphamide | SD | ||
| CYB5R1 | SNV | Missense_Mutation | c.334N>G | p.Leu112Val | p.L112V | Q9UHQ9 | protein_coding | deleterious(0.02) | possibly_damaging(0.899) | TCGA-C5-A7CL-01 | Cervix | cervical & endocervical cancer | Female | <65 | III/IV | Chemotherapy | cisplatin | PD | |
| CYB5R1 | SNV | Missense_Mutation | rs371177663 | c.326A>G | p.Tyr109Cys | p.Y109C | Q9UHQ9 | protein_coding | deleterious(0.02) | probably_damaging(0.971) | TCGA-AA-3710-01 | Colorectum | colon adenocarcinoma | Female | >=65 | I/II | Unknown | Unknown | SD |
| CYB5R1 | SNV | Missense_Mutation | rs768353653 | c.194G>A | p.Arg65His | p.R65H | Q9UHQ9 | protein_coding | deleterious(0) | probably_damaging(0.986) | TCGA-AF-3913-01 | Colorectum | rectum adenocarcinoma | Male | <65 | III/IV | Chemotherapy | xeloda | PD |
| CYB5R1 | SNV | Missense_Mutation | rs760633859 | c.706C>T | p.Arg236Cys | p.R236C | Q9UHQ9 | protein_coding | deleterious(0) | benign(0.379) | TCGA-AG-A002-01 | Colorectum | rectum adenocarcinoma | Male | <65 | I/II | Unknown | Unknown | SD |
| Page: 1 2 3 4 |
Top |
Related drugs of malignant transformation related genes |
| Identification of chemicals and drugs interact with genes involved in malignant transfromation |
| (DGIdb 4.0) |
| Entrez ID | Symbol | Category | Interaction Types | Drug Claim Name | Drug Name | PMIDs |
| 51706 | CYB5R1 | DRUGGABLE GENOME | primaquine | PRIMAQUINE | ||
| 51706 | CYB5R1 | DRUGGABLE GENOME | metoclopramide | METOCLOPRAMIDE | ||
| 51706 | CYB5R1 | DRUGGABLE GENOME | rasburicase | RASBURICASE | ||
| 51706 | CYB5R1 | DRUGGABLE GENOME | isosorbide dinitrate | |||
| 51706 | CYB5R1 | DRUGGABLE GENOME | isosorbide mononitrate |
| Page: 1 |

Copyright 2023-Present -The University of Texas Health Science Center at Houston |