
|
|||||
|
 | |
| |
| |
| |
| |
| |
|
Gene: CYB5B |
Gene summary for CYB5B |
| Gene information | Species | Human | Gene symbol | CYB5B | Gene ID | 80777 |
| Gene name | cytochrome b5 type B | |
| Gene Alias | CYB5-M | |
| Cytomap | 16q22.1 | |
| Gene Type | protein-coding | GO ID | GO:0006091 | UniProtAcc | J3KNF8 |
Top |
Malignant transformation analysis |
| Identification of the aberrant gene expression in precancerous and cancerous lesions by comparing the gene expression of stem-like cells in diseased tissues with normal stem cells |
| Entrez ID | Symbol | Replicates | Species | Organ | Tissue | Adj P-value | Log2FC | Malignancy |
| 80777 | CYB5B | HTA11_2487_2000001011 | Human | Colorectum | SER | 1.57e-04 | 4.39e-01 | -0.1808 |
| 80777 | CYB5B | HTA11_347_2000001011 | Human | Colorectum | AD | 9.96e-11 | 4.84e-01 | -0.1954 |
| 80777 | CYB5B | HTA11_411_2000001011 | Human | Colorectum | SER | 2.90e-04 | 8.71e-01 | -0.2602 |
| 80777 | CYB5B | HTA11_696_2000001011 | Human | Colorectum | AD | 1.98e-05 | 3.08e-01 | -0.1464 |
| 80777 | CYB5B | HTA11_1391_2000001011 | Human | Colorectum | AD | 1.50e-04 | 4.49e-01 | -0.059 |
| 80777 | CYB5B | HTA11_5212_2000001011 | Human | Colorectum | AD | 8.02e-04 | 7.12e-01 | -0.2061 |
| 80777 | CYB5B | HTA11_99999970781_79442 | Human | Colorectum | MSS | 4.08e-08 | 5.60e-01 | 0.294 |
| 80777 | CYB5B | HTA11_99999965104_69814 | Human | Colorectum | MSS | 2.19e-15 | 1.05e+00 | 0.281 |
| 80777 | CYB5B | HTA11_99999971662_82457 | Human | Colorectum | MSS | 3.77e-13 | 6.59e-01 | 0.3859 |
| 80777 | CYB5B | HTA11_99999973899_84307 | Human | Colorectum | MSS | 2.44e-02 | 4.75e-01 | 0.2585 |
| 80777 | CYB5B | HTA11_99999974143_84620 | Human | Colorectum | MSS | 1.22e-06 | 4.84e-01 | 0.3005 |
| 80777 | CYB5B | A015-C-203 | Human | Colorectum | FAP | 4.79e-06 | -1.65e-01 | -0.1294 |
| 80777 | CYB5B | A002-C-201 | Human | Colorectum | FAP | 3.03e-04 | -2.20e-01 | 0.0324 |
| 80777 | CYB5B | A001-C-119 | Human | Colorectum | FAP | 3.82e-02 | -2.77e-01 | -0.1557 |
| 80777 | CYB5B | A001-C-108 | Human | Colorectum | FAP | 1.94e-04 | -2.45e-01 | -0.0272 |
| 80777 | CYB5B | A002-C-205 | Human | Colorectum | FAP | 1.56e-08 | -1.61e-01 | -0.1236 |
| 80777 | CYB5B | A015-C-006 | Human | Colorectum | FAP | 1.81e-05 | -1.77e-01 | -0.0994 |
| 80777 | CYB5B | A015-C-106 | Human | Colorectum | FAP | 1.47e-02 | -2.16e-01 | -0.0511 |
| 80777 | CYB5B | A002-C-114 | Human | Colorectum | FAP | 6.69e-06 | -2.18e-01 | -0.1561 |
| 80777 | CYB5B | A015-C-104 | Human | Colorectum | FAP | 5.18e-10 | -2.38e-01 | -0.1899 |
| Page: 1 2 3 4 5 6 7 8 |
| Tissue | Expression Dynamics | Abbreviation |
| Colorectum (GSE201348) | 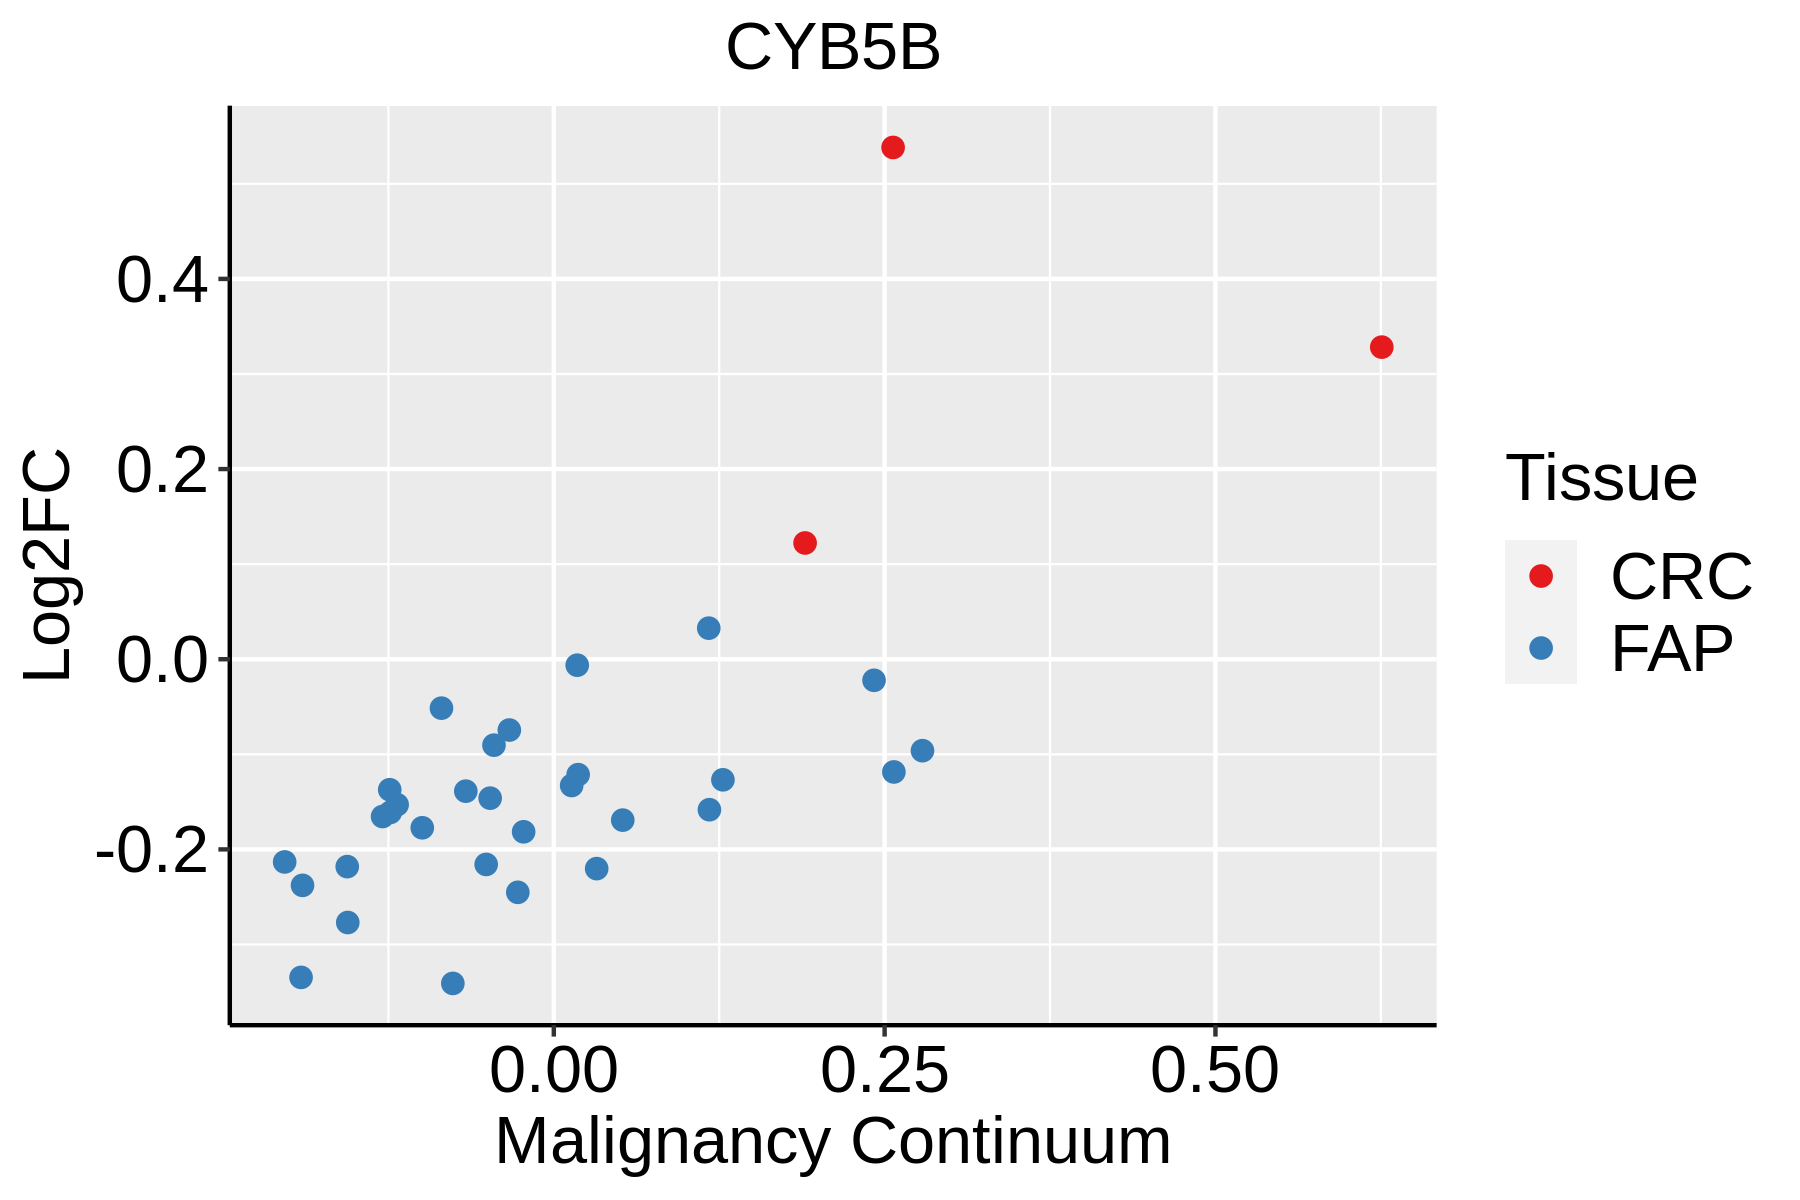 | FAP: Familial adenomatous polyposis |
| CRC: Colorectal cancer | ||
| Colorectum (HTA11) | 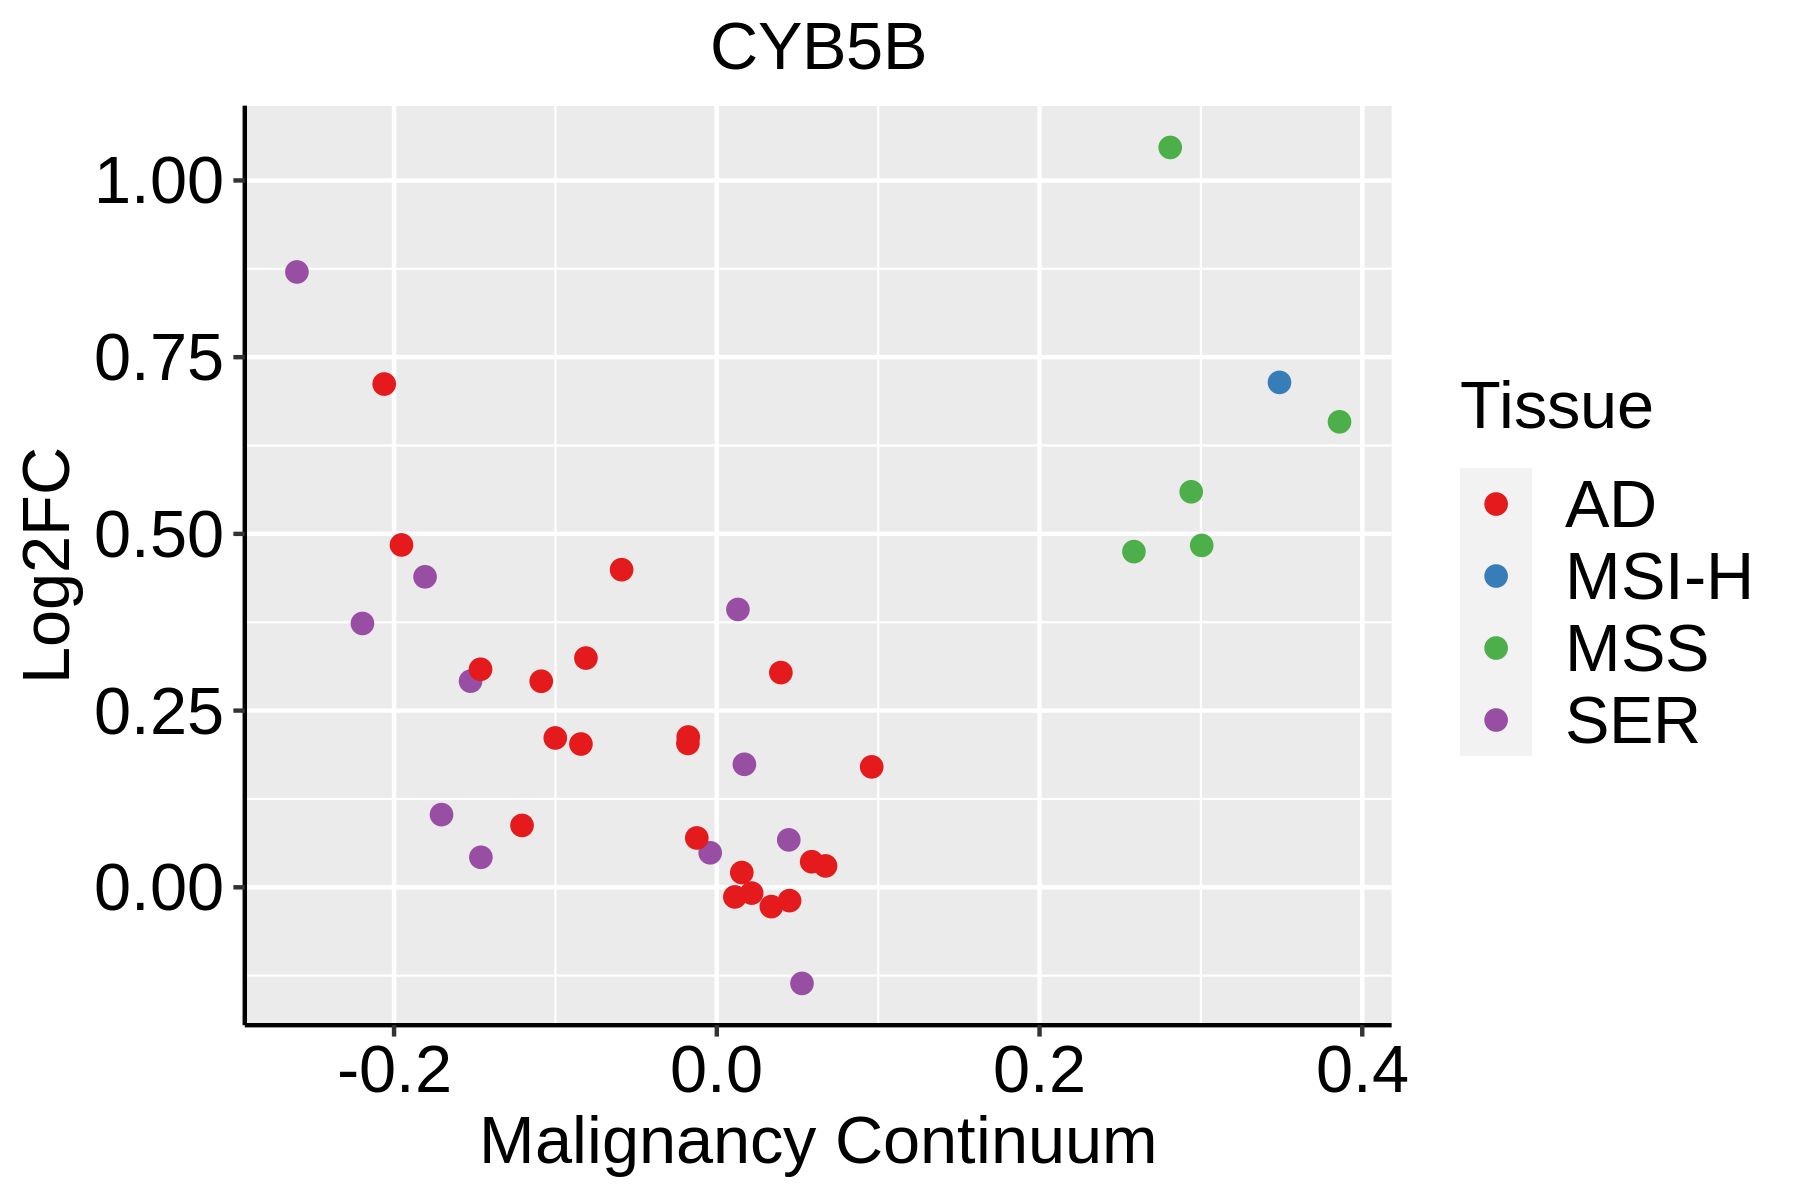 | AD: Adenomas |
| SER: Sessile serrated lesions | ||
| MSI-H: Microsatellite-high colorectal cancer | ||
| MSS: Microsatellite stable colorectal cancer | ||
| Esophagus | 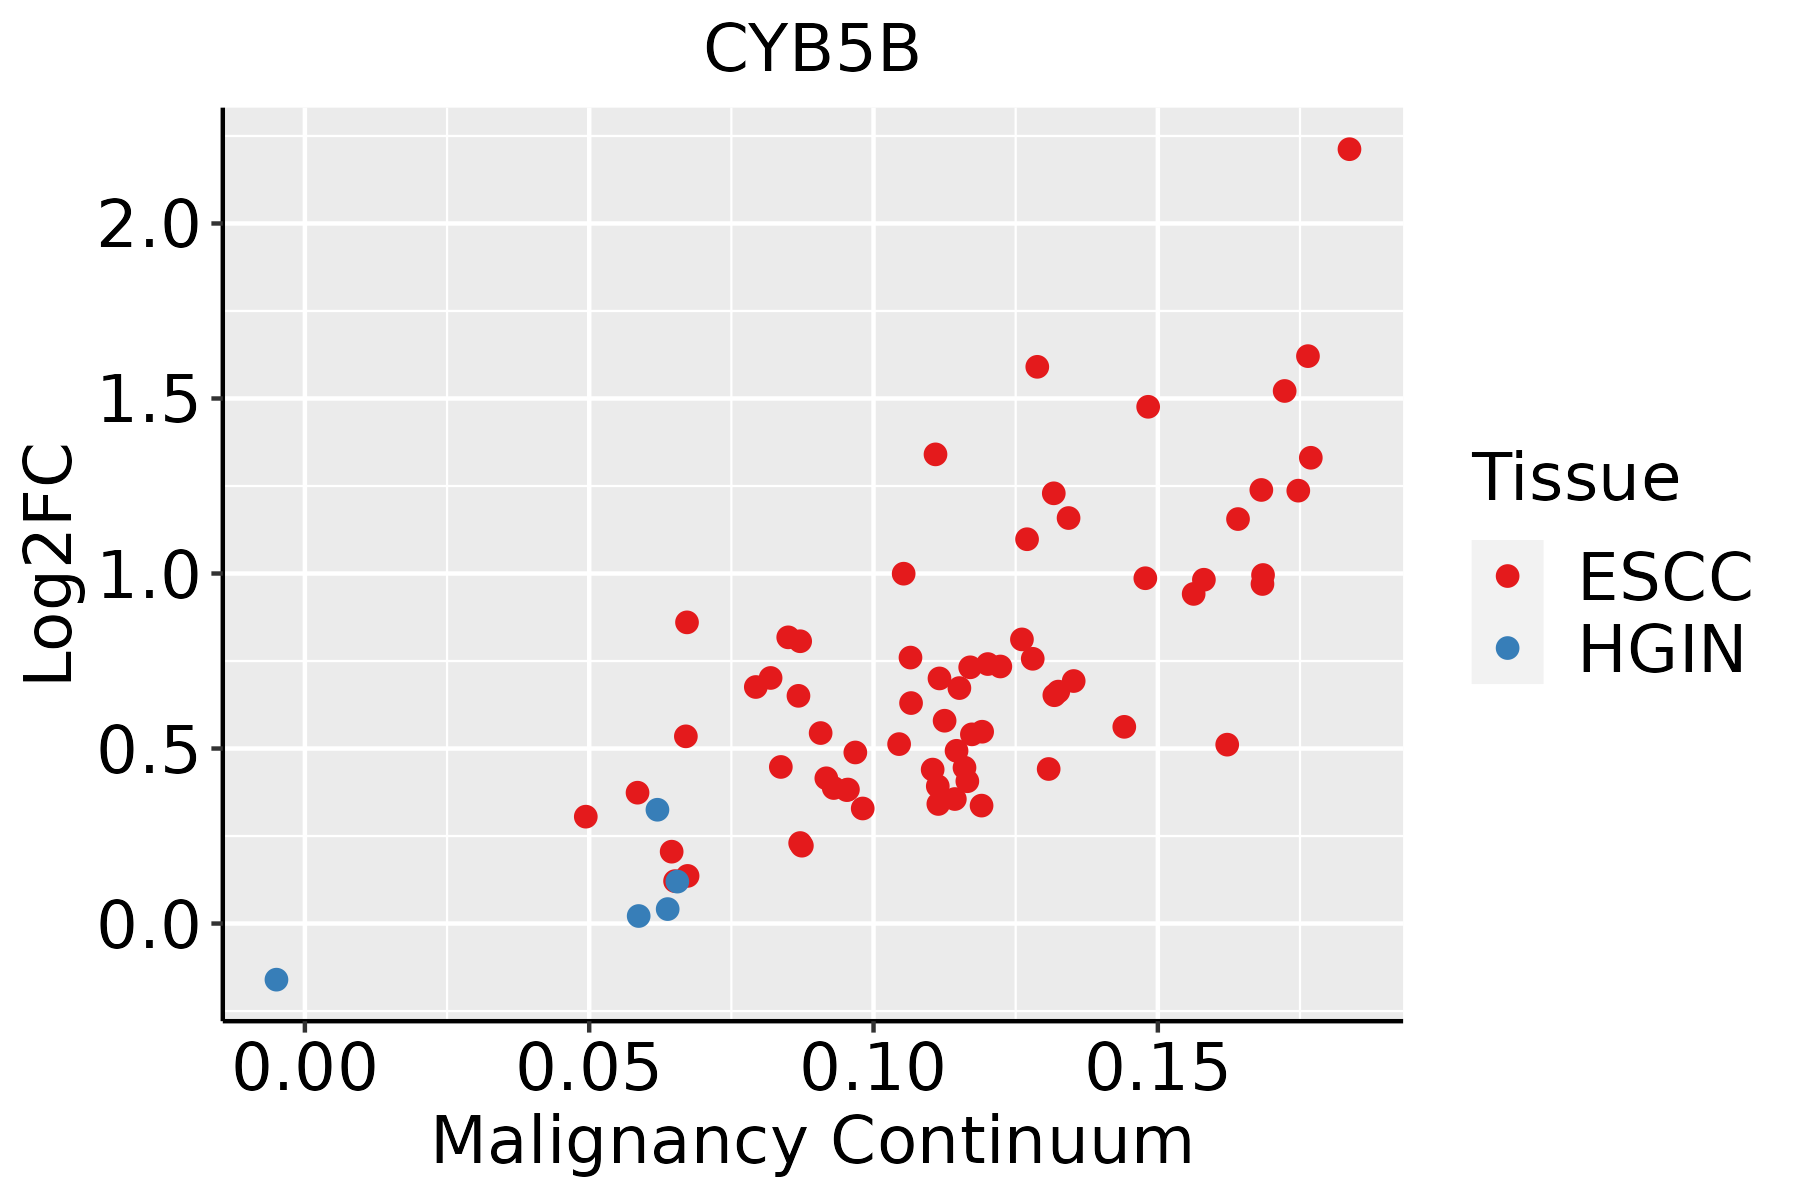 | ESCC: Esophageal squamous cell carcinoma |
| HGIN: High-grade intraepithelial neoplasias | ||
| LGIN: Low-grade intraepithelial neoplasias | ||
| Liver | 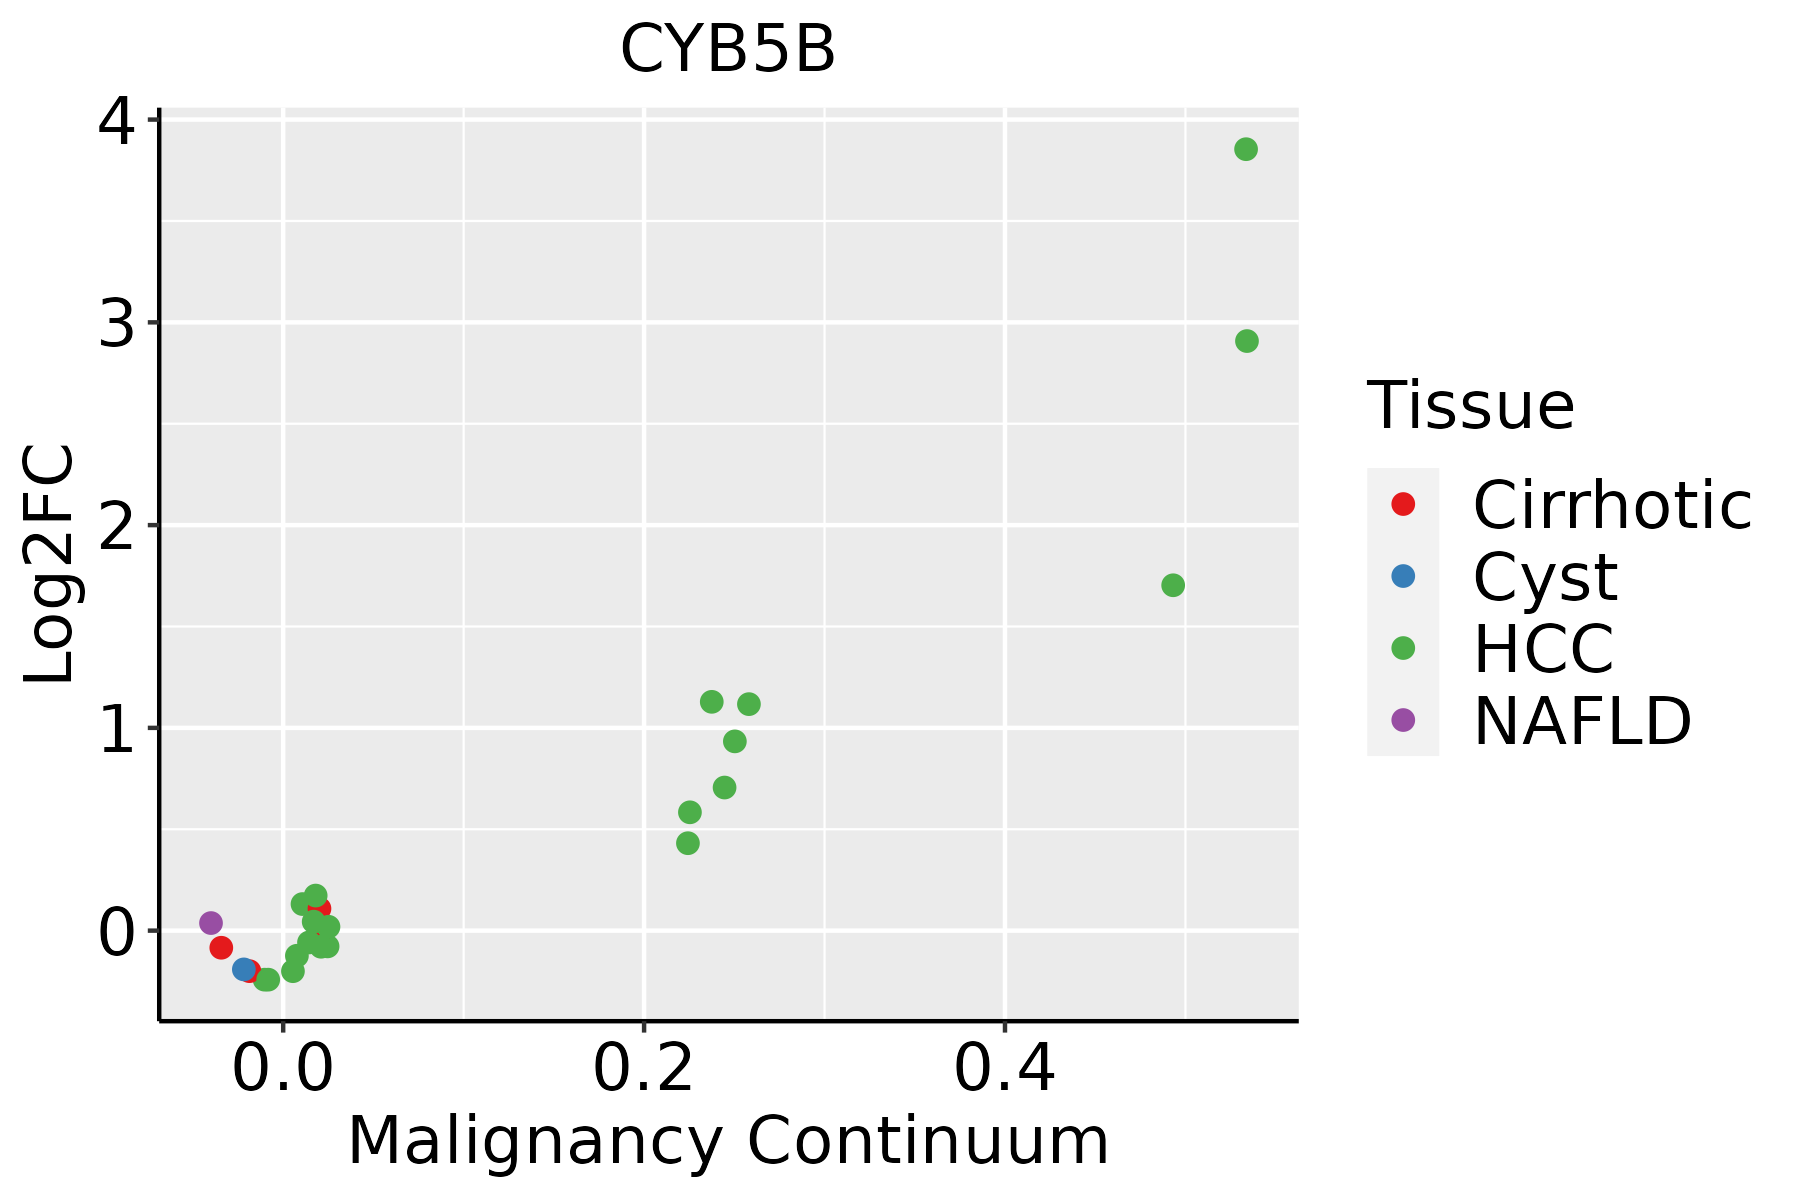 | HCC: Hepatocellular carcinoma |
| NAFLD: Non-alcoholic fatty liver disease | ||
| Oral Cavity |  | EOLP: Erosive Oral lichen planus |
| LP: leukoplakia | ||
| NEOLP: Non-erosive oral lichen planus | ||
| OSCC: Oral squamous cell carcinoma | ||
| Skin | 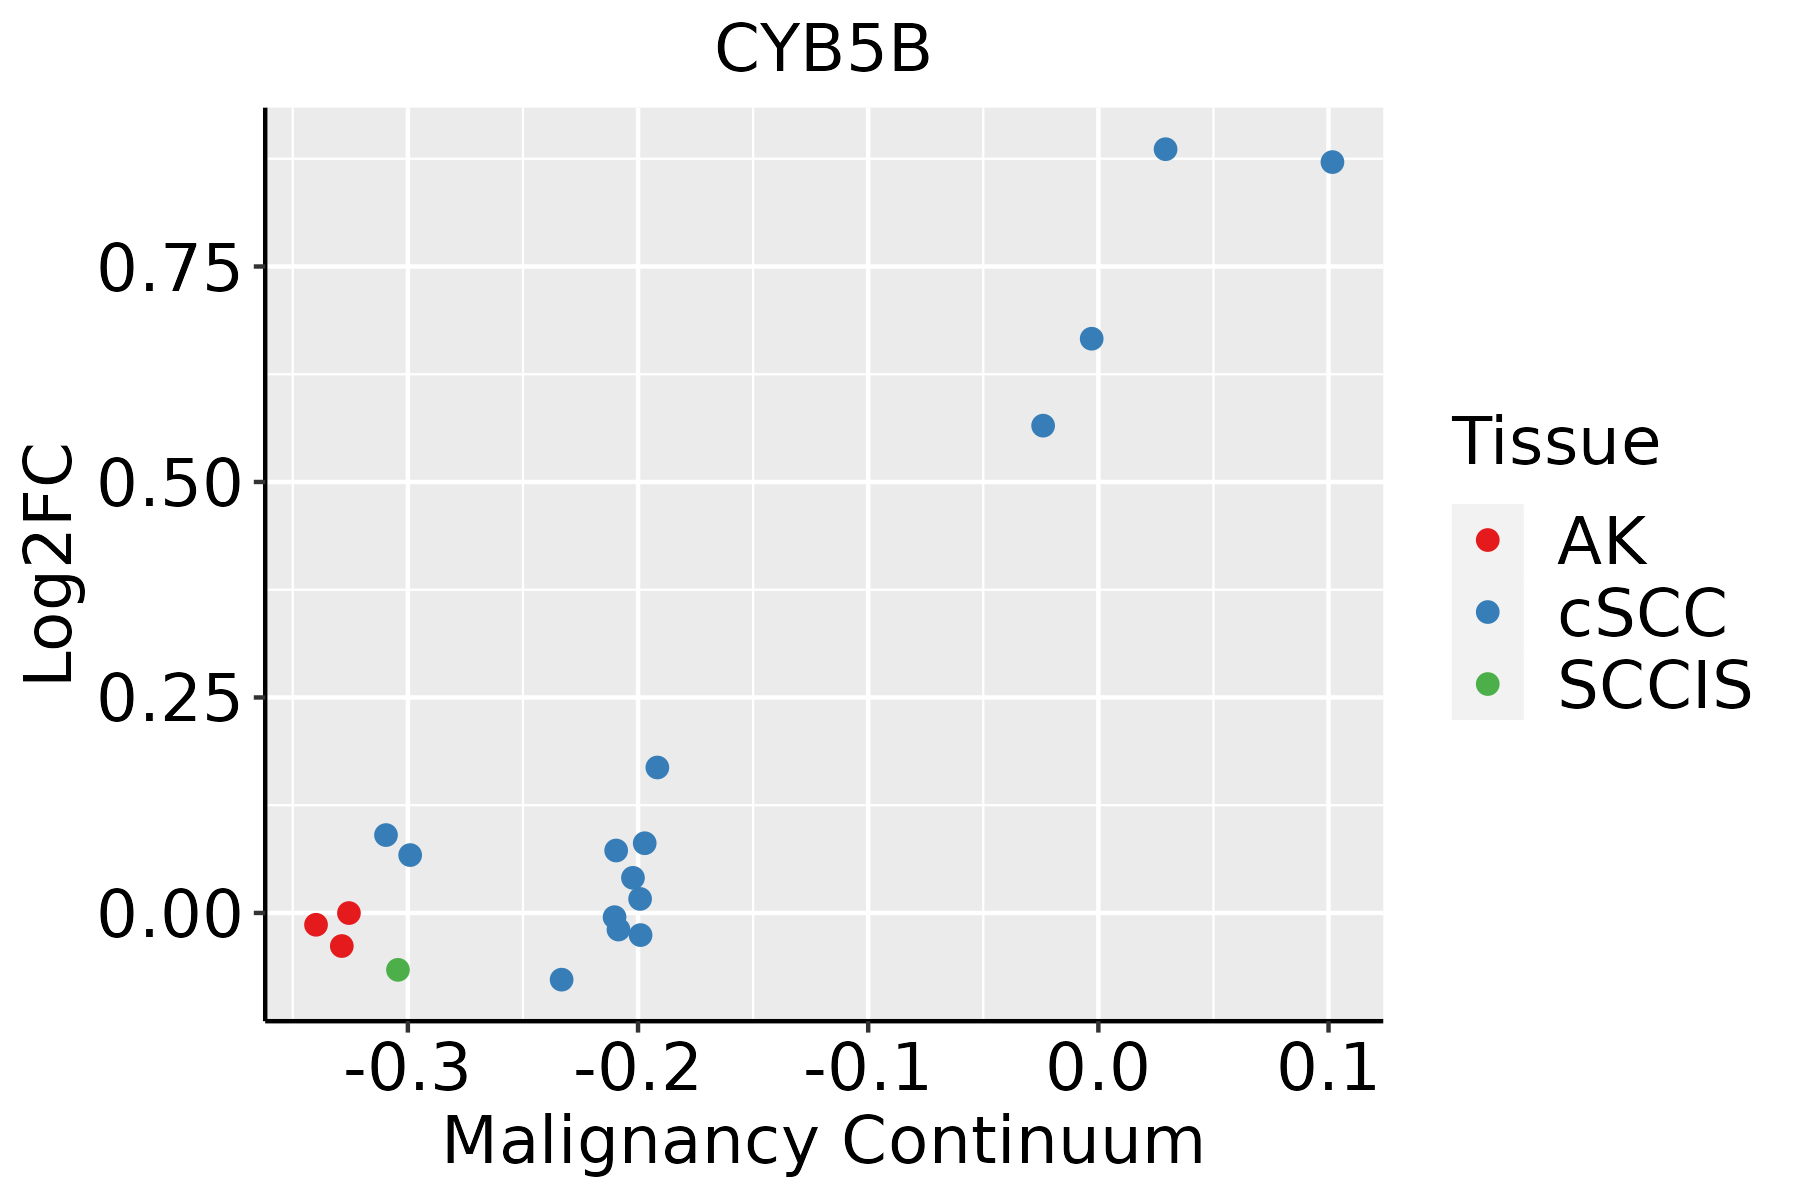 | AK: Actinic keratosis |
| cSCC: Cutaneous squamous cell carcinoma | ||
| SCCIS:squamous cell carcinoma in situ | ||
| Thyroid |  | ATC: Anaplastic thyroid cancer |
| HT: Hashimoto's thyroiditis | ||
| PTC: Papillary thyroid cancer |
| ∗log2FC in expression of this searched gene in stem-like cells from each diseased tissue sample relative to stem-like cells in normal samples in each tissue plotted against the malignancy continuum. Samples are colored based on if they are from different disease stage. |
Top |
Malignant transformation related pathway analysis |
| Find out the enriched GO biological processes and KEGG pathways involved in transition from healthy to precancer to cancer |
| Tissue | Disease Stage | Enriched GO biological Processes |
| Colorectum | AD |  |
| Colorectum | SER |  |
| Colorectum | MSS |  |
| Colorectum | MSI-H |  |
| Colorectum | FAP |  |
| ∗Top 15 enriched GO BP terms are showed in the bar plot of each disease state in each tissue. Each row represents a significant GO biological process which is colored according to the -log10(p.adjust). |
| Page: 1 2 3 4 5 6 7 8 9 |
| GO ID | Tissue | Disease Stage | Description | Gene Ratio | Bg Ratio | pvalue | p.adjust | Count |
| GO:0006091 | Colorectum | AD | generation of precursor metabolites and energy | 209/3918 | 490/18723 | 3.17e-28 | 6.61e-25 | 209 |
| GO:0022900 | Colorectum | AD | electron transport chain | 89/3918 | 175/18723 | 1.42e-18 | 8.91e-16 | 89 |
| GO:0006979 | Colorectum | AD | response to oxidative stress | 145/3918 | 446/18723 | 5.16e-09 | 3.23e-07 | 145 |
| GO:0006809 | Colorectum | AD | nitric oxide biosynthetic process | 30/3918 | 76/18723 | 1.72e-04 | 2.33e-03 | 30 |
| GO:0046209 | Colorectum | AD | nitric oxide metabolic process | 31/3918 | 81/18723 | 2.61e-04 | 3.25e-03 | 31 |
| GO:0009410 | Colorectum | AD | response to xenobiotic stimulus | 128/3918 | 462/18723 | 2.69e-04 | 3.31e-03 | 128 |
| GO:2001057 | Colorectum | AD | reactive nitrogen species metabolic process | 31/3918 | 82/18723 | 3.37e-04 | 3.94e-03 | 31 |
| GO:00060911 | Colorectum | SER | generation of precursor metabolites and energy | 168/2897 | 490/18723 | 1.39e-25 | 1.70e-22 | 168 |
| GO:00229001 | Colorectum | SER | electron transport chain | 77/2897 | 175/18723 | 1.77e-19 | 1.36e-16 | 77 |
| GO:00069791 | Colorectum | SER | response to oxidative stress | 114/2897 | 446/18723 | 1.75e-08 | 1.28e-06 | 114 |
| GO:00068091 | Colorectum | SER | nitric oxide biosynthetic process | 27/2897 | 76/18723 | 1.38e-05 | 4.28e-04 | 27 |
| GO:00462091 | Colorectum | SER | nitric oxide metabolic process | 28/2897 | 81/18723 | 1.73e-05 | 5.15e-04 | 28 |
| GO:20010571 | Colorectum | SER | reactive nitrogen species metabolic process | 28/2897 | 82/18723 | 2.24e-05 | 6.43e-04 | 28 |
| GO:00060912 | Colorectum | MSS | generation of precursor metabolites and energy | 186/3467 | 490/18723 | 1.14e-24 | 2.15e-21 | 186 |
| GO:00229002 | Colorectum | MSS | electron transport chain | 83/3467 | 175/18723 | 2.06e-18 | 1.17e-15 | 83 |
| GO:00069792 | Colorectum | MSS | response to oxidative stress | 128/3467 | 446/18723 | 7.65e-08 | 3.81e-06 | 128 |
| GO:00094101 | Colorectum | MSS | response to xenobiotic stimulus | 110/3467 | 462/18723 | 2.36e-03 | 1.92e-02 | 110 |
| GO:00060914 | Colorectum | FAP | generation of precursor metabolites and energy | 128/2622 | 490/18723 | 5.58e-13 | 4.28e-10 | 128 |
| GO:00229004 | Colorectum | FAP | electron transport chain | 51/2622 | 175/18723 | 1.44e-07 | 9.03e-06 | 51 |
| GO:00069794 | Colorectum | FAP | response to oxidative stress | 102/2622 | 446/18723 | 2.29e-07 | 1.33e-05 | 102 |
| Page: 1 2 3 4 |
| Pathway ID | Tissue | Disease Stage | Description | Gene Ratio | Bg Ratio | pvalue | p.adjust | qvalue | Count |
| Page: 1 |
Top |
Cell-cell communication analysis |
| Identification of potential cell-cell interactions between two cell types and their ligand-receptor pairs for different disease states |
| Ligand | Receptor | LRpair | Pathway | Tissue | Disease Stage |
| Page: 1 |
Top |
Single-cell gene regulatory network inference analysis |
| Find out the significant the regulons (TFs) and the target genes of each regulon across cell types for different disease states |
| TF | Cell Type | Tissue | Disease Stage | Target Gene | RSS | Regulon Activity |
| ∗The dot plots of a searched regulon are shown for all cell subpopulations in each disease state of each tissue based on the regulon specific score inferred using pySCENIC and by calculating the average expression. |
| Page: 1 |
Top |
Somatic mutation of malignant transformation related genes |
| Annotation of somatic variants for genes involved in malignant transformation |
| Hugo Symbol | Variant Class | Variant Classification | dbSNP RS | HGVSc | HGVSp | HGVSp Short | SWISSPROT | BIOTYPE | SIFT | PolyPhen | Tumor Sample Barcode | Tissue | Histology | Sex | Age | Stage | Therapy Types | Drugs | Outcome |
| CYB5B | SNV | Missense_Mutation | novel | c.98N>T | p.Ala33Val | p.A33V | protein_coding | tolerated(0.16) | benign(0.162) | TCGA-A5-A0G1-01 | Endometrium | uterine corpus endometrioid carcinoma | Female | >=65 | I/II | Unknown | Unknown | SD | |
| CYB5B | SNV | Missense_Mutation | novel | c.397N>A | p.Ala133Thr | p.A133T | protein_coding | deleterious(0) | benign(0.241) | TCGA-AP-A0LM-01 | Endometrium | uterine corpus endometrioid carcinoma | Female | <65 | III/IV | Chemotherapy | cisplatin | SD | |
| CYB5B | SNV | Missense_Mutation | rs576407250 | c.388N>G | p.Ile130Val | p.I130V | protein_coding | tolerated(0.69) | benign(0.045) | TCGA-AX-A05U-01 | Endometrium | uterine corpus endometrioid carcinoma | Female | <65 | I/II | Unknown | Unknown | SD | |
| CYB5B | SNV | Missense_Mutation | c.73N>G | p.Thr25Ala | p.T25A | protein_coding | tolerated(0.07) | benign(0.121) | TCGA-D1-A17H-01 | Endometrium | uterine corpus endometrioid carcinoma | Female | <65 | I/II | Unknown | Unknown | SD | ||
| CYB5B | SNV | Missense_Mutation | c.149A>G | p.Tyr50Cys | p.Y50C | protein_coding | deleterious(0) | benign(0.412) | TCGA-05-5423-01 | Lung | lung adenocarcinoma | Male | >=65 | I/II | Unknown | Unknown | SD | ||
| CYB5B | insertion | Frame_Shift_Ins | novel | c.188_189insAG | p.Val65ArgfsTer9 | p.V65Rfs*9 | protein_coding | TCGA-85-8276-01 | Lung | lung squamous cell carcinoma | Male | <65 | I/II | Chemotherapy | cisplatin | PD | |||
| CYB5B | SNV | Missense_Mutation | novel | c.292G>A | p.Asp98Asn | p.D98N | protein_coding | deleterious(0.02) | possibly_damaging(0.721) | TCGA-P3-A6T5-01 | Oral cavity | head & neck squamous cell carcinoma | Female | >=65 | I/II | Unknown | Unknown | PD |
| Page: 1 |
Top |
Related drugs of malignant transformation related genes |
| Identification of chemicals and drugs interact with genes involved in malignant transfromation |
| (DGIdb 4.0) |
| Entrez ID | Symbol | Category | Interaction Types | Drug Claim Name | Drug Name | PMIDs |
| Page: 1 |

Copyright 2023-Present -The University of Texas Health Science Center at Houston |