
|
|||||
|
 | |
| |
| |
| |
| |
| |
|
Gene: CYB5A |
Gene summary for CYB5A |
| Gene information | Species | Human | Gene symbol | CYB5A | Gene ID | 1528 |
| Gene name | cytochrome b5 type A | |
| Gene Alias | CYB5 | |
| Cytomap | 18q22.3 | |
| Gene Type | protein-coding | GO ID | GO:0006091 | UniProtAcc | P00167 |
Top |
Malignant transformation analysis |
| Identification of the aberrant gene expression in precancerous and cancerous lesions by comparing the gene expression of stem-like cells in diseased tissues with normal stem cells |
| Entrez ID | Symbol | Replicates | Species | Organ | Tissue | Adj P-value | Log2FC | Malignancy |
| 1528 | CYB5A | GSM4909281 | Human | Breast | IDC | 1.11e-02 | -2.61e-01 | 0.21 |
| 1528 | CYB5A | GSM4909285 | Human | Breast | IDC | 1.25e-12 | 3.52e-01 | 0.21 |
| 1528 | CYB5A | GSM4909286 | Human | Breast | IDC | 7.07e-09 | -4.41e-01 | 0.1081 |
| 1528 | CYB5A | GSM4909289 | Human | Breast | IDC | 1.72e-02 | 4.97e-01 | 0.1064 |
| 1528 | CYB5A | GSM4909290 | Human | Breast | IDC | 8.37e-20 | 6.50e-01 | 0.2096 |
| 1528 | CYB5A | GSM4909291 | Human | Breast | IDC | 1.49e-08 | 5.04e-01 | 0.1753 |
| 1528 | CYB5A | GSM4909293 | Human | Breast | IDC | 3.48e-09 | 2.34e-01 | 0.1581 |
| 1528 | CYB5A | GSM4909294 | Human | Breast | IDC | 3.17e-03 | 2.17e-01 | 0.2022 |
| 1528 | CYB5A | GSM4909296 | Human | Breast | IDC | 1.89e-27 | 6.72e-01 | 0.1524 |
| 1528 | CYB5A | GSM4909297 | Human | Breast | IDC | 4.40e-06 | -2.10e-01 | 0.1517 |
| 1528 | CYB5A | GSM4909298 | Human | Breast | IDC | 6.75e-07 | 9.40e-02 | 0.1551 |
| 1528 | CYB5A | GSM4909301 | Human | Breast | IDC | 1.20e-15 | 4.89e-01 | 0.1577 |
| 1528 | CYB5A | GSM4909302 | Human | Breast | IDC | 1.74e-09 | 4.26e-01 | 0.1545 |
| 1528 | CYB5A | GSM4909304 | Human | Breast | IDC | 1.17e-22 | 4.95e-01 | 0.1636 |
| 1528 | CYB5A | GSM4909306 | Human | Breast | IDC | 2.56e-07 | 3.56e-01 | 0.1564 |
| 1528 | CYB5A | GSM4909307 | Human | Breast | IDC | 2.22e-03 | 3.11e-01 | 0.1569 |
| 1528 | CYB5A | GSM4909308 | Human | Breast | IDC | 1.72e-08 | 3.43e-01 | 0.158 |
| 1528 | CYB5A | GSM4909311 | Human | Breast | IDC | 1.56e-32 | 3.70e-01 | 0.1534 |
| 1528 | CYB5A | GSM4909312 | Human | Breast | IDC | 1.04e-20 | 6.05e-01 | 0.1552 |
| 1528 | CYB5A | GSM4909313 | Human | Breast | IDC | 7.49e-07 | 3.60e-01 | 0.0391 |
| Page: 1 2 3 4 5 6 7 8 9 10 11 12 |
| Tissue | Expression Dynamics | Abbreviation |
| Breast |  | IDC: Invasive ductal carcinoma |
| DCIS: Ductal carcinoma in situ | ||
| Precancer(BRCA1-mut): Precancerous lesion from BRCA1 mutation carriers | ||
| Colorectum (GSE201348) |  | FAP: Familial adenomatous polyposis |
| CRC: Colorectal cancer | ||
| Colorectum (HTA11) | 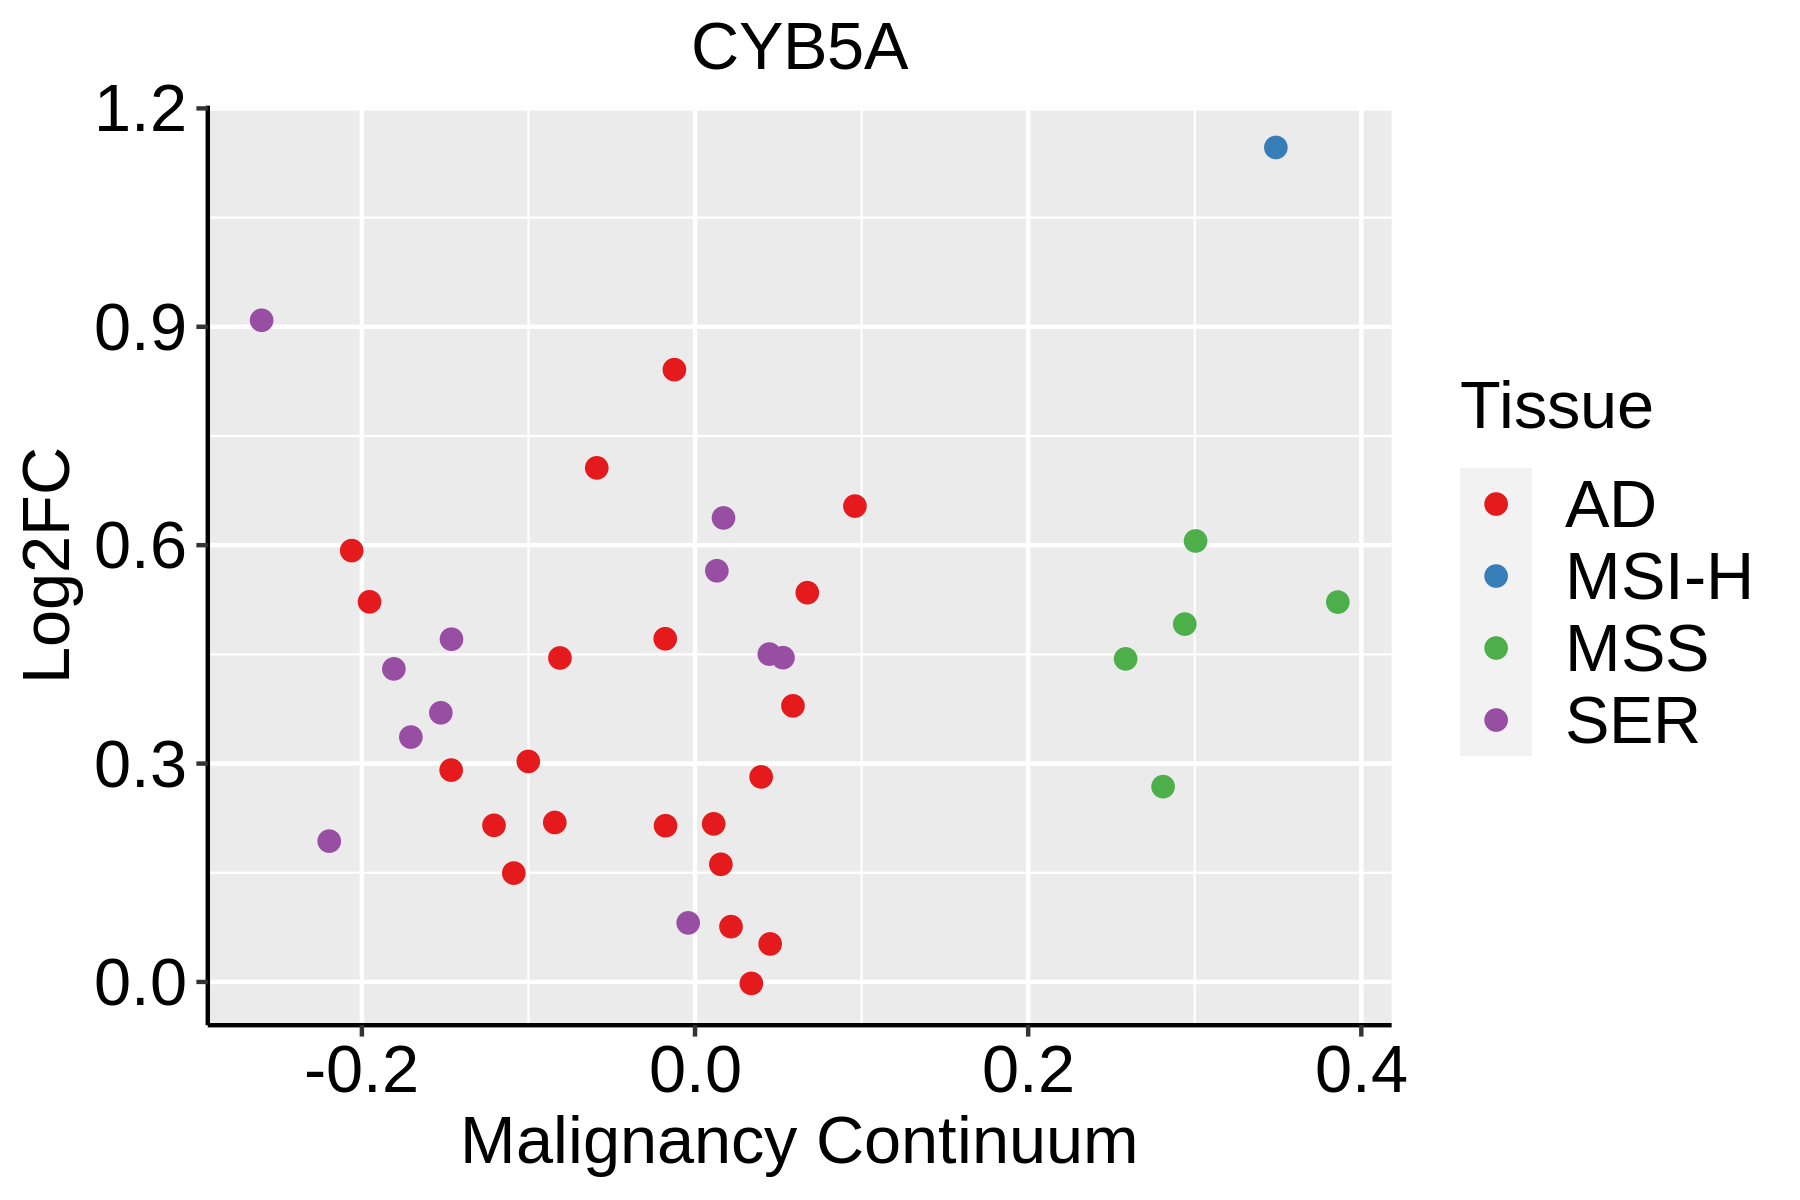 | AD: Adenomas |
| SER: Sessile serrated lesions | ||
| MSI-H: Microsatellite-high colorectal cancer | ||
| MSS: Microsatellite stable colorectal cancer | ||
| Endometrium | 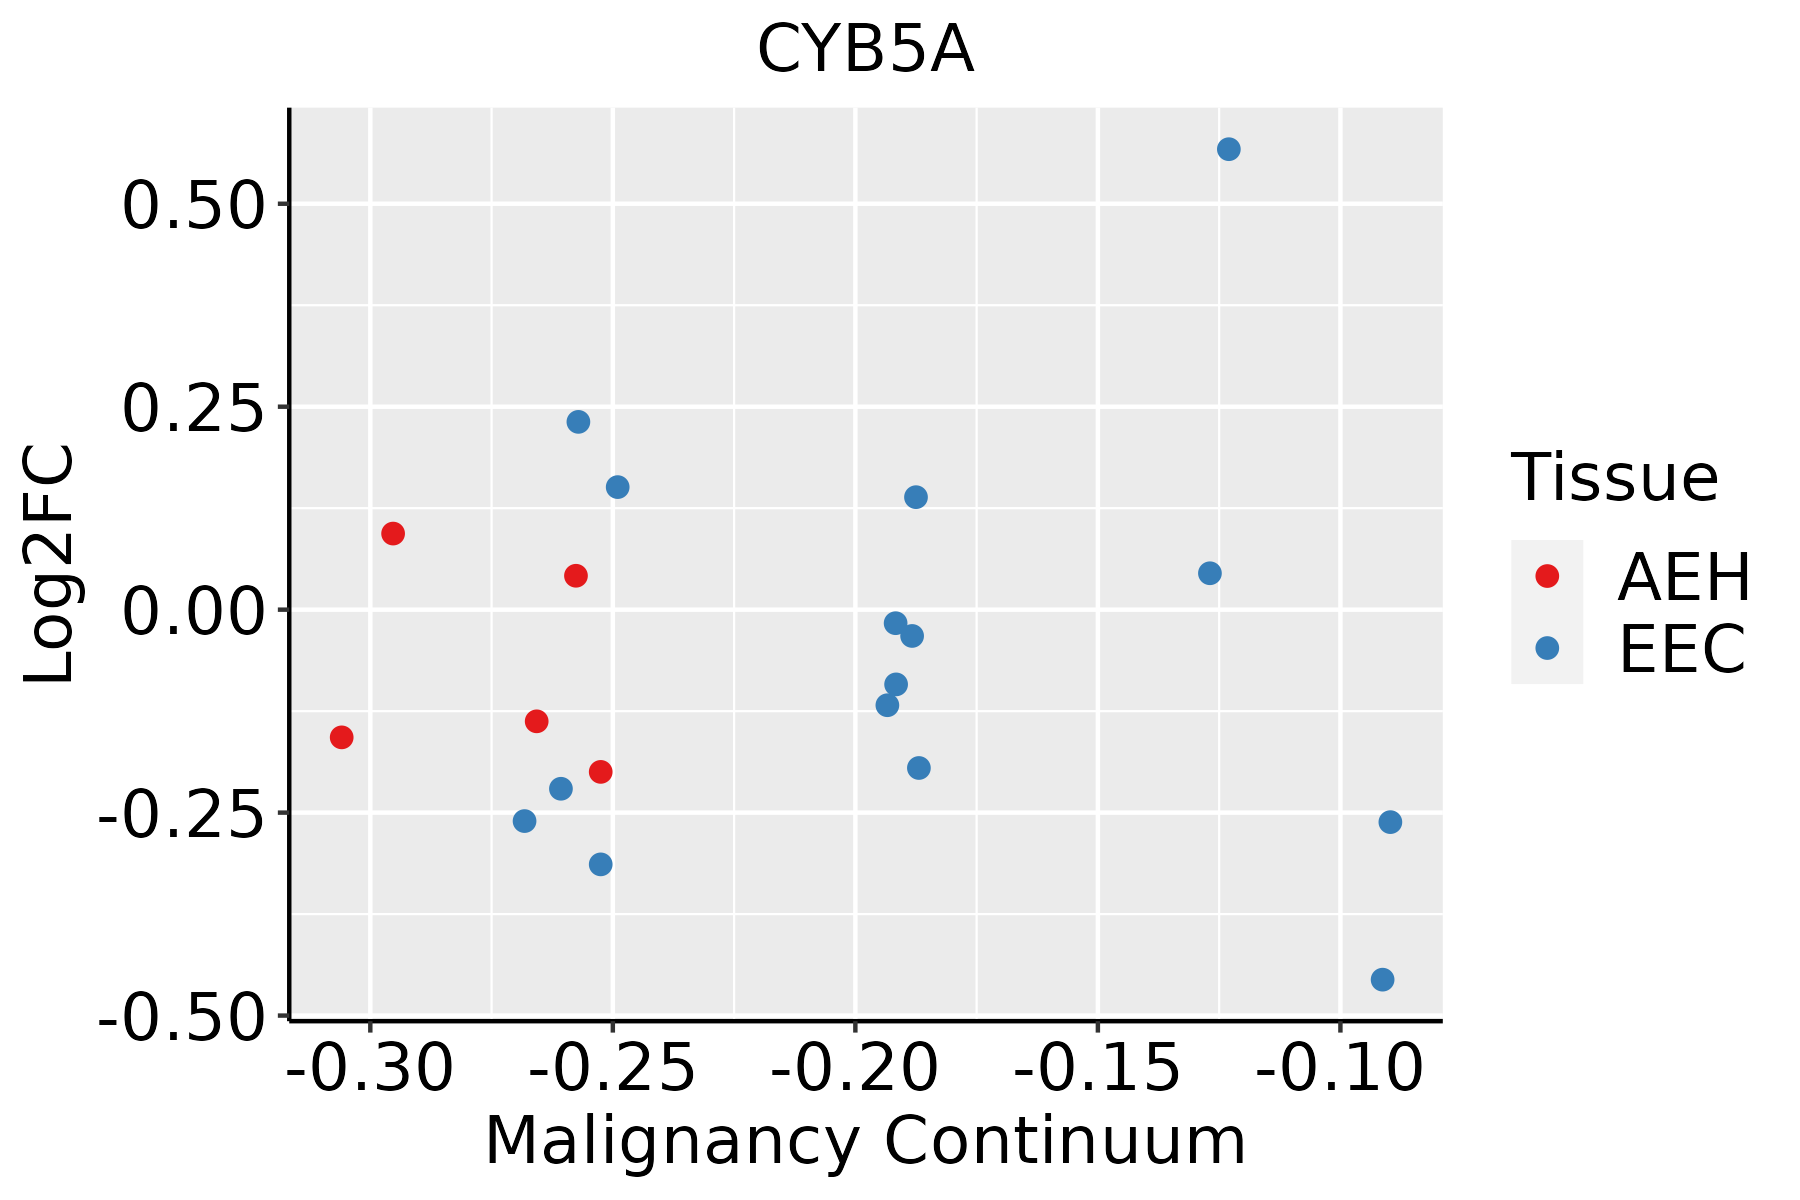 | AEH: Atypical endometrial hyperplasia |
| EEC: Endometrioid Cancer | ||
| Esophagus | 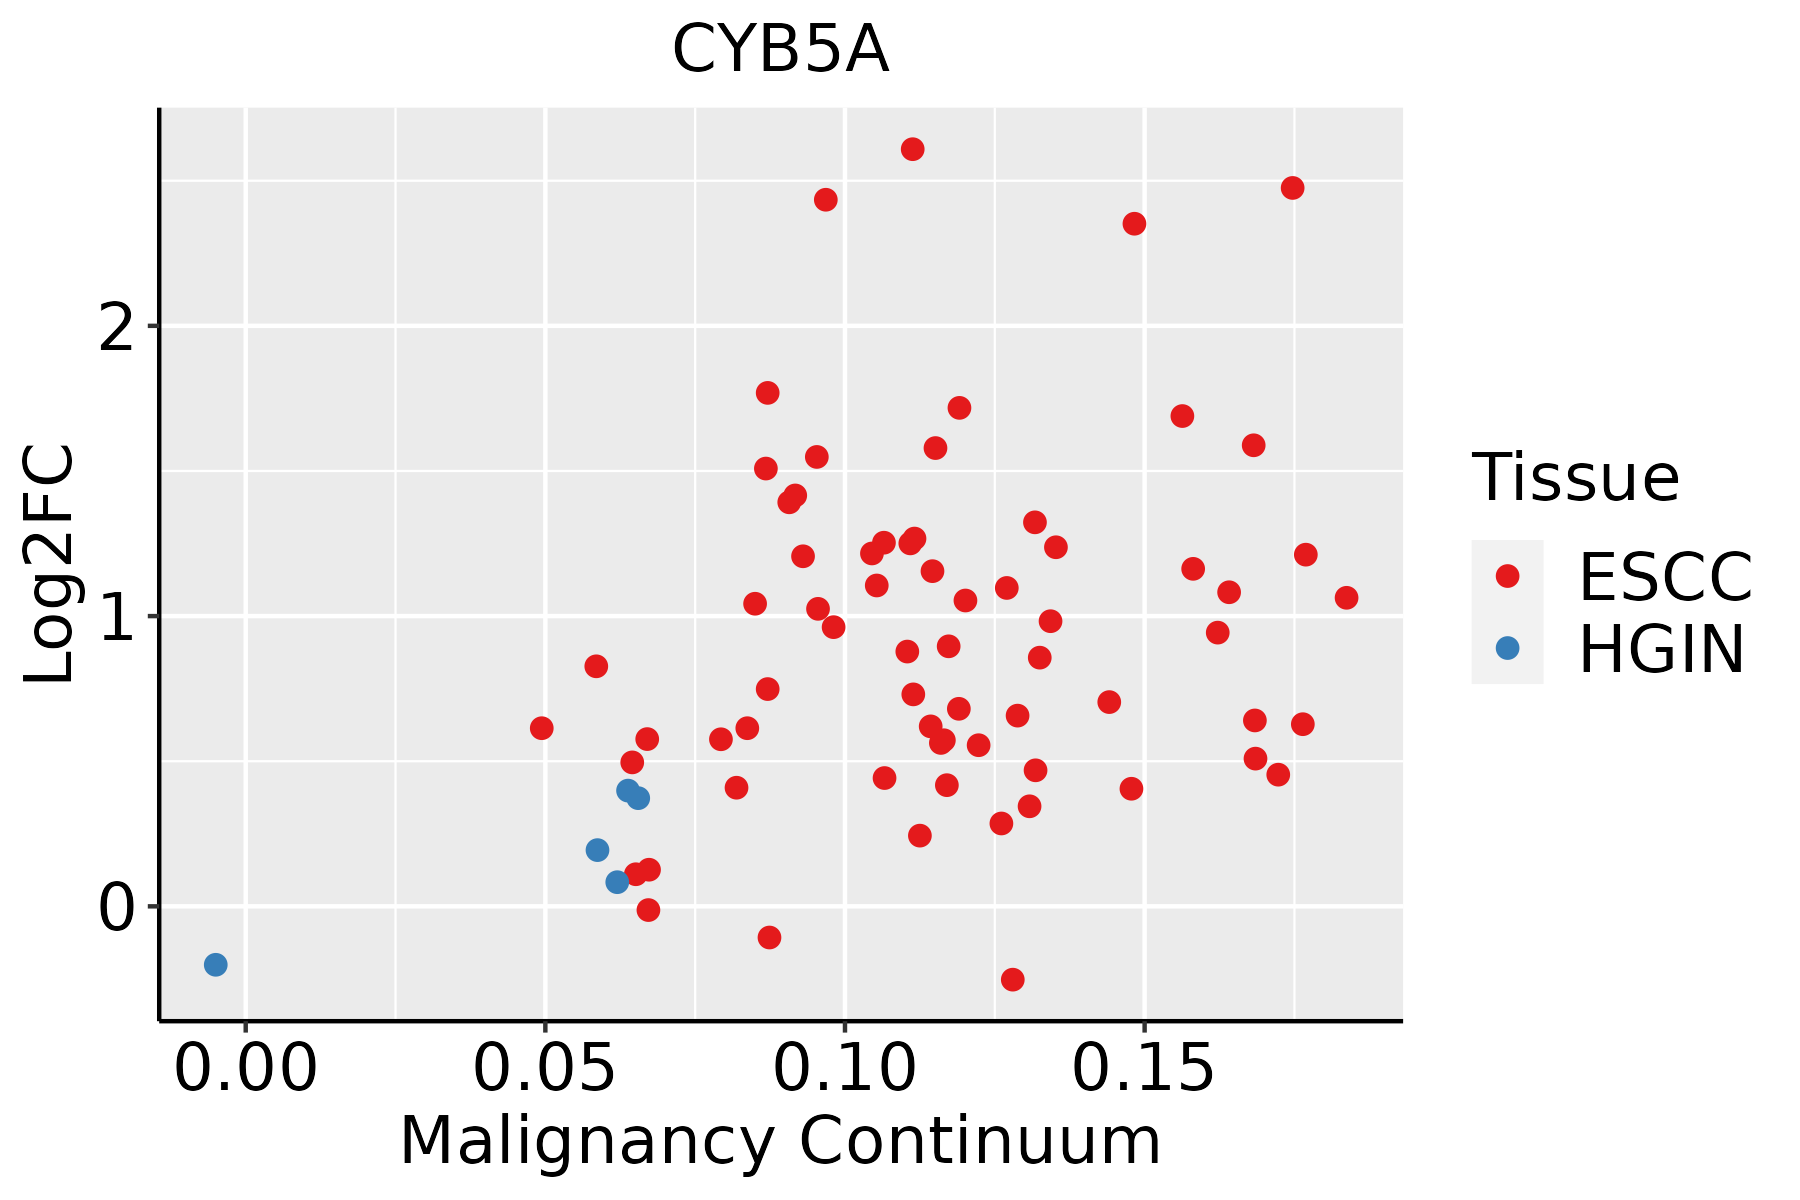 | ESCC: Esophageal squamous cell carcinoma |
| HGIN: High-grade intraepithelial neoplasias | ||
| LGIN: Low-grade intraepithelial neoplasias | ||
| Liver | 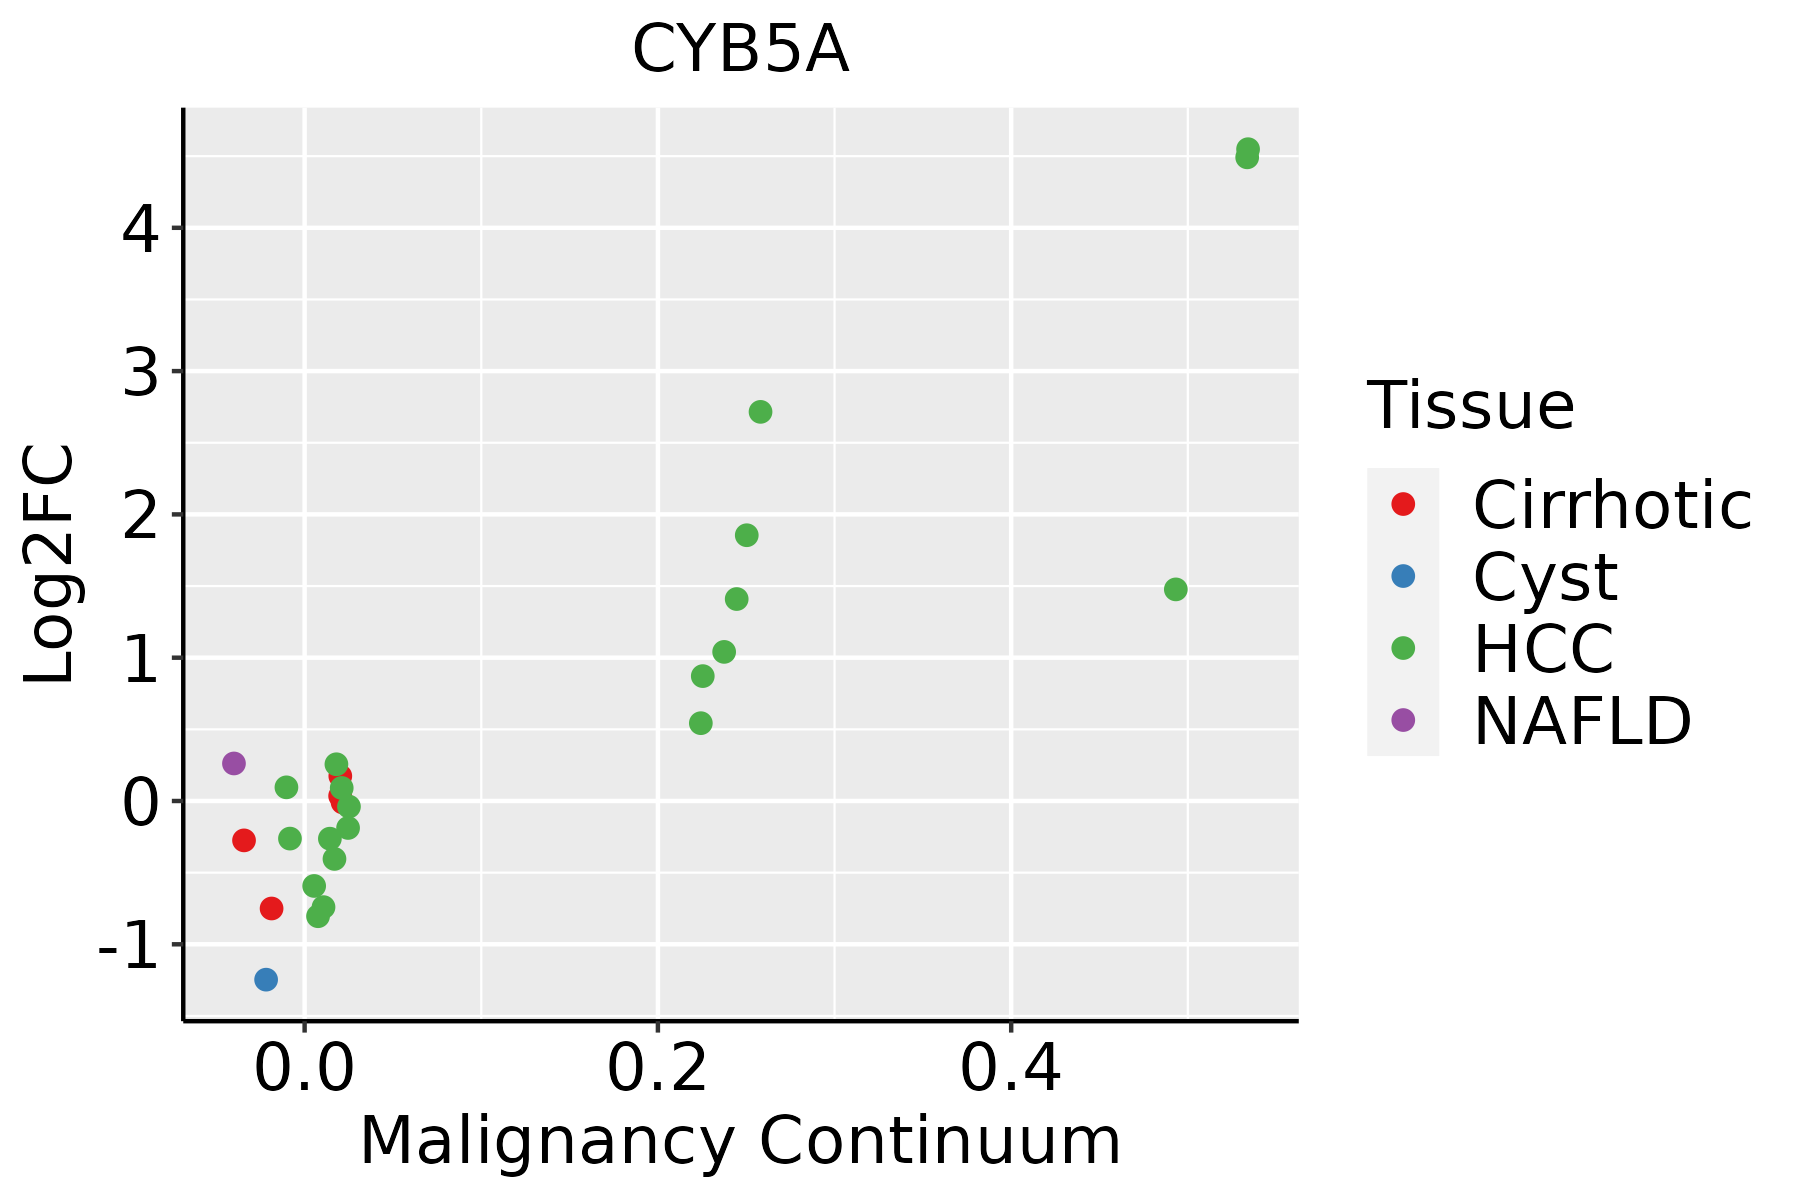 | HCC: Hepatocellular carcinoma |
| NAFLD: Non-alcoholic fatty liver disease | ||
| Lung | 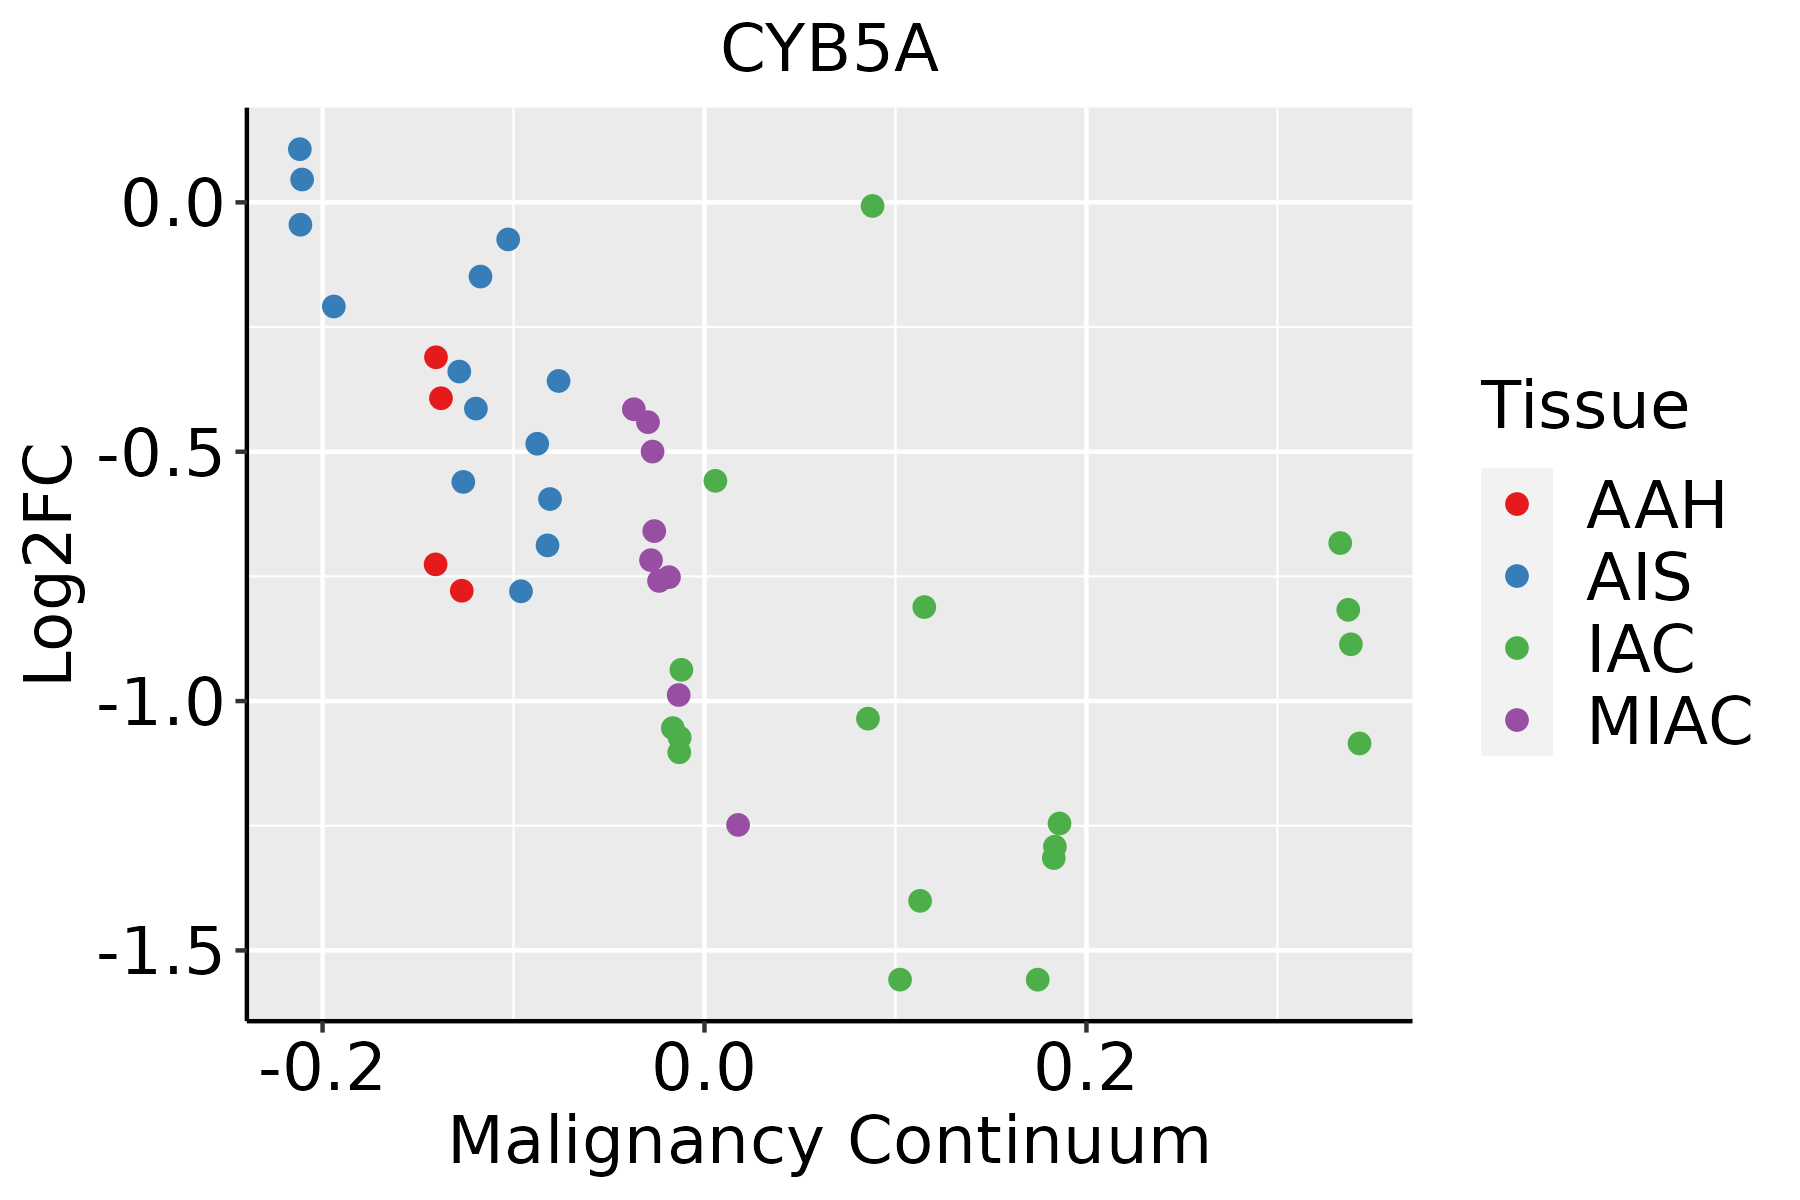 | AAH: Atypical adenomatous hyperplasia |
| AIS: Adenocarcinoma in situ | ||
| IAC: Invasive lung adenocarcinoma | ||
| MIA: Minimally invasive adenocarcinoma | ||
| Oral Cavity |  | EOLP: Erosive Oral lichen planus |
| LP: leukoplakia | ||
| NEOLP: Non-erosive oral lichen planus | ||
| OSCC: Oral squamous cell carcinoma | ||
| Prostate |  | BPH: Benign Prostatic Hyperplasia |
| Thyroid | 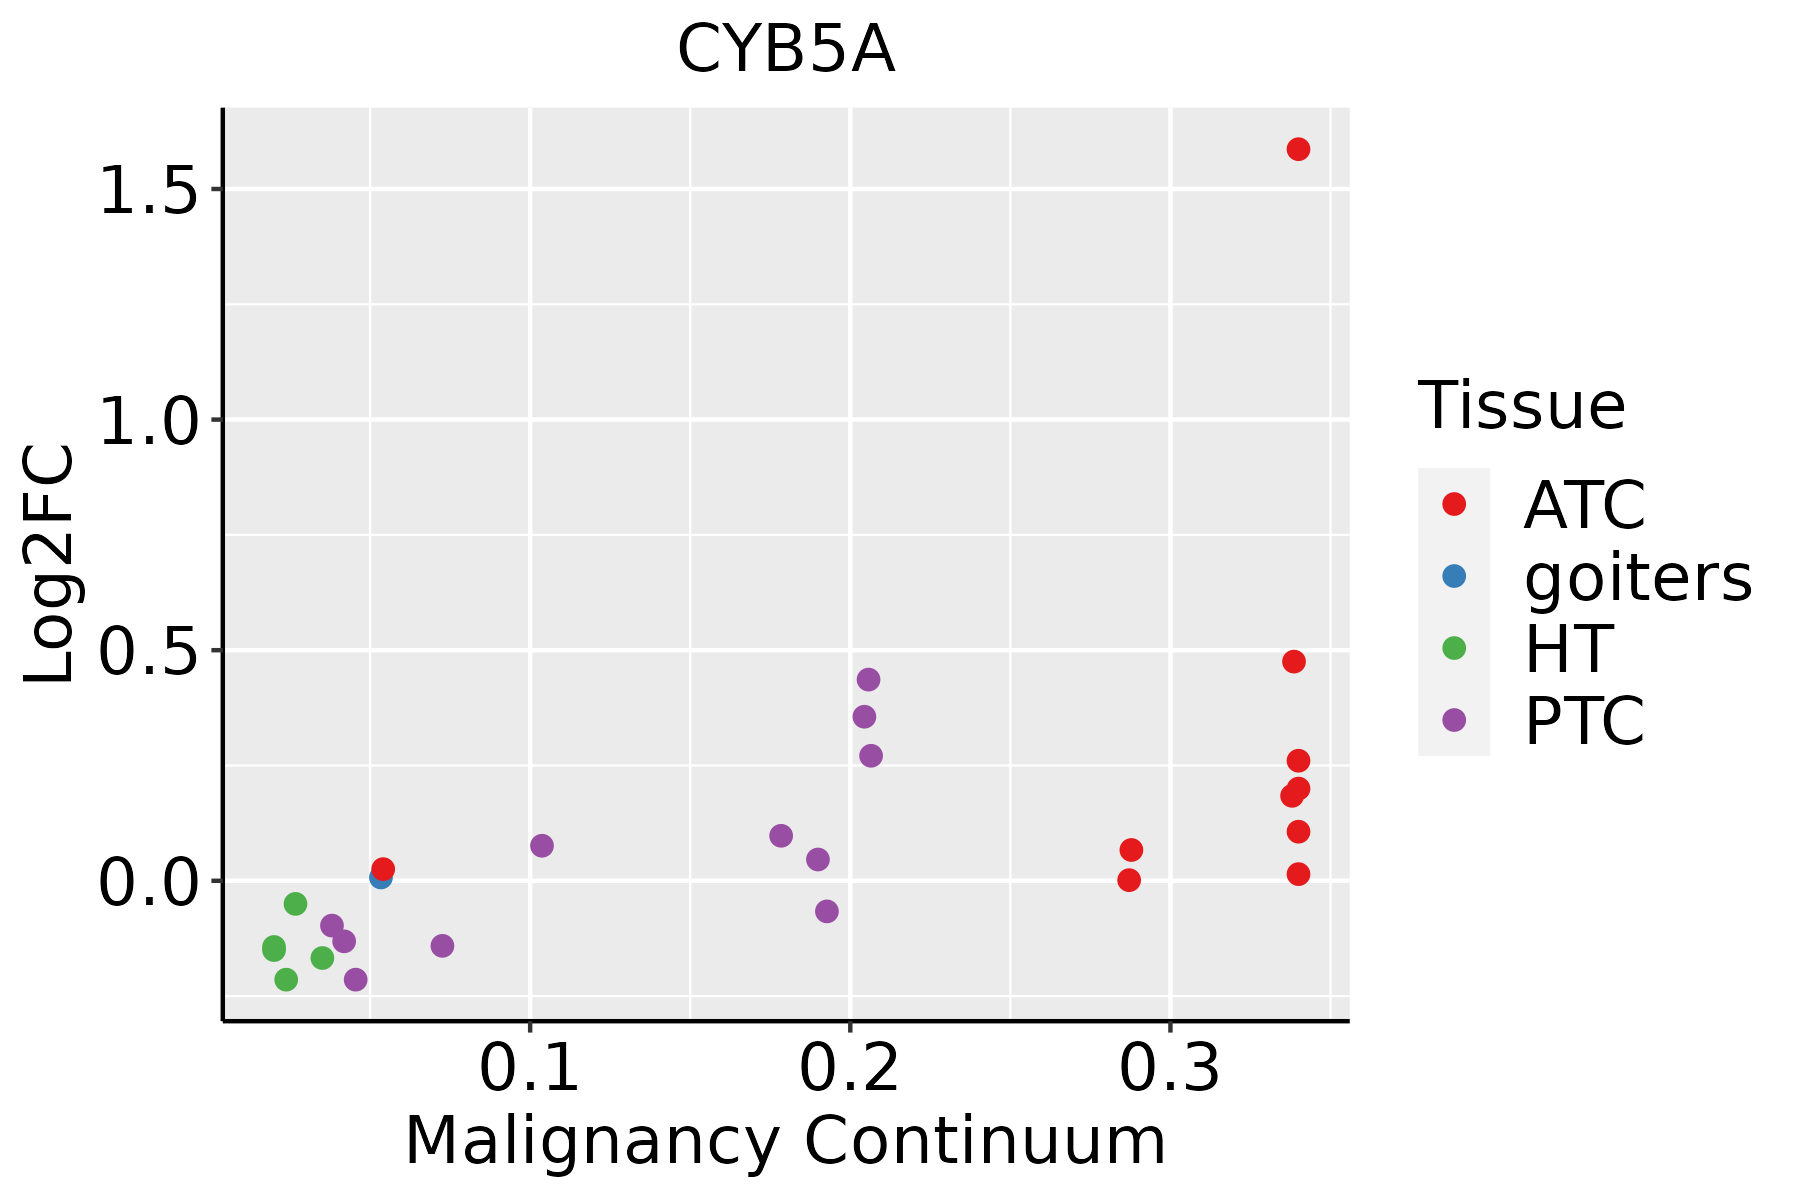 | ATC: Anaplastic thyroid cancer |
| HT: Hashimoto's thyroiditis | ||
| PTC: Papillary thyroid cancer |
| ∗log2FC in expression of this searched gene in stem-like cells from each diseased tissue sample relative to stem-like cells in normal samples in each tissue plotted against the malignancy continuum. Samples are colored based on if they are from different disease stage. |
Top |
Malignant transformation related pathway analysis |
| Find out the enriched GO biological processes and KEGG pathways involved in transition from healthy to precancer to cancer |
| Tissue | Disease Stage | Enriched GO biological Processes |
| Colorectum | AD |  |
| Colorectum | SER |  |
| Colorectum | MSS |  |
| Colorectum | MSI-H |  |
| Colorectum | FAP |  |
| ∗Top 15 enriched GO BP terms are showed in the bar plot of each disease state in each tissue. Each row represents a significant GO biological process which is colored according to the -log10(p.adjust). |
| Page: 1 2 3 4 5 6 7 8 9 |
| GO ID | Tissue | Disease Stage | Description | Gene Ratio | Bg Ratio | pvalue | p.adjust | Count |
| GO:00060918 | Breast | Precancer | generation of precursor metabolites and energy | 94/1080 | 490/18723 | 1.54e-25 | 1.64e-22 | 94 |
| GO:00229008 | Breast | Precancer | electron transport chain | 42/1080 | 175/18723 | 1.37e-15 | 4.59e-13 | 42 |
| GO:19026008 | Breast | Precancer | proton transmembrane transport | 39/1080 | 157/18723 | 4.18e-15 | 1.18e-12 | 39 |
| GO:00100389 | Breast | Precancer | response to metal ion | 47/1080 | 373/18723 | 3.88e-07 | 1.79e-05 | 47 |
| GO:00466868 | Breast | Precancer | response to cadmium ion | 14/1080 | 68/18723 | 2.74e-05 | 6.21e-04 | 14 |
| GO:000609113 | Breast | IDC | generation of precursor metabolites and energy | 103/1434 | 490/18723 | 1.53e-21 | 1.74e-18 | 103 |
| GO:002290013 | Breast | IDC | electron transport chain | 51/1434 | 175/18723 | 2.23e-17 | 8.43e-15 | 51 |
| GO:190260012 | Breast | IDC | proton transmembrane transport | 40/1434 | 157/18723 | 7.34e-12 | 1.34e-09 | 40 |
| GO:001003814 | Breast | IDC | response to metal ion | 65/1434 | 373/18723 | 2.95e-10 | 3.42e-08 | 65 |
| GO:004668613 | Breast | IDC | response to cadmium ion | 19/1434 | 68/18723 | 4.97e-07 | 2.45e-05 | 19 |
| GO:000609123 | Breast | DCIS | generation of precursor metabolites and energy | 103/1390 | 490/18723 | 1.46e-22 | 1.65e-19 | 103 |
| GO:002290023 | Breast | DCIS | electron transport chain | 51/1390 | 175/18723 | 6.01e-18 | 2.62e-15 | 51 |
| GO:190260022 | Breast | DCIS | proton transmembrane transport | 40/1390 | 157/18723 | 2.77e-12 | 5.80e-10 | 40 |
| GO:001003824 | Breast | DCIS | response to metal ion | 65/1390 | 373/18723 | 8.03e-11 | 9.88e-09 | 65 |
| GO:004668623 | Breast | DCIS | response to cadmium ion | 19/1390 | 68/18723 | 3.07e-07 | 1.46e-05 | 19 |
| GO:0006091 | Colorectum | AD | generation of precursor metabolites and energy | 209/3918 | 490/18723 | 3.17e-28 | 6.61e-25 | 209 |
| GO:0022900 | Colorectum | AD | electron transport chain | 89/3918 | 175/18723 | 1.42e-18 | 8.91e-16 | 89 |
| GO:1902600 | Colorectum | AD | proton transmembrane transport | 66/3918 | 157/18723 | 1.59e-09 | 1.17e-07 | 66 |
| GO:0046686 | Colorectum | AD | response to cadmium ion | 27/3918 | 68/18723 | 3.19e-04 | 3.80e-03 | 27 |
| GO:0010038 | Colorectum | AD | response to metal ion | 106/3918 | 373/18723 | 3.22e-04 | 3.83e-03 | 106 |
| Page: 1 2 3 4 5 |
| Pathway ID | Tissue | Disease Stage | Description | Gene Ratio | Bg Ratio | pvalue | p.adjust | qvalue | Count |
| Page: 1 |
Top |
Cell-cell communication analysis |
| Identification of potential cell-cell interactions between two cell types and their ligand-receptor pairs for different disease states |
| Ligand | Receptor | LRpair | Pathway | Tissue | Disease Stage |
| Page: 1 |
Top |
Single-cell gene regulatory network inference analysis |
| Find out the significant the regulons (TFs) and the target genes of each regulon across cell types for different disease states |
| TF | Cell Type | Tissue | Disease Stage | Target Gene | RSS | Regulon Activity |
| ∗The dot plots of a searched regulon are shown for all cell subpopulations in each disease state of each tissue based on the regulon specific score inferred using pySCENIC and by calculating the average expression. |
| Page: 1 |
Top |
Somatic mutation of malignant transformation related genes |
| Annotation of somatic variants for genes involved in malignant transformation |
| Hugo Symbol | Variant Class | Variant Classification | dbSNP RS | HGVSc | HGVSp | HGVSp Short | SWISSPROT | BIOTYPE | SIFT | PolyPhen | Tumor Sample Barcode | Tissue | Histology | Sex | Age | Stage | Therapy Types | Drugs | Outcome |
| CYB5A | SNV | Missense_Mutation | novel | c.232N>C | p.Thr78Pro | p.T78P | P00167 | protein_coding | tolerated(0.05) | benign(0.23) | TCGA-AO-A128-01 | Breast | breast invasive carcinoma | Female | <65 | I/II | Chemotherapy | doxorubicin | SD |
| CYB5A | SNV | Missense_Mutation | c.127N>C | p.Glu43Gln | p.E43Q | P00167 | protein_coding | deleterious(0.03) | benign(0.366) | TCGA-GM-A2D9-01 | Breast | breast invasive carcinoma | Female | >=65 | I/II | Hormone Therapy | arimidex | SD | |
| CYB5A | SNV | Missense_Mutation | novel | c.245N>A | p.Gly82Glu | p.G82E | P00167 | protein_coding | deleterious(0) | probably_damaging(1) | TCGA-2W-A8YY-01 | Cervix | cervical & endocervical cancer | Female | <65 | I/II | Chemotherapy | cisplatin | CR |
| CYB5A | SNV | Missense_Mutation | c.48N>T | p.Glu16Asp | p.E16D | P00167 | protein_coding | tolerated(0.06) | probably_damaging(0.998) | TCGA-AA-A010-01 | Colorectum | colon adenocarcinoma | Female | <65 | I/II | Chemotherapy | folinic | CR | |
| CYB5A | SNV | Missense_Mutation | rs370149747 | c.196N>A | p.Val66Ile | p.V66I | P00167 | protein_coding | deleterious(0.04) | benign(0.036) | TCGA-B5-A1MX-01 | Endometrium | uterine corpus endometrioid carcinoma | Female | <65 | I/II | Hormone Therapy | megace | SD |
| CYB5A | SNV | Missense_Mutation | novel | c.191N>T | p.Glu64Val | p.E64V | P00167 | protein_coding | deleterious(0) | probably_damaging(0.963) | TCGA-BS-A0UF-01 | Endometrium | uterine corpus endometrioid carcinoma | Female | >=65 | I/II | Unknown | Unknown | SD |
| CYB5A | SNV | Missense_Mutation | rs770734233 | c.175G>A | p.Ala59Thr | p.A59T | P00167 | protein_coding | deleterious(0) | probably_damaging(0.987) | TCGA-E6-A2P8-01 | Endometrium | uterine corpus endometrioid carcinoma | Female | <65 | III/IV | Unknown | Unknown | PD |
| CYB5A | SNV | Missense_Mutation | novel | c.364N>C | p.Ala122Pro | p.A122P | P00167 | protein_coding | deleterious(0.01) | benign(0.328) | TCGA-EO-A22R-01 | Endometrium | uterine corpus endometrioid carcinoma | Female | <65 | I/II | Unknown | Unknown | SD |
| CYB5A | SNV | Missense_Mutation | novel | c.392N>C | p.Met131Thr | p.M131T | P00167 | protein_coding | tolerated(0.83) | benign(0) | TCGA-FI-A2F4-01 | Endometrium | uterine corpus endometrioid carcinoma | Female | <65 | I/II | Unknown | Unknown | SD |
| CYB5A | deletion | Frame_Shift_Del | novel | c.84_96delNNNNNNNNNNNNN | p.Ile29ArgfsTer5 | p.I29Rfs*5 | P00167 | protein_coding | TCGA-CC-A3MC-01 | Liver | liver hepatocellular carcinoma | Male | <65 | III/IV | Unknown | Unknown | PD |
| Page: 1 2 |
Top |
Related drugs of malignant transformation related genes |
| Identification of chemicals and drugs interact with genes involved in malignant transfromation |
| (DGIdb 4.0) |
| Entrez ID | Symbol | Category | Interaction Types | Drug Claim Name | Drug Name | PMIDs |
| Page: 1 |

Copyright 2023-Present -The University of Texas Health Science Center at Houston |