
|
|||||
|
 | |
| |
| |
| |
| |
| |
|
Gene: CYB561A3 |
Gene summary for CYB561A3 |
| Gene information | Species | Human | Gene symbol | CYB561A3 | Gene ID | 220002 |
| Gene name | cytochrome b561 family member A3 | |
| Gene Alias | CYBASC3 | |
| Cytomap | 11q12.2 | |
| Gene Type | protein-coding | GO ID | GO:0006810 | UniProtAcc | Q8NBI2 |
Top |
Malignant transformation analysis |
| Identification of the aberrant gene expression in precancerous and cancerous lesions by comparing the gene expression of stem-like cells in diseased tissues with normal stem cells |
| Entrez ID | Symbol | Replicates | Species | Organ | Tissue | Adj P-value | Log2FC | Malignancy |
| 220002 | CYB561A3 | LZE4T | Human | Esophagus | ESCC | 1.14e-04 | 1.36e-01 | 0.0811 |
| 220002 | CYB561A3 | LZE7T | Human | Esophagus | ESCC | 1.13e-04 | 3.84e-01 | 0.0667 |
| 220002 | CYB561A3 | LZE8T | Human | Esophagus | ESCC | 5.25e-06 | 2.20e-01 | 0.067 |
| 220002 | CYB561A3 | LZE24T | Human | Esophagus | ESCC | 4.00e-12 | 3.73e-01 | 0.0596 |
| 220002 | CYB561A3 | P1T-E | Human | Esophagus | ESCC | 9.73e-05 | 3.38e-01 | 0.0875 |
| 220002 | CYB561A3 | P2T-E | Human | Esophagus | ESCC | 4.07e-26 | 3.81e-01 | 0.1177 |
| 220002 | CYB561A3 | P4T-E | Human | Esophagus | ESCC | 2.03e-23 | 5.67e-01 | 0.1323 |
| 220002 | CYB561A3 | P5T-E | Human | Esophagus | ESCC | 5.58e-10 | 1.78e-01 | 0.1327 |
| 220002 | CYB561A3 | P8T-E | Human | Esophagus | ESCC | 1.04e-11 | 2.40e-01 | 0.0889 |
| 220002 | CYB561A3 | P9T-E | Human | Esophagus | ESCC | 8.81e-12 | 2.26e-01 | 0.1131 |
| 220002 | CYB561A3 | P10T-E | Human | Esophagus | ESCC | 5.25e-16 | 2.74e-01 | 0.116 |
| 220002 | CYB561A3 | P11T-E | Human | Esophagus | ESCC | 8.61e-19 | 8.25e-01 | 0.1426 |
| 220002 | CYB561A3 | P12T-E | Human | Esophagus | ESCC | 5.04e-24 | 3.83e-01 | 0.1122 |
| 220002 | CYB561A3 | P15T-E | Human | Esophagus | ESCC | 5.67e-07 | 1.70e-01 | 0.1149 |
| 220002 | CYB561A3 | P16T-E | Human | Esophagus | ESCC | 9.99e-24 | 4.04e-01 | 0.1153 |
| 220002 | CYB561A3 | P17T-E | Human | Esophagus | ESCC | 1.75e-10 | 4.58e-01 | 0.1278 |
| 220002 | CYB561A3 | P20T-E | Human | Esophagus | ESCC | 1.55e-10 | 2.92e-01 | 0.1124 |
| 220002 | CYB561A3 | P21T-E | Human | Esophagus | ESCC | 2.38e-32 | 6.60e-01 | 0.1617 |
| 220002 | CYB561A3 | P22T-E | Human | Esophagus | ESCC | 6.11e-29 | 2.81e-01 | 0.1236 |
| 220002 | CYB561A3 | P23T-E | Human | Esophagus | ESCC | 1.25e-30 | 7.43e-01 | 0.108 |
| Page: 1 2 3 4 5 |
| Tissue | Expression Dynamics | Abbreviation |
| Esophagus |  | ESCC: Esophageal squamous cell carcinoma |
| HGIN: High-grade intraepithelial neoplasias | ||
| LGIN: Low-grade intraepithelial neoplasias | ||
| Liver |  | HCC: Hepatocellular carcinoma |
| NAFLD: Non-alcoholic fatty liver disease | ||
| Oral Cavity | 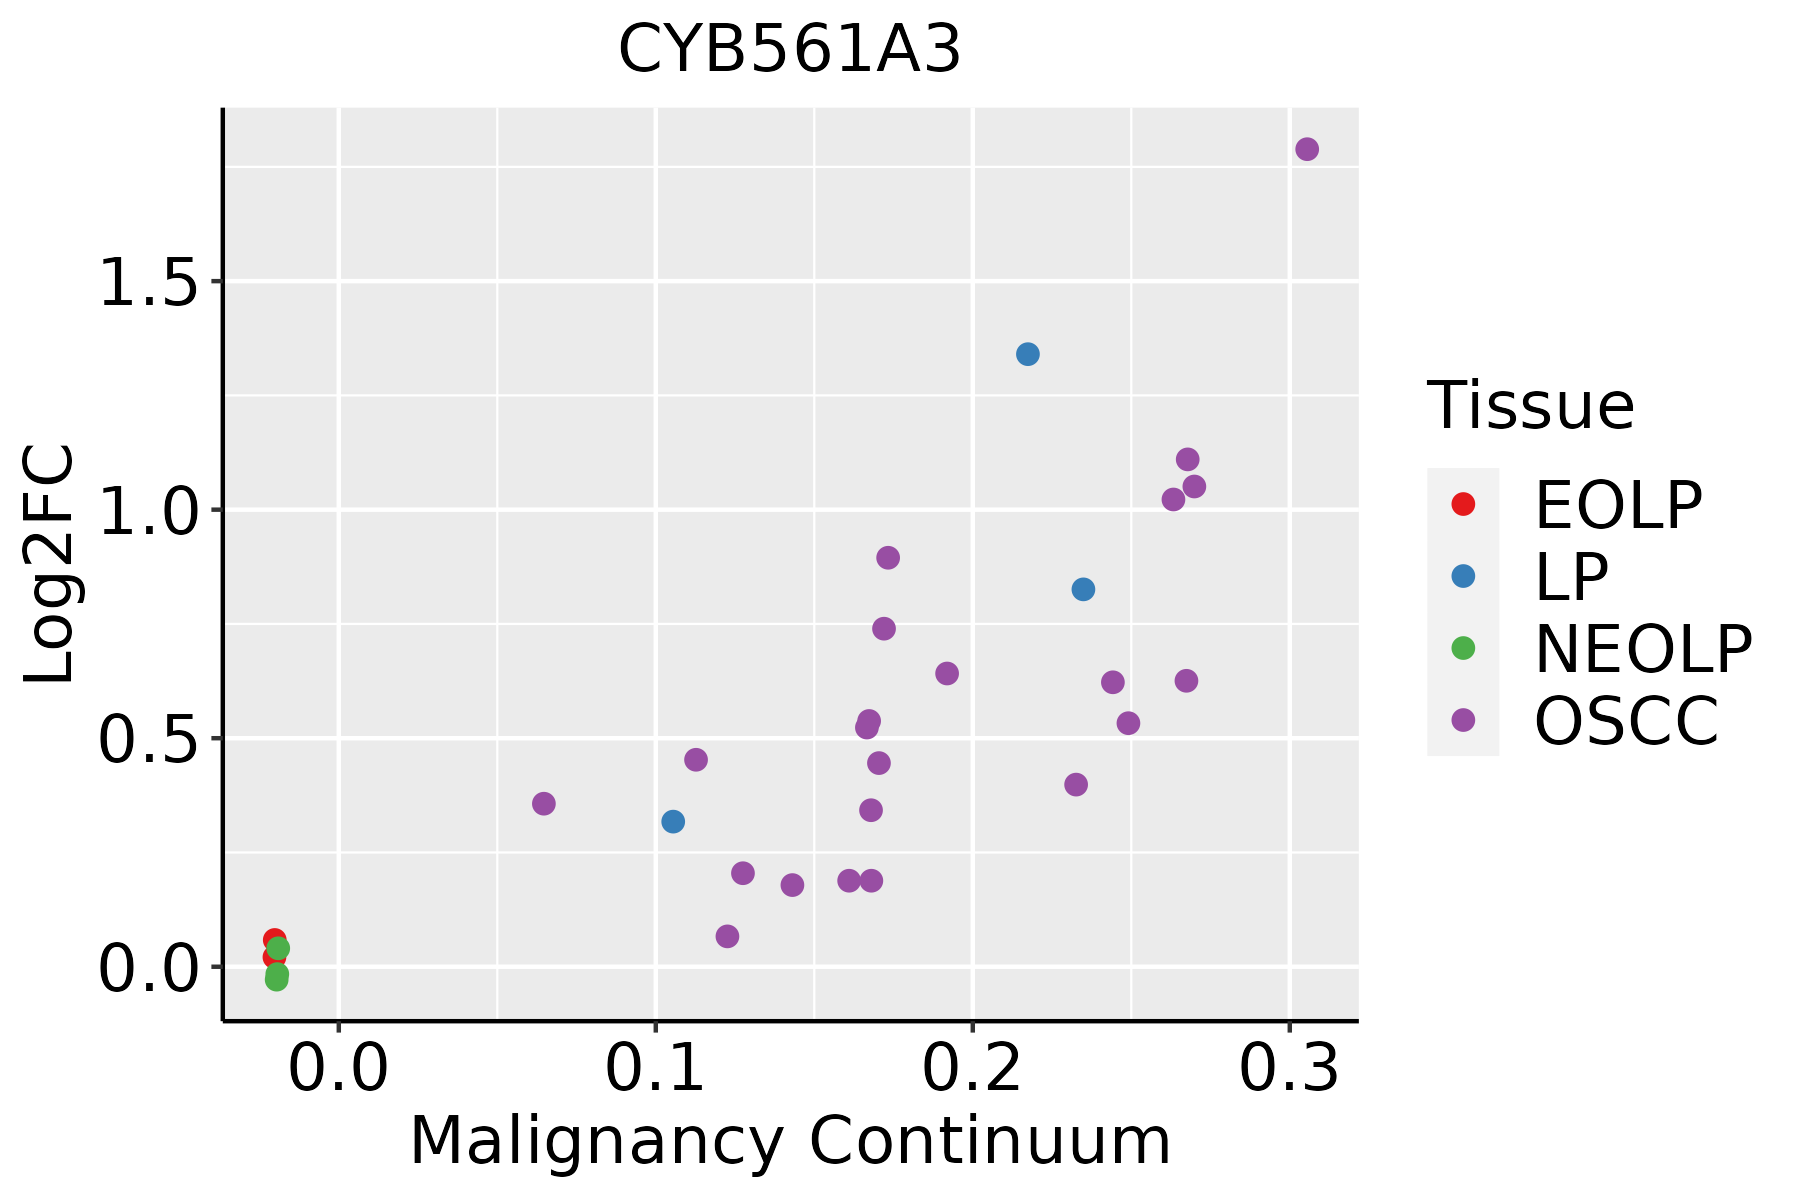 | EOLP: Erosive Oral lichen planus |
| LP: leukoplakia | ||
| NEOLP: Non-erosive oral lichen planus | ||
| OSCC: Oral squamous cell carcinoma | ||
| Skin |  | AK: Actinic keratosis |
| cSCC: Cutaneous squamous cell carcinoma | ||
| SCCIS:squamous cell carcinoma in situ |
| ∗log2FC in expression of this searched gene in stem-like cells from each diseased tissue sample relative to stem-like cells in normal samples in each tissue plotted against the malignancy continuum. Samples are colored based on if they are from different disease stage. |
Top |
Malignant transformation related pathway analysis |
| Find out the enriched GO biological processes and KEGG pathways involved in transition from healthy to precancer to cancer |
| Tissue | Disease Stage | Enriched GO biological Processes |
| Colorectum | AD |  |
| Colorectum | SER |  |
| Colorectum | MSS |  |
| Colorectum | MSI-H |  |
| Colorectum | FAP |  |
| ∗Top 15 enriched GO BP terms are showed in the bar plot of each disease state in each tissue. Each row represents a significant GO biological process which is colored according to the -log10(p.adjust). |
| Page: 1 2 3 4 5 6 7 8 9 |
| GO ID | Tissue | Disease Stage | Description | Gene Ratio | Bg Ratio | pvalue | p.adjust | Count |
| GO:005507617 | Esophagus | ESCC | transition metal ion homeostasis | 87/8552 | 138/18723 | 2.85e-05 | 2.37e-04 | 87 |
| GO:00469169 | Esophagus | ESCC | cellular transition metal ion homeostasis | 70/8552 | 115/18723 | 7.28e-04 | 3.79e-03 | 70 |
| GO:00550729 | Esophagus | ESCC | iron ion homeostasis | 52/8552 | 85/18723 | 2.86e-03 | 1.21e-02 | 52 |
| GO:00550766 | Liver | Cirrhotic | transition metal ion homeostasis | 59/4634 | 138/18723 | 2.59e-06 | 4.65e-05 | 59 |
| GO:00469164 | Liver | Cirrhotic | cellular transition metal ion homeostasis | 48/4634 | 115/18723 | 4.51e-05 | 5.30e-04 | 48 |
| GO:00550724 | Liver | Cirrhotic | iron ion homeostasis | 35/4634 | 85/18723 | 6.22e-04 | 4.79e-03 | 35 |
| GO:00068792 | Liver | Cirrhotic | cellular iron ion homeostasis | 26/4634 | 67/18723 | 7.53e-03 | 3.57e-02 | 26 |
| GO:005507612 | Liver | HCC | transition metal ion homeostasis | 81/7958 | 138/18723 | 8.87e-05 | 7.72e-04 | 81 |
| GO:004691611 | Liver | HCC | cellular transition metal ion homeostasis | 67/7958 | 115/18723 | 4.64e-04 | 3.08e-03 | 67 |
| GO:005507211 | Liver | HCC | iron ion homeostasis | 47/7958 | 85/18723 | 1.17e-02 | 4.28e-02 | 47 |
| GO:005507610 | Oral cavity | OSCC | transition metal ion homeostasis | 81/7305 | 138/18723 | 2.13e-06 | 2.72e-05 | 81 |
| GO:00469168 | Oral cavity | OSCC | cellular transition metal ion homeostasis | 64/7305 | 115/18723 | 2.13e-04 | 1.40e-03 | 64 |
| GO:00550728 | Oral cavity | OSCC | iron ion homeostasis | 46/7305 | 85/18723 | 3.31e-03 | 1.42e-02 | 46 |
| GO:005507616 | Oral cavity | LP | transition metal ion homeostasis | 54/4623 | 138/18723 | 1.19e-04 | 1.40e-03 | 54 |
| GO:004691615 | Oral cavity | LP | cellular transition metal ion homeostasis | 46/4623 | 115/18723 | 2.02e-04 | 2.20e-03 | 46 |
| GO:005507618 | Skin | cSCC | transition metal ion homeostasis | 57/4864 | 138/18723 | 5.96e-05 | 5.86e-04 | 57 |
| GO:004691610 | Skin | cSCC | cellular transition metal ion homeostasis | 48/4864 | 115/18723 | 1.63e-04 | 1.43e-03 | 48 |
| Page: 1 |
| Pathway ID | Tissue | Disease Stage | Description | Gene Ratio | Bg Ratio | pvalue | p.adjust | qvalue | Count |
| Page: 1 |
Top |
Cell-cell communication analysis |
| Identification of potential cell-cell interactions between two cell types and their ligand-receptor pairs for different disease states |
| Ligand | Receptor | LRpair | Pathway | Tissue | Disease Stage |
| Page: 1 |
Top |
Single-cell gene regulatory network inference analysis |
| Find out the significant the regulons (TFs) and the target genes of each regulon across cell types for different disease states |
| TF | Cell Type | Tissue | Disease Stage | Target Gene | RSS | Regulon Activity |
| ∗The dot plots of a searched regulon are shown for all cell subpopulations in each disease state of each tissue based on the regulon specific score inferred using pySCENIC and by calculating the average expression. |
| Page: 1 |
Top |
Somatic mutation of malignant transformation related genes |
| Annotation of somatic variants for genes involved in malignant transformation |
| Hugo Symbol | Variant Class | Variant Classification | dbSNP RS | HGVSc | HGVSp | HGVSp Short | SWISSPROT | BIOTYPE | SIFT | PolyPhen | Tumor Sample Barcode | Tissue | Histology | Sex | Age | Stage | Therapy Types | Drugs | Outcome |
| CYB561A3 | SNV | Missense_Mutation | novel | c.669N>T | p.Trp223Cys | p.W223C | protein_coding | deleterious(0) | probably_damaging(0.999) | TCGA-VS-A952-01 | Cervix | cervical & endocervical cancer | Female | >=65 | I/II | Unknown | Unknown | SD | |
| CYB561A3 | SNV | Missense_Mutation | novel | c.494N>G | p.Ser165Cys | p.S165C | protein_coding | tolerated(0.19) | benign(0.015) | TCGA-VS-A952-01 | Cervix | cervical & endocervical cancer | Female | >=65 | I/II | Unknown | Unknown | SD | |
| CYB561A3 | SNV | Missense_Mutation | rs532050820 | c.683C>T | p.Pro228Leu | p.P228L | protein_coding | tolerated(0.09) | benign(0.007) | TCGA-AA-3973-01 | Colorectum | colon adenocarcinoma | Male | >=65 | III/IV | Targeted Molecular therapy | bevacizumab | SD | |
| CYB561A3 | SNV | Missense_Mutation | rs375115347 | c.505N>A | p.Ala169Thr | p.A169T | protein_coding | tolerated(0.07) | benign(0.014) | TCGA-AA-A010-01 | Colorectum | colon adenocarcinoma | Female | <65 | I/II | Chemotherapy | folinic | CR | |
| CYB561A3 | SNV | Missense_Mutation | novel | c.386N>T | p.Ala129Val | p.A129V | protein_coding | tolerated(0.27) | possibly_damaging(0.745) | TCGA-A5-A1OF-01 | Endometrium | uterine corpus endometrioid carcinoma | Female | <65 | I/II | Unknown | Unknown | SD | |
| CYB561A3 | SNV | Missense_Mutation | novel | c.449N>A | p.Ser150Asn | p.S150N | protein_coding | deleterious(0.02) | benign(0.015) | TCGA-AJ-A3OJ-01 | Endometrium | uterine corpus endometrioid carcinoma | Female | <65 | I/II | Chemotherapy | carboplatin | CR | |
| CYB561A3 | SNV | Missense_Mutation | rs764022418 | c.308N>T | p.Thr103Met | p.T103M | protein_coding | deleterious(0.01) | benign(0.367) | TCGA-AP-A056-01 | Endometrium | uterine corpus endometrioid carcinoma | Female | <65 | I/II | Unknown | Unknown | SD | |
| CYB561A3 | SNV | Missense_Mutation | novel | c.95N>A | p.Arg32His | p.R32H | protein_coding | tolerated(0.13) | benign(0.015) | TCGA-AP-A1DK-01 | Endometrium | uterine corpus endometrioid carcinoma | Female | <65 | I/II | Unknown | Unknown | SD | |
| CYB561A3 | SNV | Missense_Mutation | rs778479865 | c.401T>C | p.Leu134Pro | p.L134P | protein_coding | deleterious(0) | possibly_damaging(0.838) | TCGA-B5-A0JU-01 | Endometrium | uterine corpus endometrioid carcinoma | Female | <65 | I/II | Unknown | Unknown | SD | |
| CYB561A3 | SNV | Missense_Mutation | c.185N>T | p.Ala62Val | p.A62V | protein_coding | deleterious(0.02) | probably_damaging(0.984) | TCGA-B5-A11E-01 | Endometrium | uterine corpus endometrioid carcinoma | Female | <65 | I/II | Unknown | Unknown | SD |
| Page: 1 2 3 |
Top |
Related drugs of malignant transformation related genes |
| Identification of chemicals and drugs interact with genes involved in malignant transfromation |
| (DGIdb 4.0) |
| Entrez ID | Symbol | Category | Interaction Types | Drug Claim Name | Drug Name | PMIDs |
| Page: 1 |

Copyright 2023-Present -The University of Texas Health Science Center at Houston |