
|
|||||
|
 | |
| |
| |
| |
| |
| |
|
Gene: CYB561 |
Gene summary for CYB561 |
| Gene information | Species | Human | Gene symbol | CYB561 | Gene ID | 1534 |
| Gene name | cytochrome b561 | |
| Gene Alias | CYB561A1 | |
| Cytomap | 17q23.3 | |
| Gene Type | protein-coding | GO ID | GO:0006091 | UniProtAcc | B3KTA1 |
Top |
Malignant transformation analysis |
| Identification of the aberrant gene expression in precancerous and cancerous lesions by comparing the gene expression of stem-like cells in diseased tissues with normal stem cells |
| Entrez ID | Symbol | Replicates | Species | Organ | Tissue | Adj P-value | Log2FC | Malignancy |
| 1534 | CYB561 | HTA11_2487_2000001011 | Human | Colorectum | SER | 2.46e-07 | 2.62e-01 | -0.1808 |
| 1534 | CYB561 | HTA11_1938_2000001011 | Human | Colorectum | AD | 4.18e-02 | 2.39e-01 | -0.0811 |
| 1534 | CYB561 | HTA11_78_2000001011 | Human | Colorectum | AD | 5.15e-07 | 3.10e-01 | -0.1088 |
| 1534 | CYB561 | HTA11_347_2000001011 | Human | Colorectum | AD | 1.59e-20 | 5.23e-01 | -0.1954 |
| 1534 | CYB561 | HTA11_411_2000001011 | Human | Colorectum | SER | 1.75e-02 | 4.05e-01 | -0.2602 |
| 1534 | CYB561 | HTA11_3361_2000001011 | Human | Colorectum | AD | 8.60e-03 | 1.56e-01 | -0.1207 |
| 1534 | CYB561 | HTA11_83_2000001011 | Human | Colorectum | SER | 4.07e-09 | 4.94e-01 | -0.1526 |
| 1534 | CYB561 | HTA11_696_2000001011 | Human | Colorectum | AD | 3.37e-07 | 3.91e-01 | -0.1464 |
| 1534 | CYB561 | HTA11_866_2000001011 | Human | Colorectum | AD | 8.79e-03 | 2.02e-01 | -0.1001 |
| 1534 | CYB561 | HTA11_1391_2000001011 | Human | Colorectum | AD | 5.01e-06 | 3.36e-01 | -0.059 |
| 1534 | CYB561 | HTA11_2992_2000001011 | Human | Colorectum | SER | 1.53e-02 | 2.68e-01 | -0.1706 |
| 1534 | CYB561 | HTA11_7696_3000711011 | Human | Colorectum | AD | 4.23e-12 | 3.63e-01 | 0.0674 |
| 1534 | CYB561 | HTA11_99999970781_79442 | Human | Colorectum | MSS | 6.99e-05 | 2.24e-01 | 0.294 |
| 1534 | CYB561 | HTA11_99999965062_69753 | Human | Colorectum | MSI-H | 4.95e-04 | 9.38e-01 | 0.3487 |
| 1534 | CYB561 | HTA11_99999965104_69814 | Human | Colorectum | MSS | 7.60e-03 | 2.47e-01 | 0.281 |
| 1534 | CYB561 | HTA11_99999971662_82457 | Human | Colorectum | MSS | 7.03e-15 | 5.42e-01 | 0.3859 |
| 1534 | CYB561 | HTA11_99999974143_84620 | Human | Colorectum | MSS | 1.81e-02 | 2.39e-01 | 0.3005 |
| 1534 | CYB561 | LZE4T | Human | Esophagus | ESCC | 1.13e-04 | 2.94e-01 | 0.0811 |
| 1534 | CYB561 | LZE7T | Human | Esophagus | ESCC | 2.78e-02 | 1.87e-01 | 0.0667 |
| 1534 | CYB561 | LZE8T | Human | Esophagus | ESCC | 6.88e-13 | 2.96e-01 | 0.067 |
| Page: 1 2 3 4 5 6 |
| Tissue | Expression Dynamics | Abbreviation |
| Colorectum (GSE201348) | 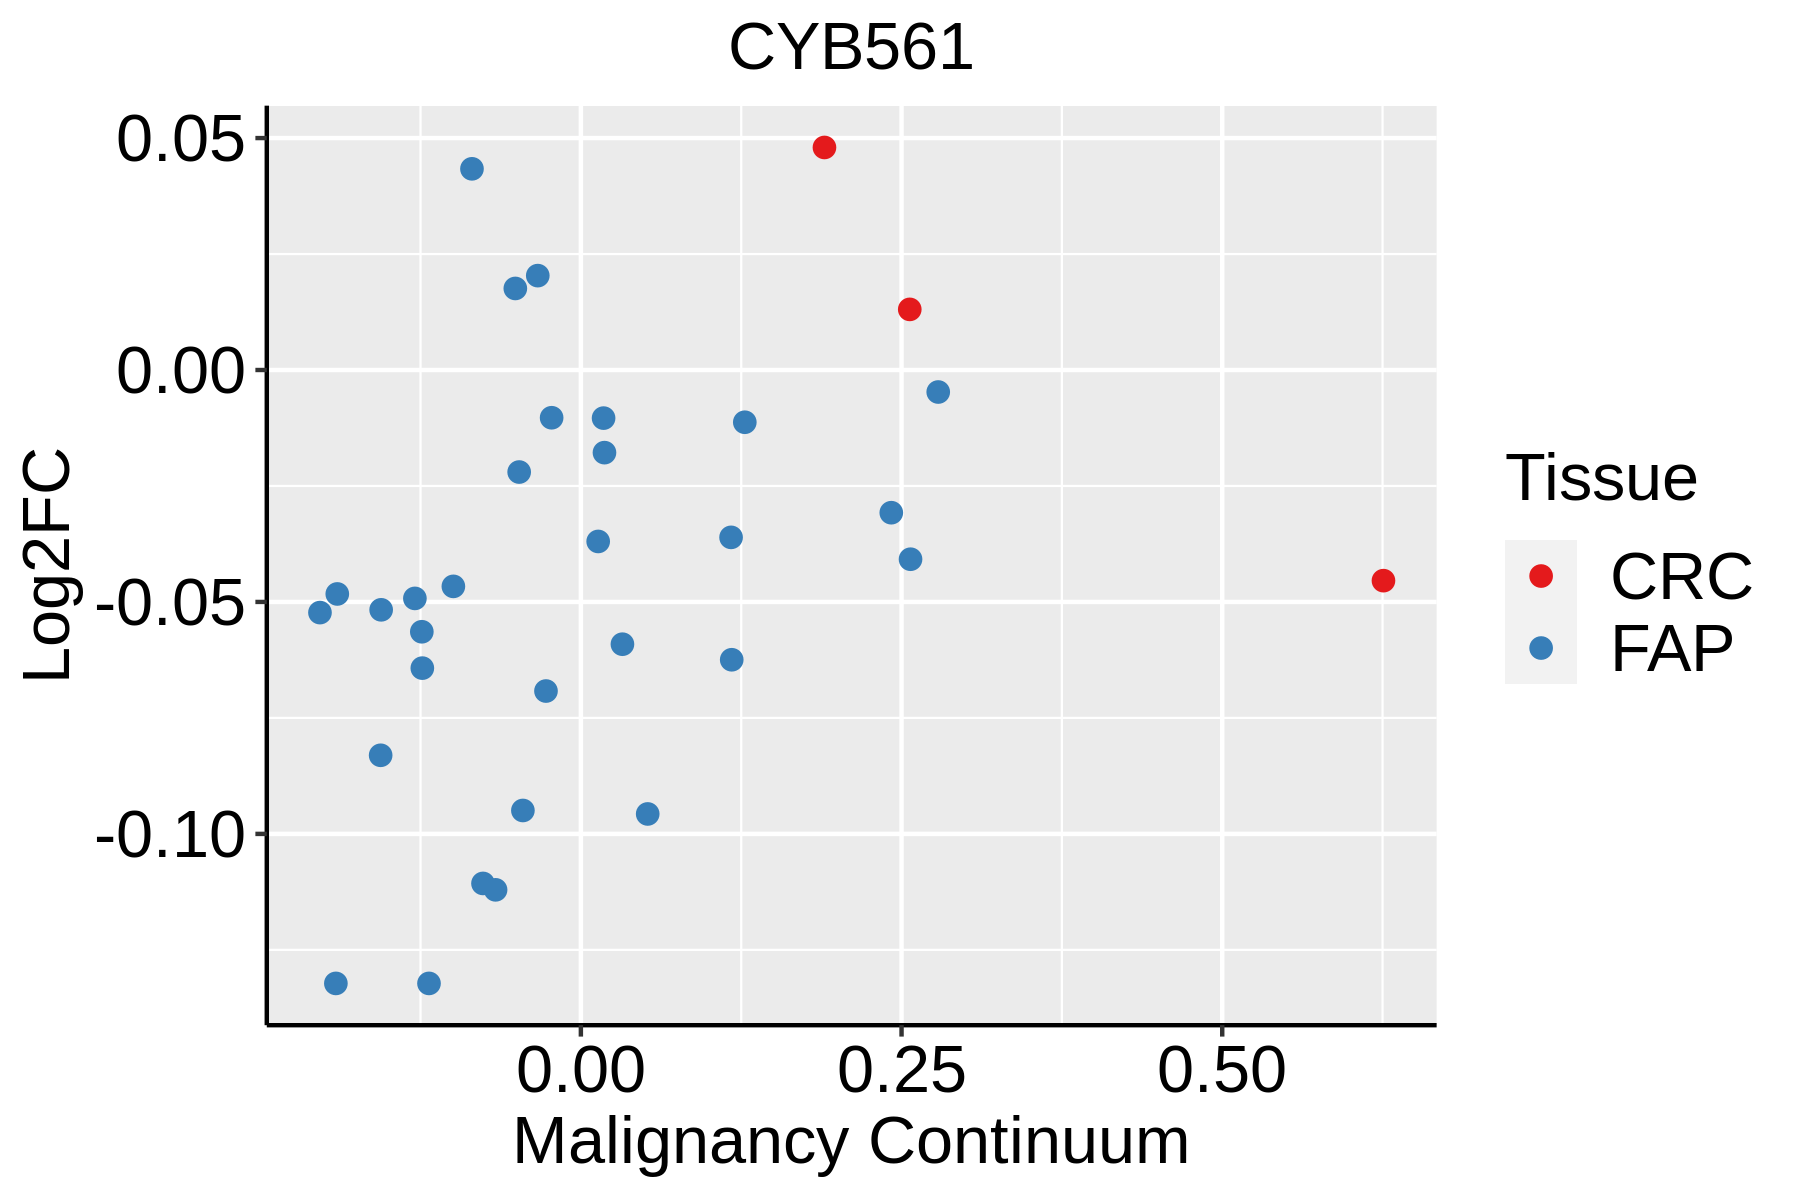 | FAP: Familial adenomatous polyposis |
| CRC: Colorectal cancer | ||
| Colorectum (HTA11) |  | AD: Adenomas |
| SER: Sessile serrated lesions | ||
| MSI-H: Microsatellite-high colorectal cancer | ||
| MSS: Microsatellite stable colorectal cancer | ||
| Esophagus | 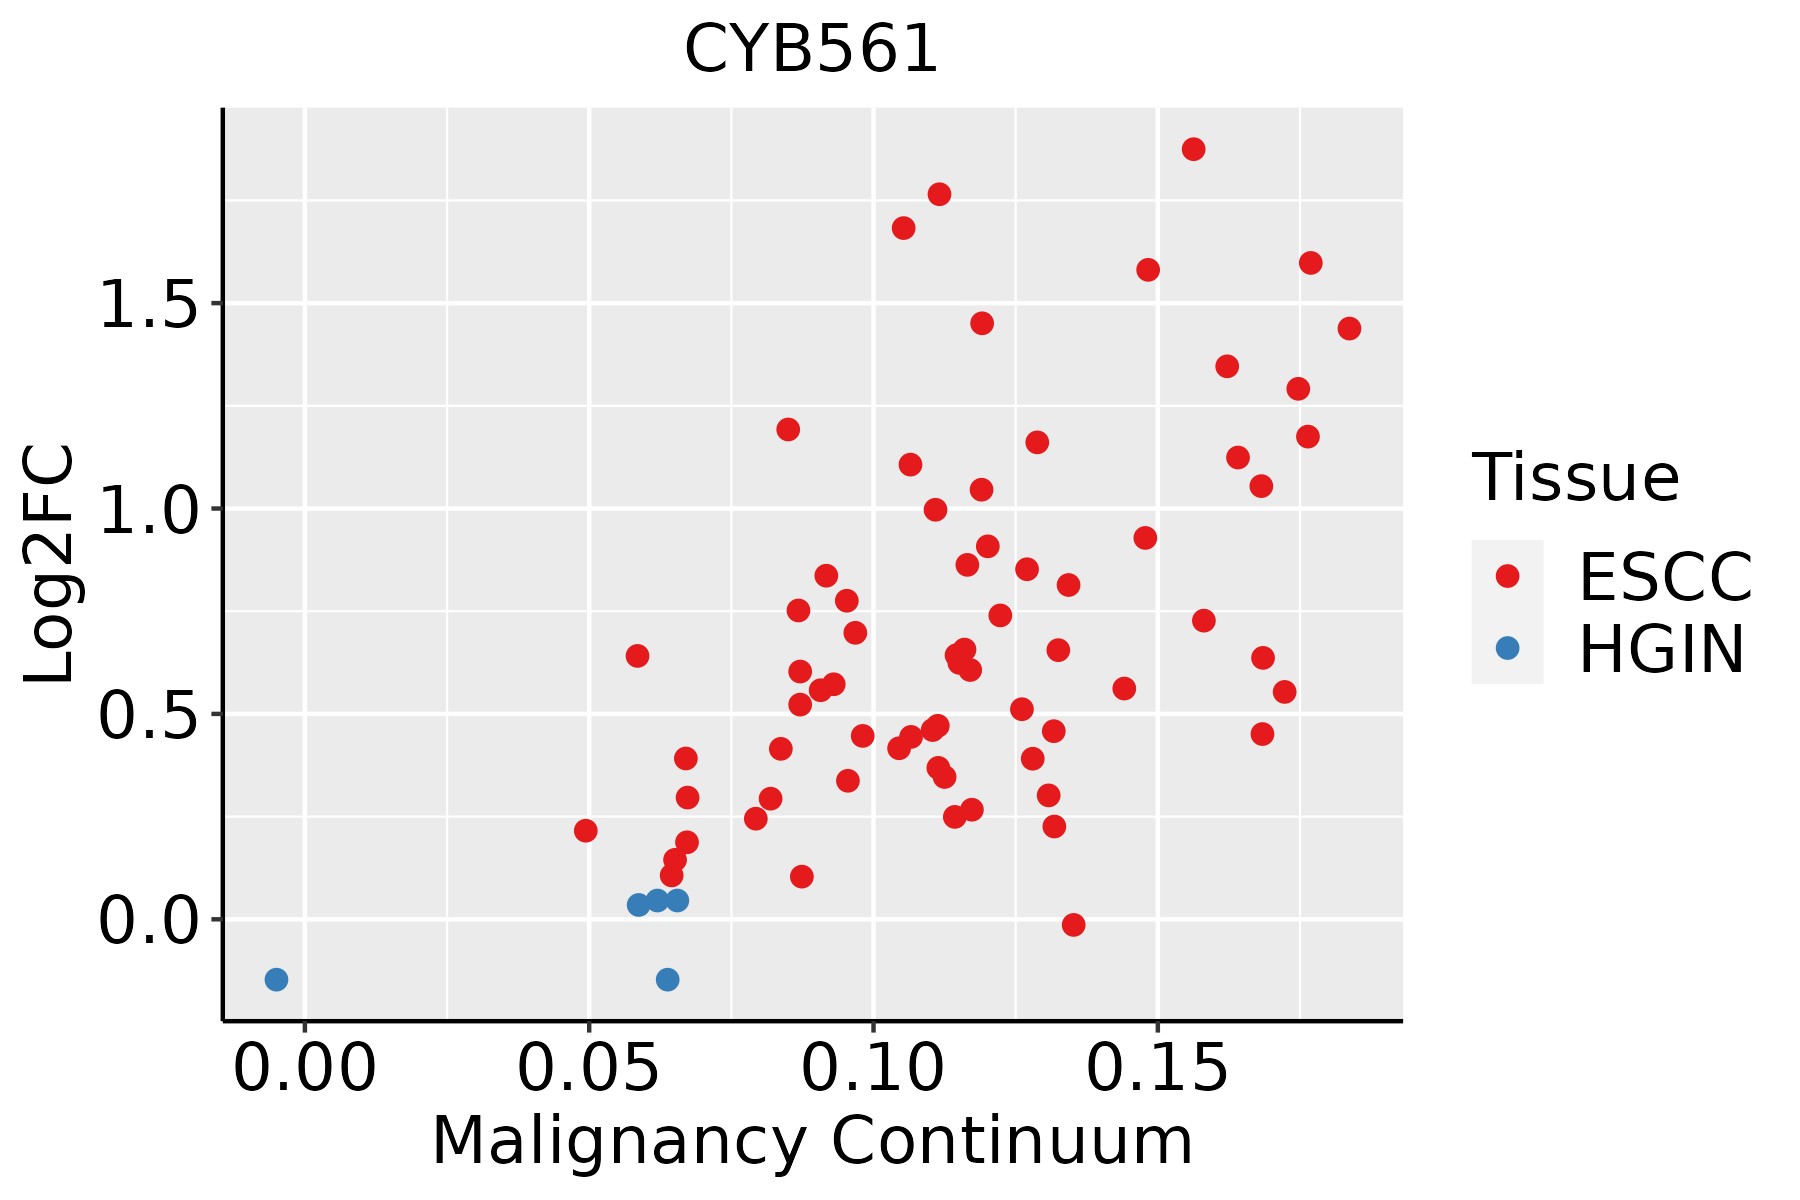 | ESCC: Esophageal squamous cell carcinoma |
| HGIN: High-grade intraepithelial neoplasias | ||
| LGIN: Low-grade intraepithelial neoplasias | ||
| Liver | 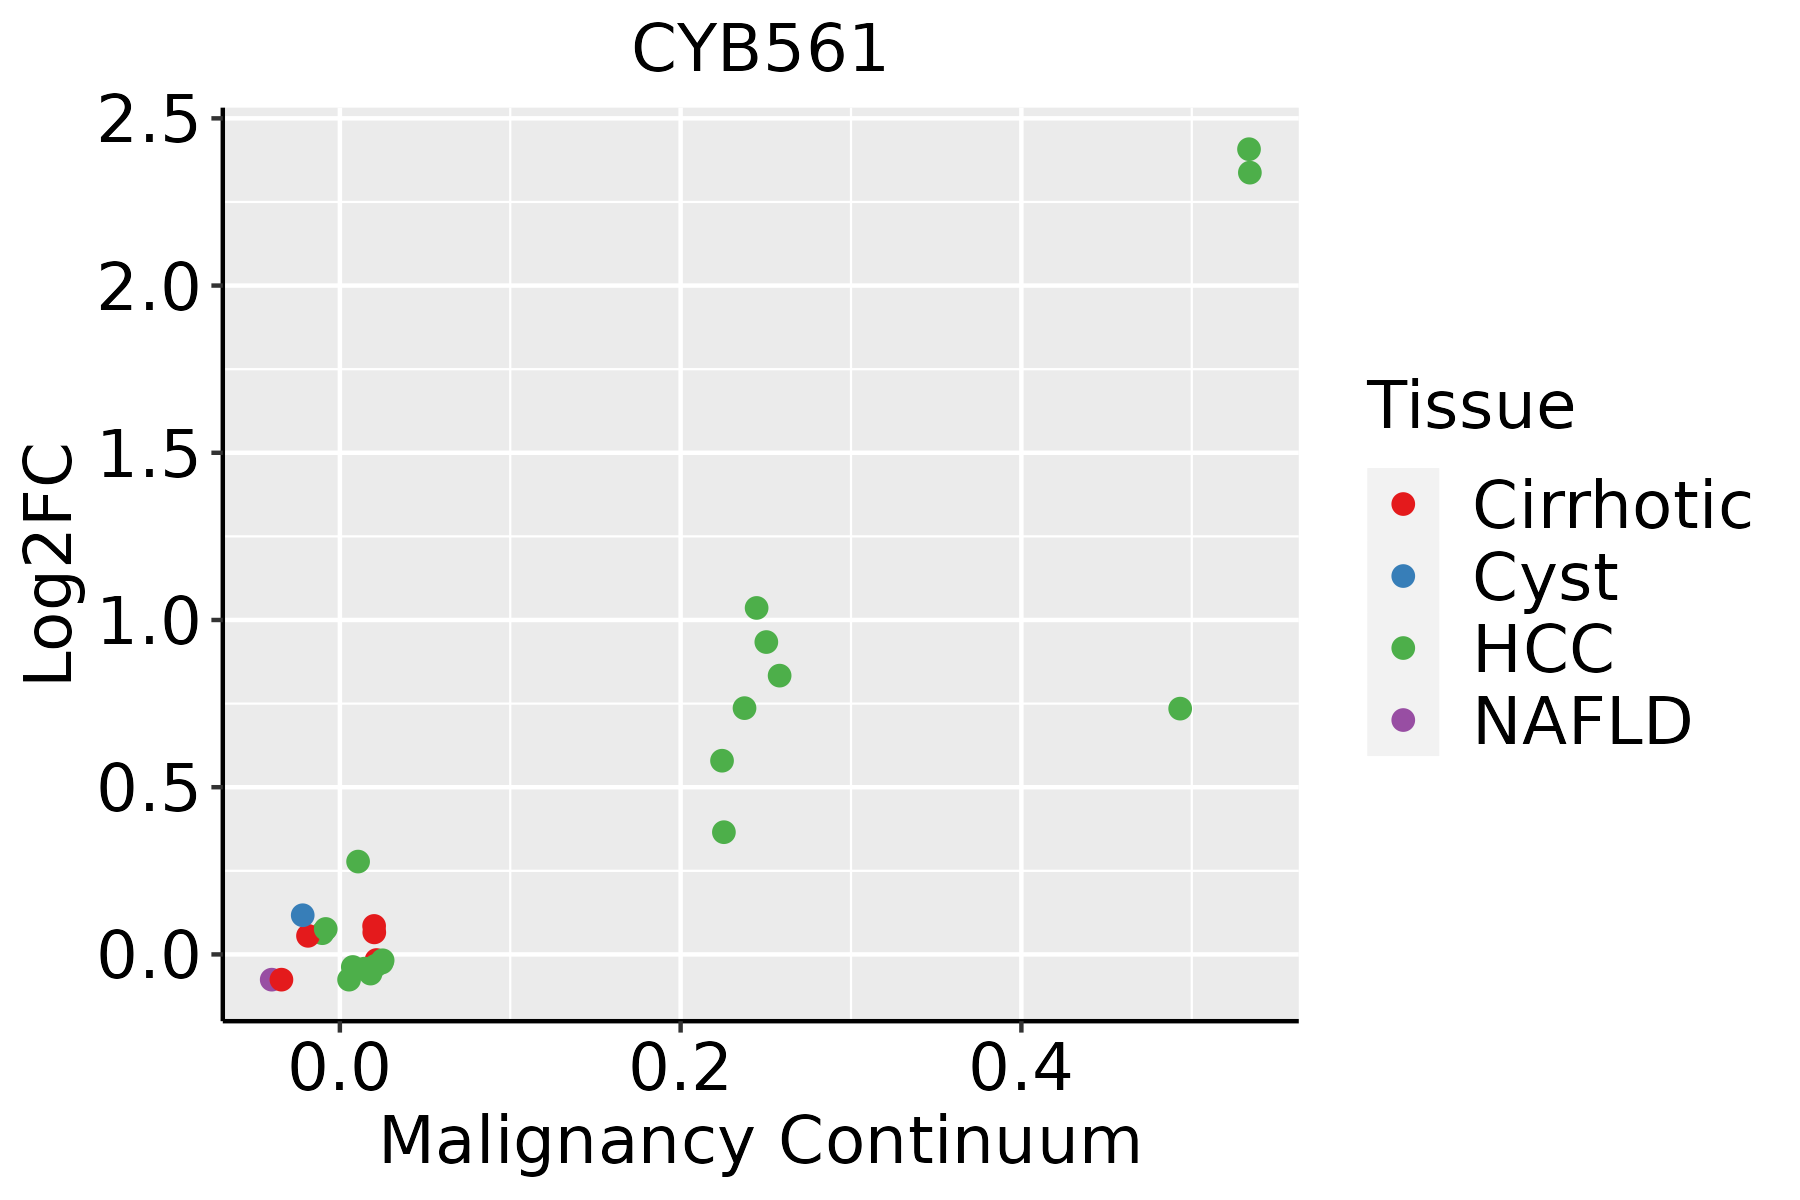 | HCC: Hepatocellular carcinoma |
| NAFLD: Non-alcoholic fatty liver disease | ||
| Oral Cavity |  | EOLP: Erosive Oral lichen planus |
| LP: leukoplakia | ||
| NEOLP: Non-erosive oral lichen planus | ||
| OSCC: Oral squamous cell carcinoma | ||
| Prostate |  | BPH: Benign Prostatic Hyperplasia |
| Skin | 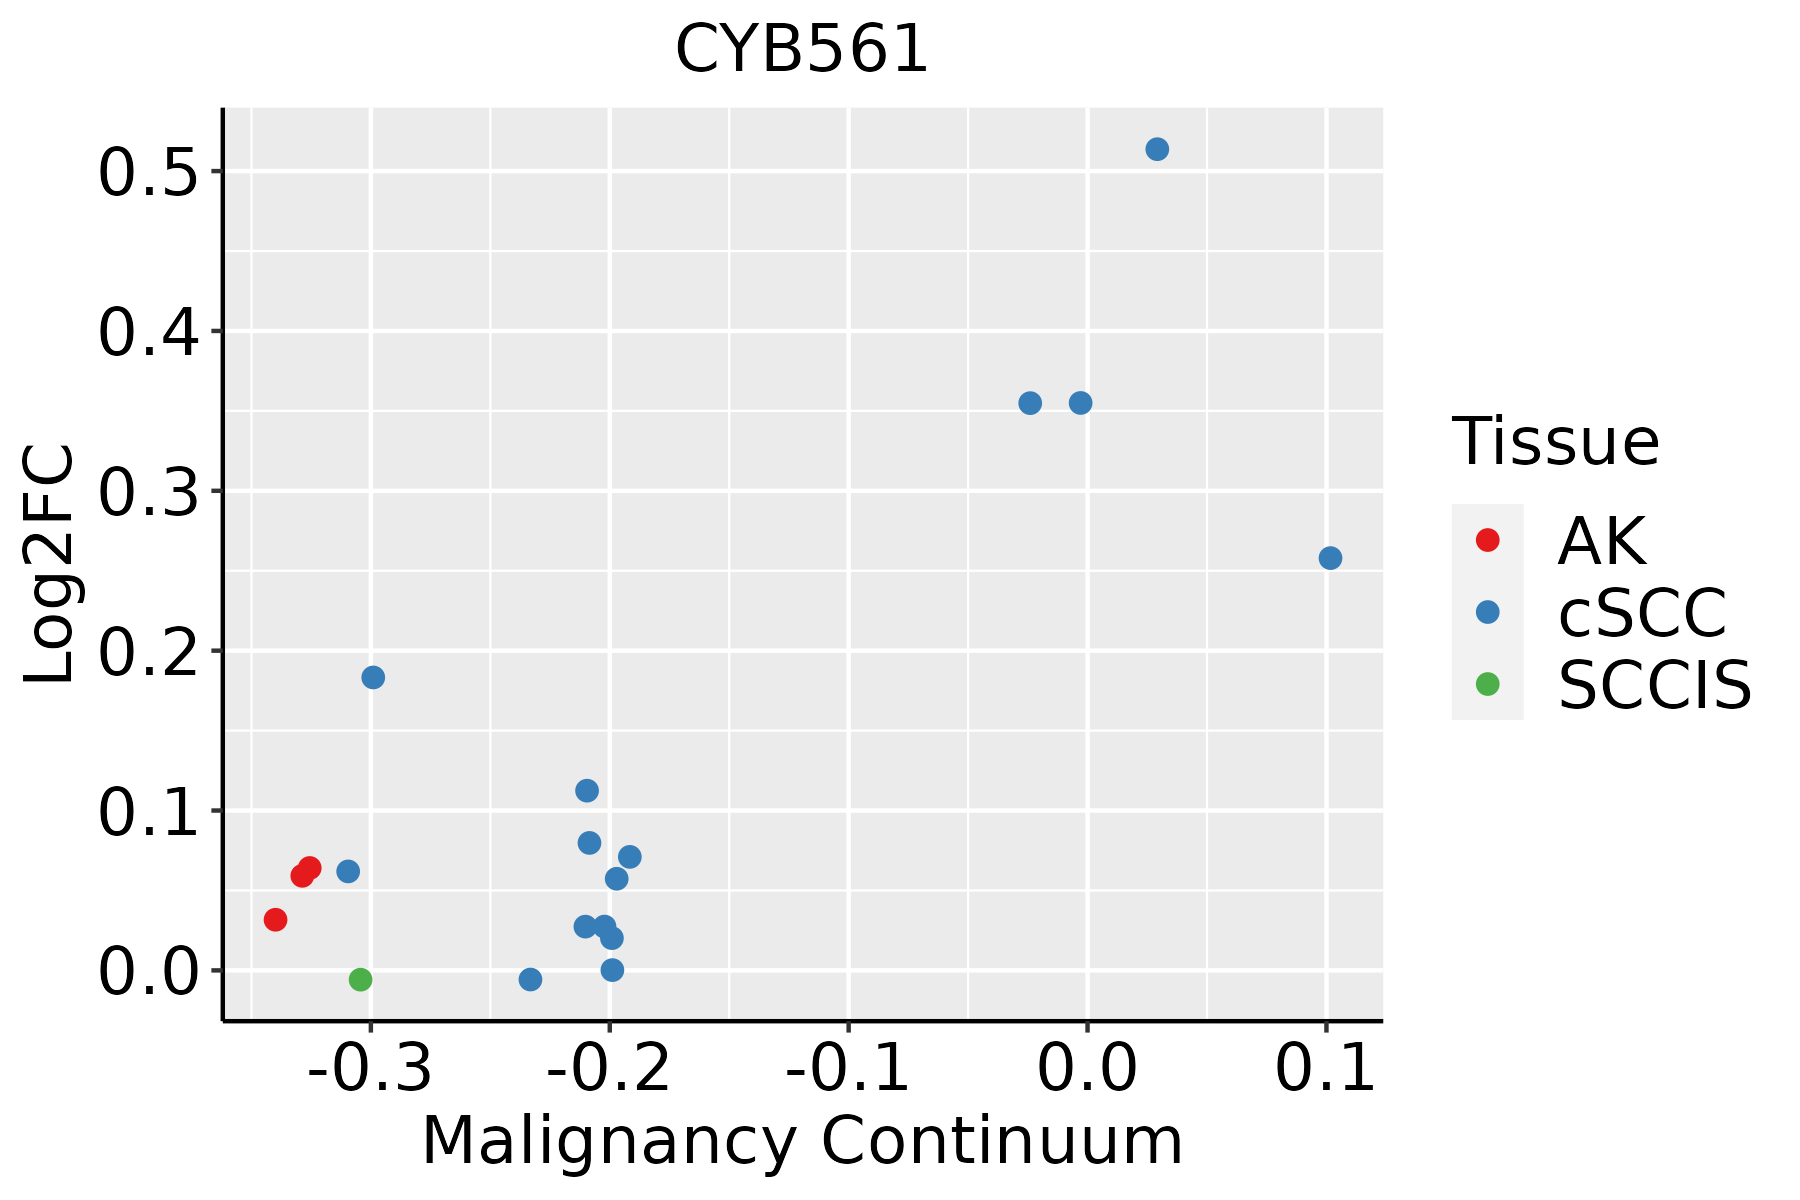 | AK: Actinic keratosis |
| cSCC: Cutaneous squamous cell carcinoma | ||
| SCCIS:squamous cell carcinoma in situ |
| ∗log2FC in expression of this searched gene in stem-like cells from each diseased tissue sample relative to stem-like cells in normal samples in each tissue plotted against the malignancy continuum. Samples are colored based on if they are from different disease stage. |
Top |
Malignant transformation related pathway analysis |
| Find out the enriched GO biological processes and KEGG pathways involved in transition from healthy to precancer to cancer |
| Tissue | Disease Stage | Enriched GO biological Processes |
| Colorectum | AD |  |
| Colorectum | SER |  |
| Colorectum | MSS |  |
| Colorectum | MSI-H |  |
| Colorectum | FAP |  |
| ∗Top 15 enriched GO BP terms are showed in the bar plot of each disease state in each tissue. Each row represents a significant GO biological process which is colored according to the -log10(p.adjust). |
| Page: 1 2 3 4 5 6 7 8 9 |
| GO ID | Tissue | Disease Stage | Description | Gene Ratio | Bg Ratio | pvalue | p.adjust | Count |
| GO:0006091 | Colorectum | AD | generation of precursor metabolites and energy | 209/3918 | 490/18723 | 3.17e-28 | 6.61e-25 | 209 |
| GO:0022900 | Colorectum | AD | electron transport chain | 89/3918 | 175/18723 | 1.42e-18 | 8.91e-16 | 89 |
| GO:0055076 | Colorectum | AD | transition metal ion homeostasis | 53/3918 | 138/18723 | 1.89e-06 | 5.65e-05 | 53 |
| GO:0046916 | Colorectum | AD | cellular transition metal ion homeostasis | 43/3918 | 115/18723 | 3.62e-05 | 6.56e-04 | 43 |
| GO:0055072 | Colorectum | AD | iron ion homeostasis | 32/3918 | 85/18723 | 2.97e-04 | 3.60e-03 | 32 |
| GO:0006879 | Colorectum | AD | cellular iron ion homeostasis | 25/3918 | 67/18723 | 1.51e-03 | 1.27e-02 | 25 |
| GO:00060911 | Colorectum | SER | generation of precursor metabolites and energy | 168/2897 | 490/18723 | 1.39e-25 | 1.70e-22 | 168 |
| GO:00229001 | Colorectum | SER | electron transport chain | 77/2897 | 175/18723 | 1.77e-19 | 1.36e-16 | 77 |
| GO:00550761 | Colorectum | SER | transition metal ion homeostasis | 41/2897 | 138/18723 | 1.66e-05 | 5.05e-04 | 41 |
| GO:00469161 | Colorectum | SER | cellular transition metal ion homeostasis | 33/2897 | 115/18723 | 2.20e-04 | 3.89e-03 | 33 |
| GO:00550721 | Colorectum | SER | iron ion homeostasis | 24/2897 | 85/18723 | 1.91e-03 | 1.93e-02 | 24 |
| GO:00060912 | Colorectum | MSS | generation of precursor metabolites and energy | 186/3467 | 490/18723 | 1.14e-24 | 2.15e-21 | 186 |
| GO:00229002 | Colorectum | MSS | electron transport chain | 83/3467 | 175/18723 | 2.06e-18 | 1.17e-15 | 83 |
| GO:00550762 | Colorectum | MSS | transition metal ion homeostasis | 45/3467 | 138/18723 | 4.99e-05 | 9.02e-04 | 45 |
| GO:00550722 | Colorectum | MSS | iron ion homeostasis | 29/3467 | 85/18723 | 4.44e-04 | 5.32e-03 | 29 |
| GO:00469162 | Colorectum | MSS | cellular transition metal ion homeostasis | 35/3467 | 115/18723 | 1.33e-03 | 1.26e-02 | 35 |
| GO:00068791 | Colorectum | MSS | cellular iron ion homeostasis | 22/3467 | 67/18723 | 3.57e-03 | 2.64e-02 | 22 |
| GO:00229003 | Colorectum | MSI-H | electron transport chain | 52/1319 | 175/18723 | 1.13e-19 | 5.21e-17 | 52 |
| GO:00060913 | Colorectum | MSI-H | generation of precursor metabolites and energy | 93/1319 | 490/18723 | 7.35e-19 | 3.14e-16 | 93 |
| GO:00550763 | Colorectum | MSI-H | transition metal ion homeostasis | 20/1319 | 138/18723 | 1.62e-03 | 2.40e-02 | 20 |
| Page: 1 2 3 4 |
| Pathway ID | Tissue | Disease Stage | Description | Gene Ratio | Bg Ratio | pvalue | p.adjust | qvalue | Count |
| Page: 1 |
Top |
Cell-cell communication analysis |
| Identification of potential cell-cell interactions between two cell types and their ligand-receptor pairs for different disease states |
| Ligand | Receptor | LRpair | Pathway | Tissue | Disease Stage |
| Page: 1 |
Top |
Single-cell gene regulatory network inference analysis |
| Find out the significant the regulons (TFs) and the target genes of each regulon across cell types for different disease states |
| TF | Cell Type | Tissue | Disease Stage | Target Gene | RSS | Regulon Activity |
| ∗The dot plots of a searched regulon are shown for all cell subpopulations in each disease state of each tissue based on the regulon specific score inferred using pySCENIC and by calculating the average expression. |
| Page: 1 |
Top |
Somatic mutation of malignant transformation related genes |
| Annotation of somatic variants for genes involved in malignant transformation |
| Hugo Symbol | Variant Class | Variant Classification | dbSNP RS | HGVSc | HGVSp | HGVSp Short | SWISSPROT | BIOTYPE | SIFT | PolyPhen | Tumor Sample Barcode | Tissue | Histology | Sex | Age | Stage | Therapy Types | Drugs | Outcome |
| CYB561 | SNV | Missense_Mutation | c.649N>A | p.Cys217Ser | p.C217S | protein_coding | tolerated(0.34) | benign(0.001) | TCGA-C8-A1HJ-01 | Breast | breast invasive carcinoma | Female | <65 | I/II | Unknown | Unknown | SD | ||
| CYB561 | deletion | Frame_Shift_Del | novel | c.731delN | p.Met244ArgfsTer6 | p.M244Rfs*6 | protein_coding | TCGA-D8-A27V-01 | Breast | breast invasive carcinoma | Female | <65 | I/II | Hormone Therapy | tamoxiphen | SD | |||
| CYB561 | SNV | Missense_Mutation | novel | c.502N>G | p.Ile168Val | p.I168V | protein_coding | tolerated(1) | benign(0) | TCGA-JW-AAVH-01 | Cervix | cervical & endocervical cancer | Female | <65 | I/II | Unknown | Unknown | SD | |
| CYB561 | SNV | Missense_Mutation | novel | c.604N>C | p.Glu202Gln | p.E202Q | protein_coding | tolerated(0.58) | benign(0.014) | TCGA-ZJ-AAXI-01 | Cervix | cervical & endocervical cancer | Female | >=65 | I/II | Unknown | Unknown | SD | |
| CYB561 | SNV | Missense_Mutation | rs374915589 | c.662N>T | p.Ala221Val | p.A221V | protein_coding | tolerated(1) | benign(0) | TCGA-A6-5660-01 | Colorectum | colon adenocarcinoma | Male | >=65 | III/IV | Ancillary | leucovorin | SD | |
| CYB561 | SNV | Missense_Mutation | rs376683537 | c.484N>T | p.Arg162Cys | p.R162C | protein_coding | tolerated(0.18) | benign(0.021) | TCGA-AA-3492-01 | Colorectum | colon adenocarcinoma | Female | >=65 | I/II | Unknown | Unknown | SD | |
| CYB561 | SNV | Missense_Mutation | c.407N>A | p.Phe136Tyr | p.F136Y | protein_coding | deleterious(0.01) | benign(0.021) | TCGA-AZ-6608-01 | Colorectum | colon adenocarcinoma | Female | <65 | III/IV | Unknown | Unknown | SD | ||
| CYB561 | SNV | Missense_Mutation | c.364N>T | p.Ala122Ser | p.A122S | protein_coding | tolerated(0.13) | possibly_damaging(0.533) | TCGA-D5-6529-01 | Colorectum | colon adenocarcinoma | Male | >=65 | I/II | Chemotherapy | oxaliplatinum+ | SD | ||
| CYB561 | SNV | Missense_Mutation | c.175N>A | p.Ala59Thr | p.A59T | protein_coding | tolerated(0.26) | benign(0.041) | TCGA-A5-A0G1-01 | Endometrium | uterine corpus endometrioid carcinoma | Female | >=65 | I/II | Unknown | Unknown | SD | ||
| CYB561 | SNV | Missense_Mutation | novel | c.665N>C | p.Val222Ala | p.V222A | protein_coding | deleterious(0.01) | possibly_damaging(0.856) | TCGA-AX-A1C5-01 | Endometrium | uterine corpus endometrioid carcinoma | Female | <65 | III/IV | Unspecific | Carboplatin | SD |
| Page: 1 2 3 |
Top |
Related drugs of malignant transformation related genes |
| Identification of chemicals and drugs interact with genes involved in malignant transfromation |
| (DGIdb 4.0) |
| Entrez ID | Symbol | Category | Interaction Types | Drug Claim Name | Drug Name | PMIDs |
| Page: 1 |

Copyright 2023-Present -The University of Texas Health Science Center at Houston |