
|
|||||
|
 | |
| |
| |
| |
| |
| |
|
Gene: CXorf38 |
Gene summary for CXORF38 |
| Gene information | Species | Human | Gene symbol | CXorf38 | Gene ID | 159013 |
| Gene name | chromosome X open reading frame 38 | |
| Gene Alias | CXorf38 | |
| Cytomap | Xp11.4 | |
| Gene Type | protein-coding | GO ID | GO:0003674 | UniProtAcc | Q8TB03 |
Top |
Malignant transformation analysis |
| Identification of the aberrant gene expression in precancerous and cancerous lesions by comparing the gene expression of stem-like cells in diseased tissues with normal stem cells |
| Entrez ID | Symbol | Replicates | Species | Organ | Tissue | Adj P-value | Log2FC | Malignancy |
| 159013 | CXorf38 | LZE4T | Human | Esophagus | ESCC | 2.52e-03 | 1.57e-01 | 0.0811 |
| 159013 | CXorf38 | P2T-E | Human | Esophagus | ESCC | 4.65e-29 | 5.44e-01 | 0.1177 |
| 159013 | CXorf38 | P4T-E | Human | Esophagus | ESCC | 2.61e-14 | 3.44e-01 | 0.1323 |
| 159013 | CXorf38 | P5T-E | Human | Esophagus | ESCC | 1.73e-17 | 2.74e-01 | 0.1327 |
| 159013 | CXorf38 | P8T-E | Human | Esophagus | ESCC | 2.13e-18 | 3.73e-01 | 0.0889 |
| 159013 | CXorf38 | P10T-E | Human | Esophagus | ESCC | 6.65e-10 | 1.04e-01 | 0.116 |
| 159013 | CXorf38 | P11T-E | Human | Esophagus | ESCC | 3.35e-05 | 2.69e-01 | 0.1426 |
| 159013 | CXorf38 | P12T-E | Human | Esophagus | ESCC | 1.91e-06 | 1.18e-01 | 0.1122 |
| 159013 | CXorf38 | P15T-E | Human | Esophagus | ESCC | 2.84e-04 | 1.49e-01 | 0.1149 |
| 159013 | CXorf38 | P16T-E | Human | Esophagus | ESCC | 3.38e-20 | 3.25e-01 | 0.1153 |
| 159013 | CXorf38 | P20T-E | Human | Esophagus | ESCC | 2.90e-08 | 2.30e-01 | 0.1124 |
| 159013 | CXorf38 | P21T-E | Human | Esophagus | ESCC | 3.10e-15 | 1.91e-01 | 0.1617 |
| 159013 | CXorf38 | P23T-E | Human | Esophagus | ESCC | 2.84e-08 | 2.37e-01 | 0.108 |
| 159013 | CXorf38 | P24T-E | Human | Esophagus | ESCC | 2.68e-10 | 1.07e-01 | 0.1287 |
| 159013 | CXorf38 | P26T-E | Human | Esophagus | ESCC | 7.82e-13 | 3.70e-01 | 0.1276 |
| 159013 | CXorf38 | P27T-E | Human | Esophagus | ESCC | 2.87e-08 | 1.78e-01 | 0.1055 |
| 159013 | CXorf38 | P28T-E | Human | Esophagus | ESCC | 5.31e-12 | 2.63e-01 | 0.1149 |
| 159013 | CXorf38 | P30T-E | Human | Esophagus | ESCC | 1.16e-17 | 6.15e-01 | 0.137 |
| 159013 | CXorf38 | P31T-E | Human | Esophagus | ESCC | 4.31e-03 | 9.80e-02 | 0.1251 |
| 159013 | CXorf38 | P32T-E | Human | Esophagus | ESCC | 6.76e-07 | 1.63e-01 | 0.1666 |
| Page: 1 2 3 4 5 |
| Tissue | Expression Dynamics | Abbreviation |
| Esophagus |  | ESCC: Esophageal squamous cell carcinoma |
| HGIN: High-grade intraepithelial neoplasias | ||
| LGIN: Low-grade intraepithelial neoplasias | ||
| Liver |  | HCC: Hepatocellular carcinoma |
| NAFLD: Non-alcoholic fatty liver disease | ||
| Oral Cavity | 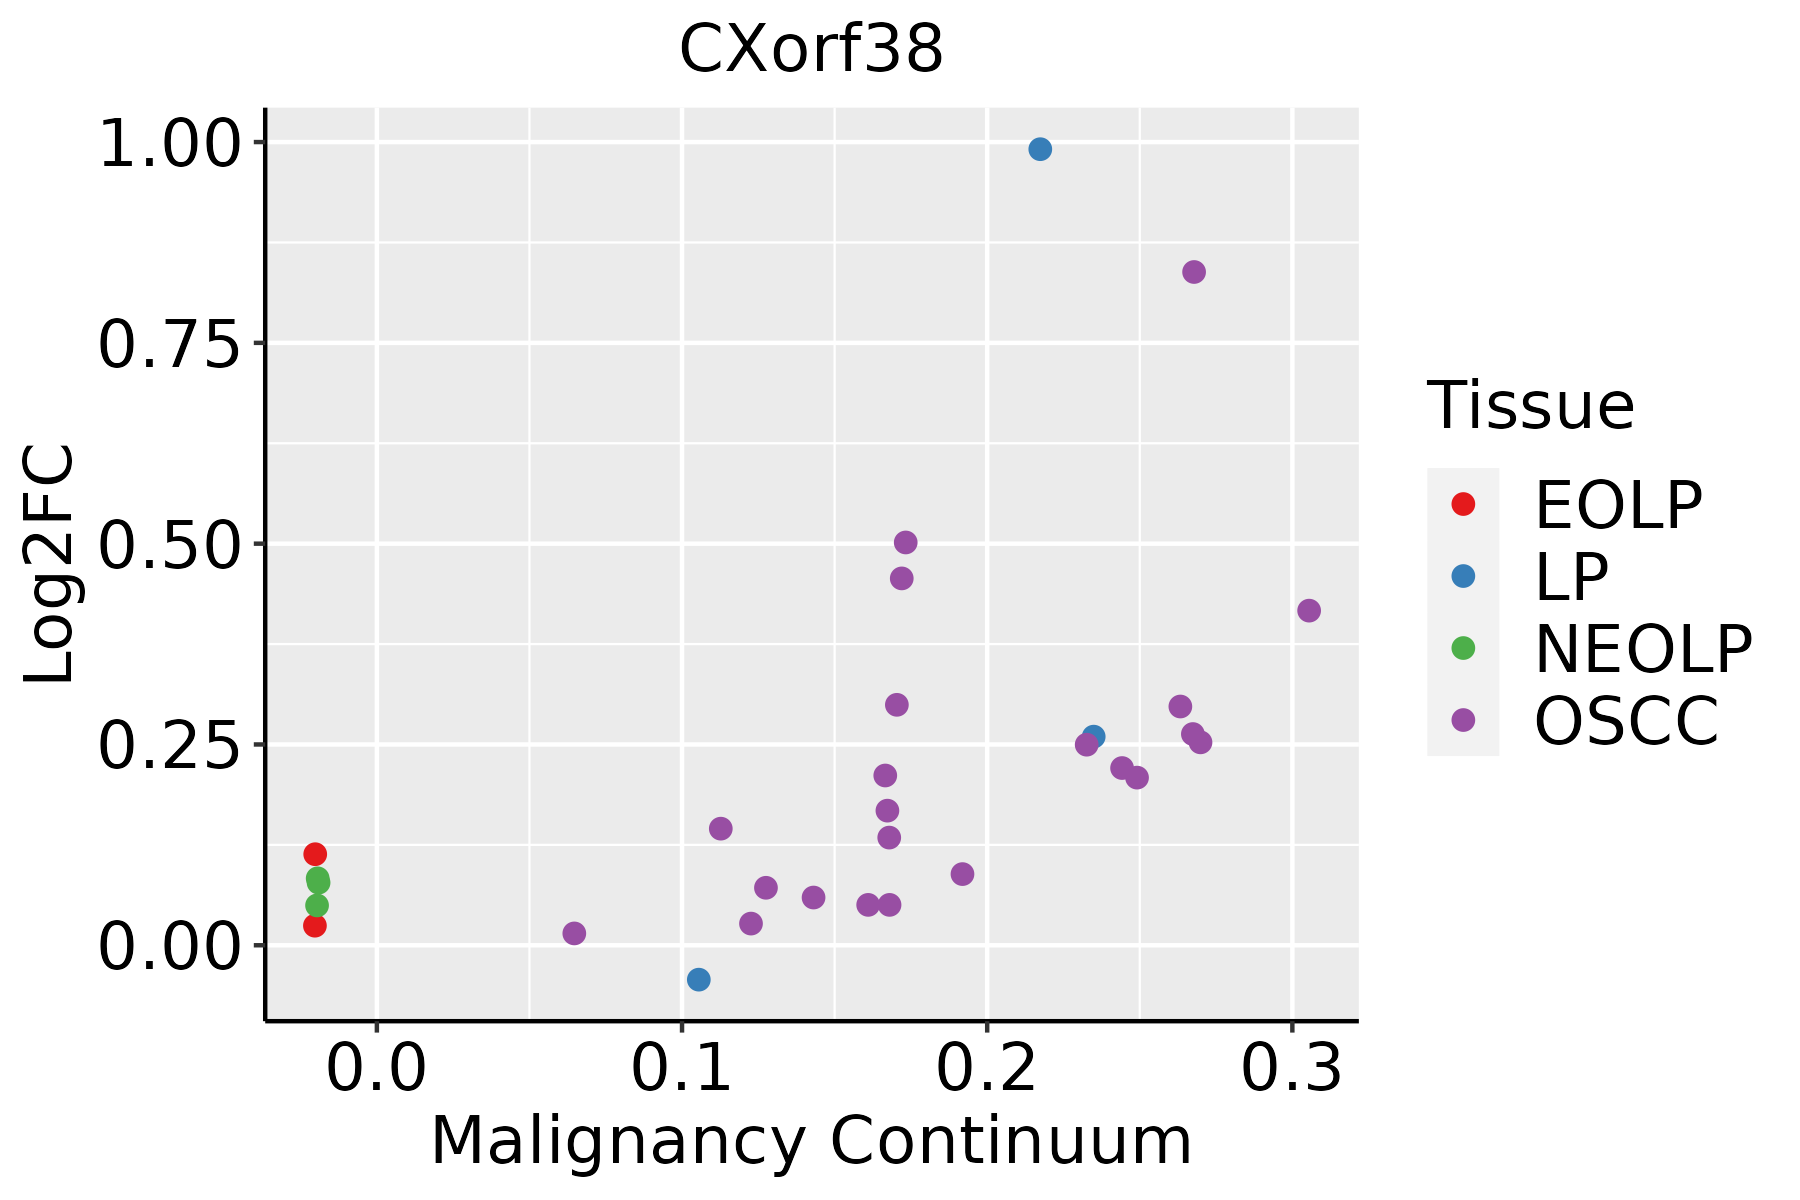 | EOLP: Erosive Oral lichen planus |
| LP: leukoplakia | ||
| NEOLP: Non-erosive oral lichen planus | ||
| OSCC: Oral squamous cell carcinoma | ||
| Thyroid | 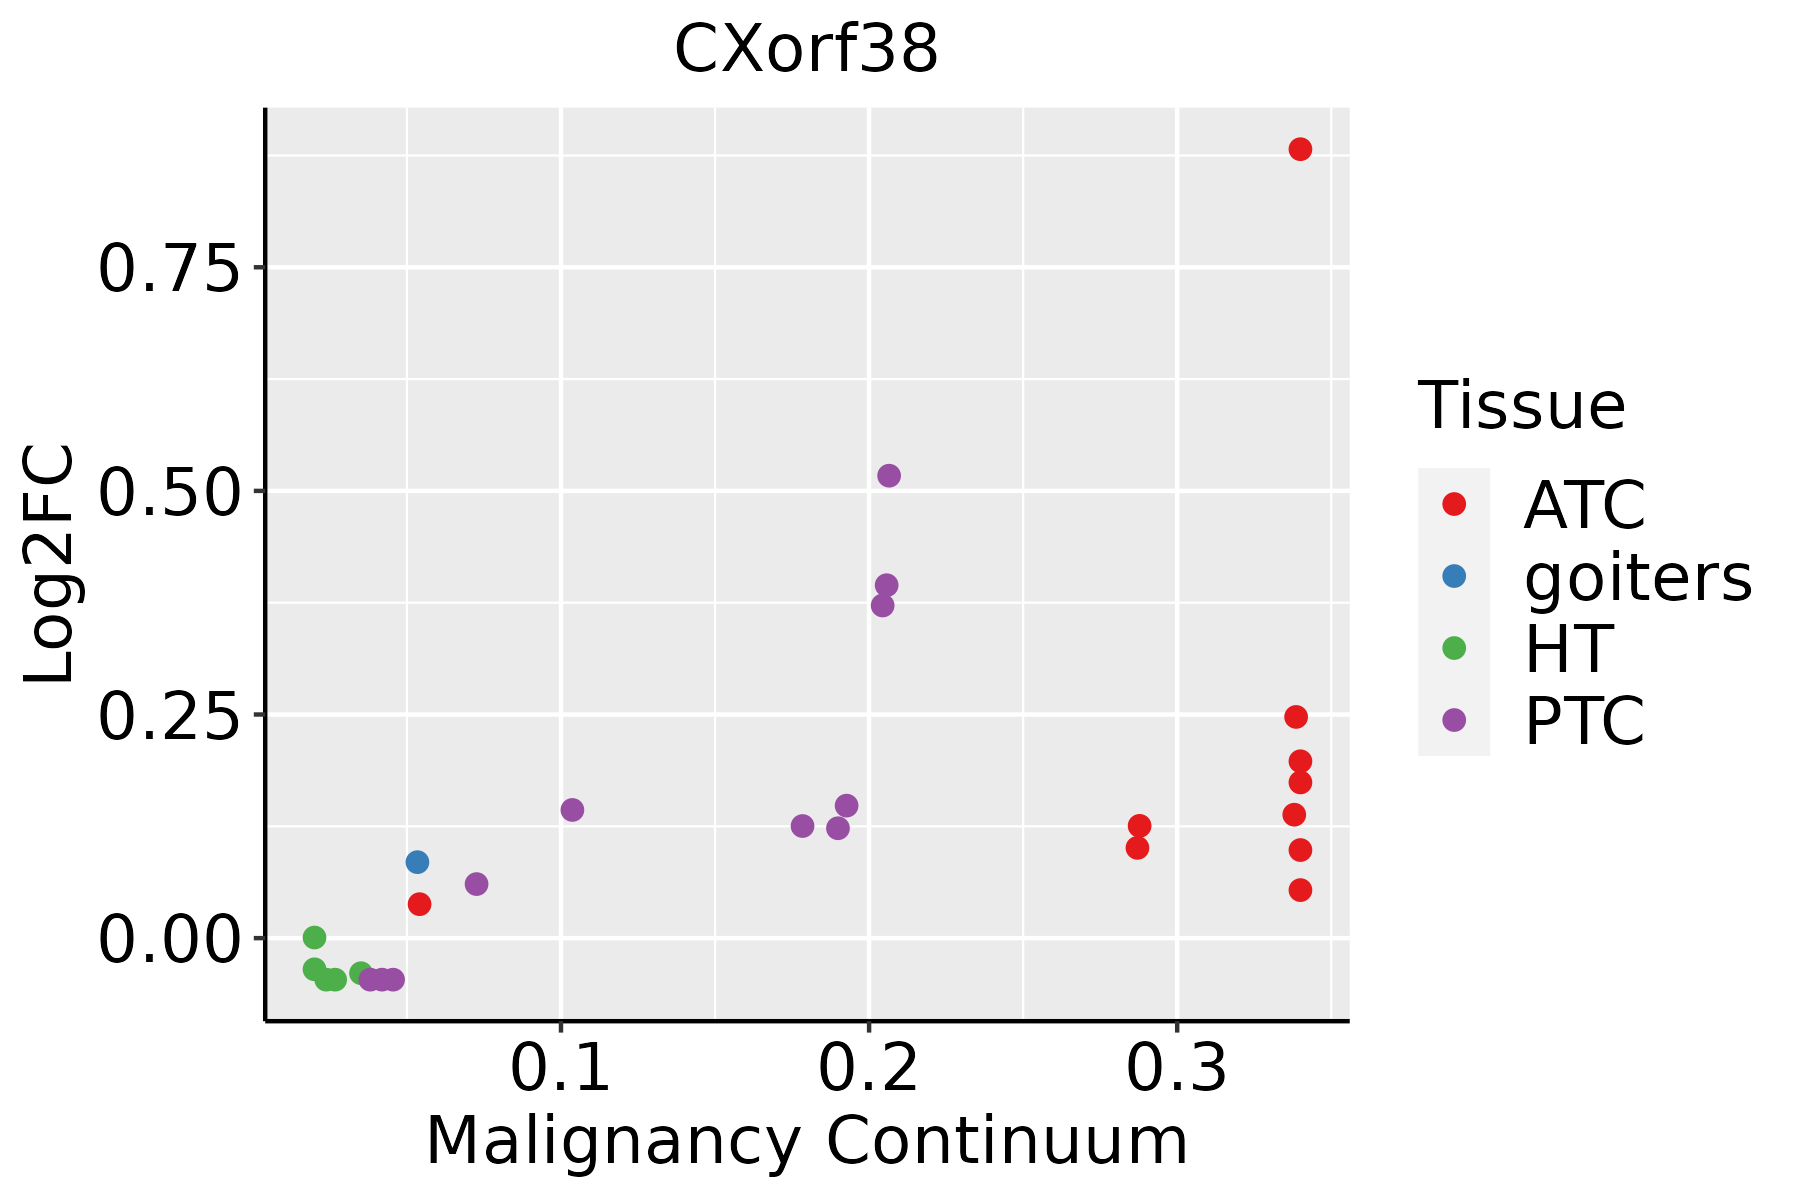 | ATC: Anaplastic thyroid cancer |
| HT: Hashimoto's thyroiditis | ||
| PTC: Papillary thyroid cancer |
| ∗log2FC in expression of this searched gene in stem-like cells from each diseased tissue sample relative to stem-like cells in normal samples in each tissue plotted against the malignancy continuum. Samples are colored based on if they are from different disease stage. |
Top |
Malignant transformation related pathway analysis |
| Find out the enriched GO biological processes and KEGG pathways involved in transition from healthy to precancer to cancer |
| Tissue | Disease Stage | Enriched GO biological Processes |
| Colorectum | AD |  |
| Colorectum | SER |  |
| Colorectum | MSS |  |
| Colorectum | MSI-H |  |
| Colorectum | FAP |  |
| ∗Top 15 enriched GO BP terms are showed in the bar plot of each disease state in each tissue. Each row represents a significant GO biological process which is colored according to the -log10(p.adjust). |
| Page: 1 2 3 4 5 6 7 8 9 |
| GO ID | Tissue | Disease Stage | Description | Gene Ratio | Bg Ratio | pvalue | p.adjust | Count |
| Page: 1 |
| Pathway ID | Tissue | Disease Stage | Description | Gene Ratio | Bg Ratio | pvalue | p.adjust | qvalue | Count |
| Page: 1 |
Top |
Cell-cell communication analysis |
| Identification of potential cell-cell interactions between two cell types and their ligand-receptor pairs for different disease states |
| Ligand | Receptor | LRpair | Pathway | Tissue | Disease Stage |
| Page: 1 |
Top |
Single-cell gene regulatory network inference analysis |
| Find out the significant the regulons (TFs) and the target genes of each regulon across cell types for different disease states |
| TF | Cell Type | Tissue | Disease Stage | Target Gene | RSS | Regulon Activity |
| ∗The dot plots of a searched regulon are shown for all cell subpopulations in each disease state of each tissue based on the regulon specific score inferred using pySCENIC and by calculating the average expression. |
| Page: 1 |
Top |
Somatic mutation of malignant transformation related genes |
| Annotation of somatic variants for genes involved in malignant transformation |
| Hugo Symbol | Variant Class | Variant Classification | dbSNP RS | HGVSc | HGVSp | HGVSp Short | SWISSPROT | BIOTYPE | SIFT | PolyPhen | Tumor Sample Barcode | Tissue | Histology | Sex | Age | Stage | Therapy Types | Drugs | Outcome |
| CXorf38 | SNV | Missense_Mutation | novel | c.524N>G | p.Ser175Cys | p.S175C | Q8TB03 | protein_coding | deleterious(0.01) | probably_damaging(0.998) | TCGA-3C-AALI-01 | Breast | breast invasive carcinoma | Female | <65 | I/II | Unspecific | Poly E | Complete Response |
| CXorf38 | SNV | Missense_Mutation | novel | c.319N>A | p.Arg107Ser | p.R107S | Q8TB03 | protein_coding | tolerated(0.2) | benign(0.084) | TCGA-LL-A5YO-01 | Breast | breast invasive carcinoma | Female | <65 | I/II | Chemotherapy | taxotere | CR |
| CXorf38 | SNV | Missense_Mutation | c.427N>T | p.Asn143Tyr | p.N143Y | Q8TB03 | protein_coding | deleterious(0) | probably_damaging(0.971) | TCGA-A6-2686-01 | Colorectum | colon adenocarcinoma | Female | >=65 | I/II | Unknown | Unknown | SD | |
| CXorf38 | SNV | Missense_Mutation | rs368399956 | c.747G>T | p.Glu249Asp | p.E249D | Q8TB03 | protein_coding | deleterious(0.01) | probably_damaging(0.996) | TCGA-AZ-4315-01 | Colorectum | colon adenocarcinoma | Male | <65 | I/II | Unknown | Unknown | SD |
| CXorf38 | SNV | Missense_Mutation | novel | c.258N>T | p.Glu86Asp | p.E86D | Q8TB03 | protein_coding | tolerated(0.06) | possibly_damaging(0.831) | TCGA-F5-6814-01 | Colorectum | rectum adenocarcinoma | Male | <65 | I/II | Unknown | Unknown | SD |
| CXorf38 | SNV | Missense_Mutation | novel | c.268C>A | p.His90Asn | p.H90N | Q8TB03 | protein_coding | deleterious(0.01) | benign(0.439) | TCGA-A5-A1OJ-01 | Endometrium | uterine corpus endometrioid carcinoma | Female | <65 | I/II | Unknown | Unknown | SD |
| CXorf38 | SNV | Missense_Mutation | c.521N>T | p.Ser174Phe | p.S174F | Q8TB03 | protein_coding | deleterious(0) | probably_damaging(0.998) | TCGA-AP-A059-01 | Endometrium | uterine corpus endometrioid carcinoma | Female | >=65 | I/II | Unknown | Unknown | SD | |
| CXorf38 | SNV | Missense_Mutation | c.766N>A | p.Leu256Ile | p.L256I | Q8TB03 | protein_coding | tolerated(0.07) | probably_damaging(0.957) | TCGA-AP-A0LM-01 | Endometrium | uterine corpus endometrioid carcinoma | Female | <65 | III/IV | Chemotherapy | cisplatin | SD | |
| CXorf38 | SNV | Missense_Mutation | novel | c.443N>C | p.Phe148Ser | p.F148S | Q8TB03 | protein_coding | deleterious(0) | probably_damaging(0.997) | TCGA-AX-A06F-01 | Endometrium | uterine corpus endometrioid carcinoma | Female | <65 | III/IV | Chemotherapy | carboplatin | SD |
| CXorf38 | SNV | Missense_Mutation | c.281N>T | p.Arg94Ile | p.R94I | Q8TB03 | protein_coding | deleterious(0.01) | probably_damaging(0.974) | TCGA-AX-A0J0-01 | Endometrium | uterine corpus endometrioid carcinoma | Female | <65 | I/II | Unknown | Unknown | SD |
| Page: 1 2 3 |
Top |
Related drugs of malignant transformation related genes |
| Identification of chemicals and drugs interact with genes involved in malignant transfromation |
| (DGIdb 4.0) |
| Entrez ID | Symbol | Category | Interaction Types | Drug Claim Name | Drug Name | PMIDs |
| Page: 1 |

Copyright 2023-Present -The University of Texas Health Science Center at Houston |