
|
|||||
|
 | |
| |
| |
| |
| |
| |
|
Gene: CXXC5 |
Gene summary for CXXC5 |
| Gene information | Species | Human | Gene symbol | CXXC5 | Gene ID | 51523 |
| Gene name | CXXC finger protein 5 | |
| Gene Alias | CF5 | |
| Cytomap | 5q31.2 | |
| Gene Type | protein-coding | GO ID | GO:0000122 | UniProtAcc | Q7LFL8 |
Top |
Malignant transformation analysis |
| Identification of the aberrant gene expression in precancerous and cancerous lesions by comparing the gene expression of stem-like cells in diseased tissues with normal stem cells |
| Entrez ID | Symbol | Replicates | Species | Organ | Tissue | Adj P-value | Log2FC | Malignancy |
| 51523 | CXXC5 | GSM4909286 | Human | Breast | IDC | 9.82e-03 | -1.40e-01 | 0.1081 |
| 51523 | CXXC5 | GSM4909297 | Human | Breast | IDC | 7.39e-04 | 2.59e-01 | 0.1517 |
| 51523 | CXXC5 | GSM4909298 | Human | Breast | IDC | 1.96e-31 | 6.57e-01 | 0.1551 |
| 51523 | CXXC5 | GSM4909304 | Human | Breast | IDC | 2.93e-05 | 3.11e-01 | 0.1636 |
| 51523 | CXXC5 | GSM4909306 | Human | Breast | IDC | 7.22e-04 | 2.96e-01 | 0.1564 |
| 51523 | CXXC5 | GSM4909307 | Human | Breast | IDC | 2.88e-05 | 3.53e-01 | 0.1569 |
| 51523 | CXXC5 | GSM4909308 | Human | Breast | IDC | 6.00e-19 | 4.79e-01 | 0.158 |
| 51523 | CXXC5 | GSM4909311 | Human | Breast | IDC | 3.58e-04 | 9.40e-02 | 0.1534 |
| 51523 | CXXC5 | GSM4909313 | Human | Breast | IDC | 5.32e-03 | 2.51e-01 | 0.0391 |
| 51523 | CXXC5 | GSM4909317 | Human | Breast | IDC | 2.41e-52 | 9.89e-01 | 0.1355 |
| 51523 | CXXC5 | GSM4909318 | Human | Breast | IDC | 3.06e-17 | 1.03e+00 | 0.2031 |
| 51523 | CXXC5 | GSM4909319 | Human | Breast | IDC | 1.79e-12 | 2.27e-01 | 0.1563 |
| 51523 | CXXC5 | GSM4909321 | Human | Breast | IDC | 2.25e-18 | 6.17e-01 | 0.1559 |
| 51523 | CXXC5 | M1 | Human | Breast | IDC | 8.97e-08 | 3.93e-01 | 0.1577 |
| 51523 | CXXC5 | NCCBC2 | Human | Breast | DCIS | 2.05e-07 | 6.00e-01 | 0.1554 |
| 51523 | CXXC5 | P1 | Human | Breast | IDC | 8.55e-04 | 2.01e-01 | 0.1527 |
| 51523 | CXXC5 | P3 | Human | Breast | IDC | 1.43e-03 | 4.86e-01 | 0.1542 |
| 51523 | CXXC5 | DCIS2 | Human | Breast | DCIS | 2.15e-17 | 4.87e-02 | 0.0085 |
| 51523 | CXXC5 | HTA11_3410_2000001011 | Human | Colorectum | AD | 2.90e-07 | 2.30e-01 | 0.0155 |
| 51523 | CXXC5 | HTA11_2487_2000001011 | Human | Colorectum | SER | 2.13e-05 | 3.20e-01 | -0.1808 |
| Page: 1 2 3 4 5 6 |
| Tissue | Expression Dynamics | Abbreviation |
| Breast | 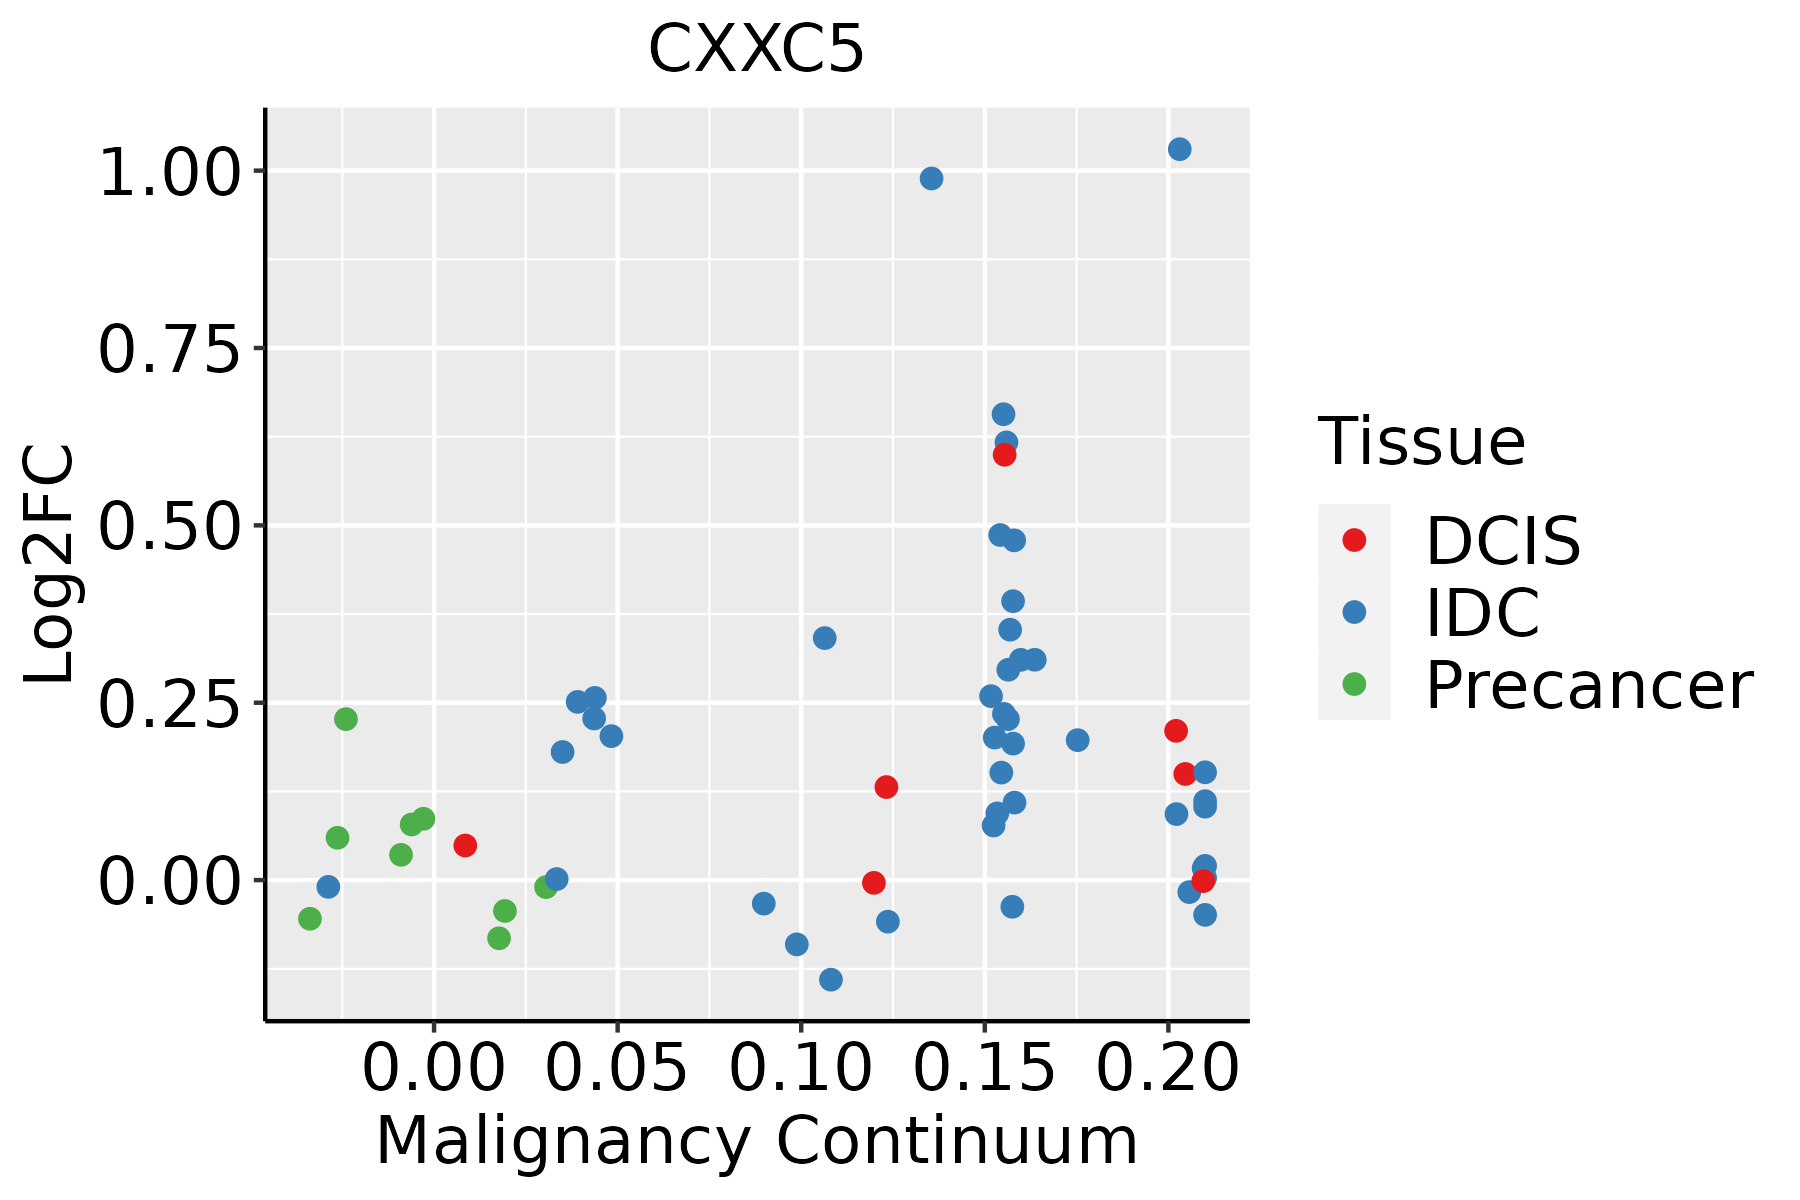 | IDC: Invasive ductal carcinoma |
| DCIS: Ductal carcinoma in situ | ||
| Precancer(BRCA1-mut): Precancerous lesion from BRCA1 mutation carriers | ||
| Colorectum (GSE201348) |  | FAP: Familial adenomatous polyposis |
| CRC: Colorectal cancer | ||
| Colorectum (HTA11) |  | AD: Adenomas |
| SER: Sessile serrated lesions | ||
| MSI-H: Microsatellite-high colorectal cancer | ||
| MSS: Microsatellite stable colorectal cancer | ||
| Esophagus | 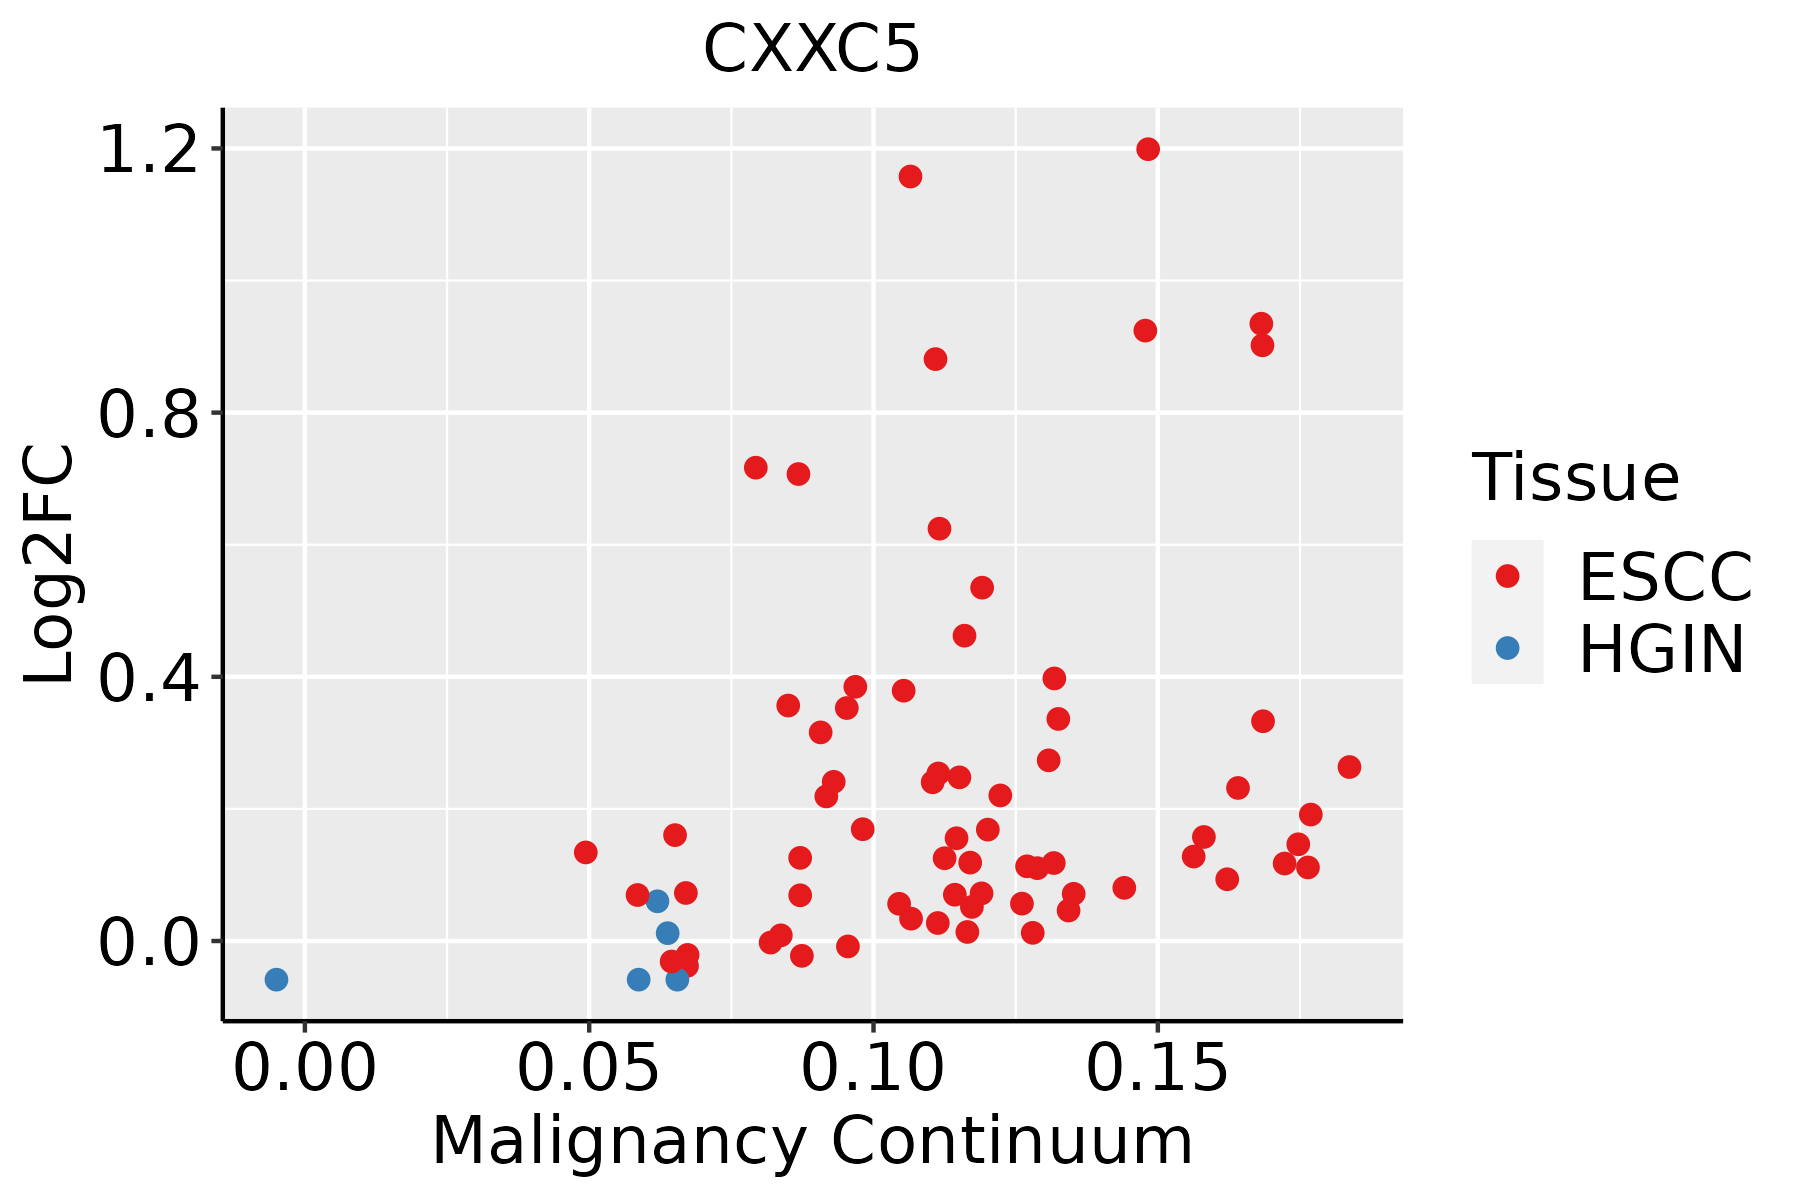 | ESCC: Esophageal squamous cell carcinoma |
| HGIN: High-grade intraepithelial neoplasias | ||
| LGIN: Low-grade intraepithelial neoplasias | ||
| Liver | 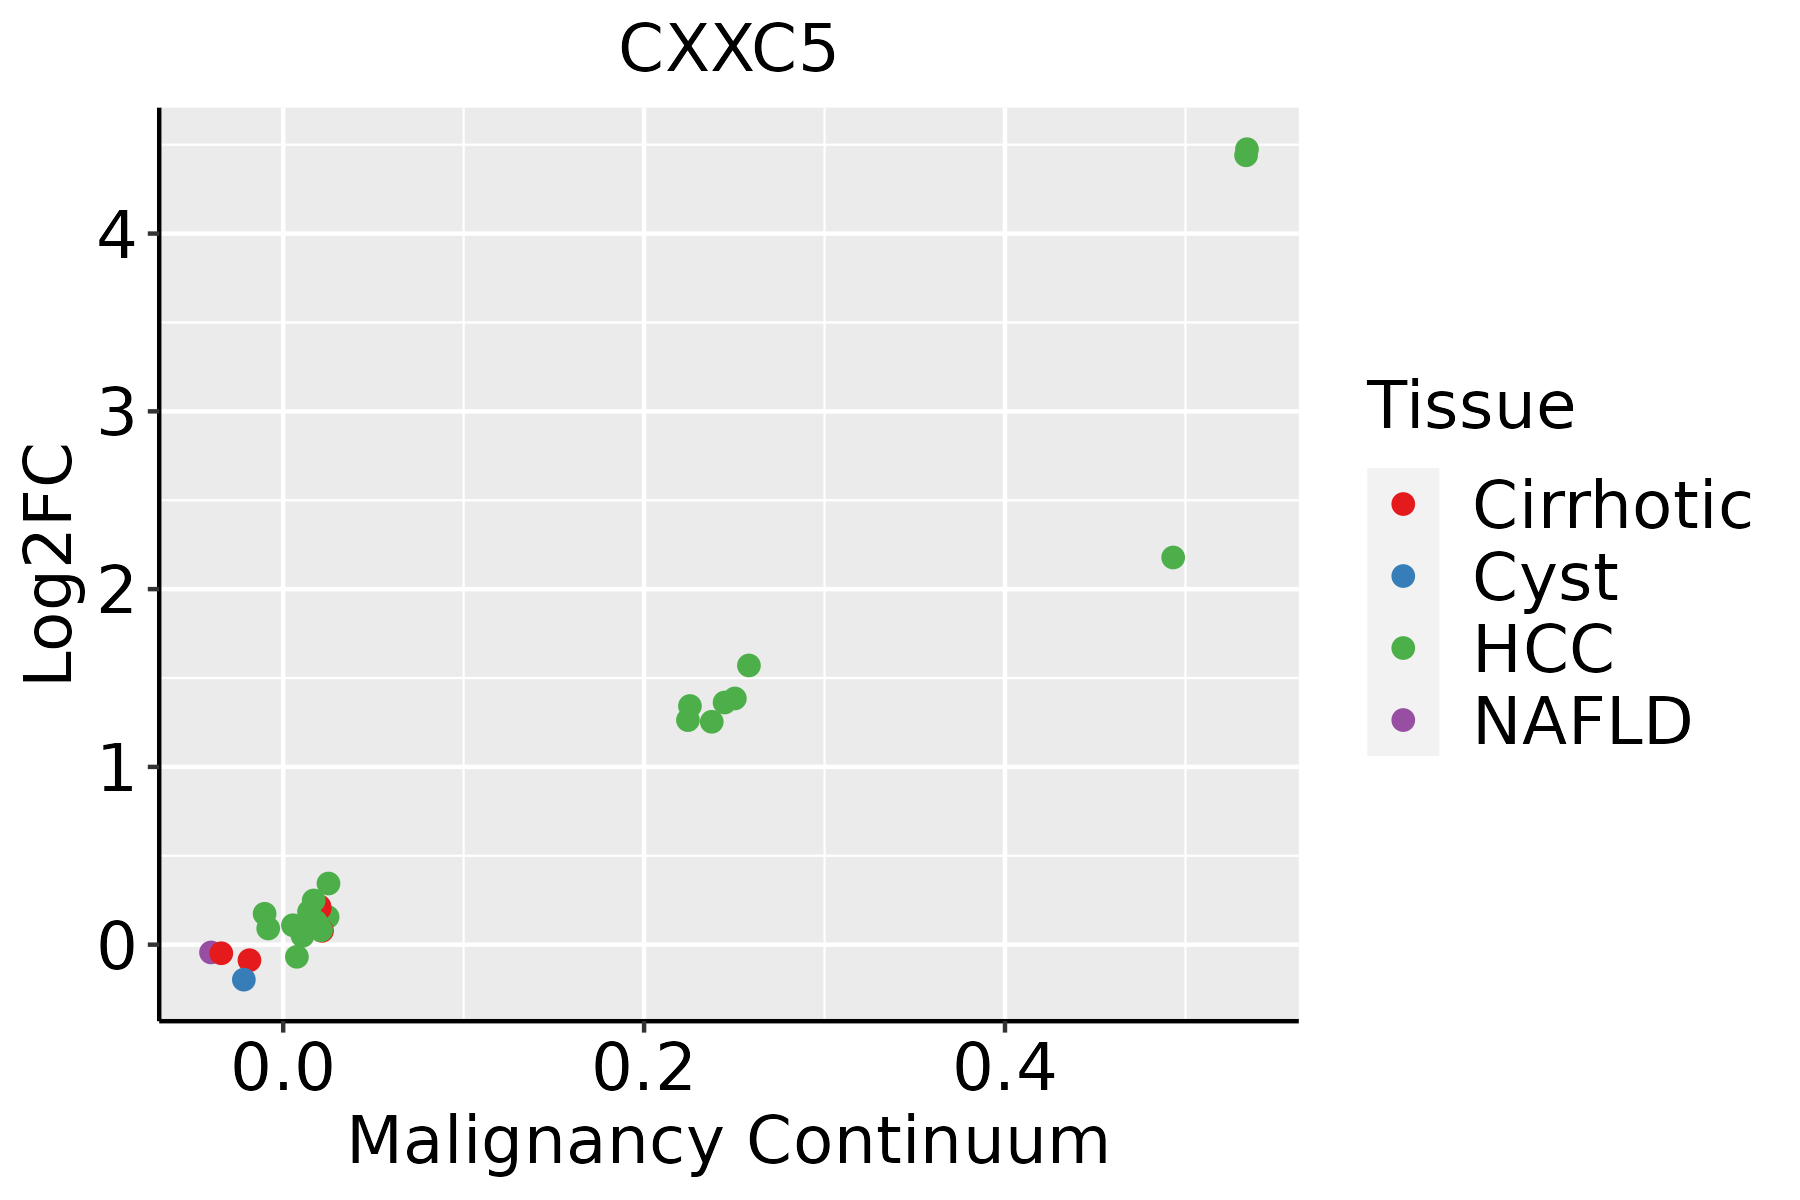 | HCC: Hepatocellular carcinoma |
| NAFLD: Non-alcoholic fatty liver disease | ||
| Oral Cavity |  | EOLP: Erosive Oral lichen planus |
| LP: leukoplakia | ||
| NEOLP: Non-erosive oral lichen planus | ||
| OSCC: Oral squamous cell carcinoma | ||
| Thyroid |  | ATC: Anaplastic thyroid cancer |
| HT: Hashimoto's thyroiditis | ||
| PTC: Papillary thyroid cancer |
| ∗log2FC in expression of this searched gene in stem-like cells from each diseased tissue sample relative to stem-like cells in normal samples in each tissue plotted against the malignancy continuum. Samples are colored based on if they are from different disease stage. |
Top |
Malignant transformation related pathway analysis |
| Find out the enriched GO biological processes and KEGG pathways involved in transition from healthy to precancer to cancer |
| Tissue | Disease Stage | Enriched GO biological Processes |
| Colorectum | AD |  |
| Colorectum | SER |  |
| Colorectum | MSS |  |
| Colorectum | MSI-H |  |
| Colorectum | FAP |  |
| ∗Top 15 enriched GO BP terms are showed in the bar plot of each disease state in each tissue. Each row represents a significant GO biological process which is colored according to the -log10(p.adjust). |
| Page: 1 2 3 4 5 6 7 8 9 |
| GO ID | Tissue | Disease Stage | Description | Gene Ratio | Bg Ratio | pvalue | p.adjust | Count |
| GO:00431227 | Breast | IDC | regulation of I-kappaB kinase/NF-kappaB signaling | 34/1434 | 249/18723 | 7.18e-04 | 8.77e-03 | 34 |
| GO:000724914 | Breast | IDC | I-kappaB kinase/NF-kappaB signaling | 37/1434 | 281/18723 | 8.58e-04 | 9.98e-03 | 37 |
| GO:00431236 | Breast | IDC | positive regulation of I-kappaB kinase/NF-kappaB signaling | 26/1434 | 186/18723 | 2.06e-03 | 1.95e-02 | 26 |
| GO:004312214 | Breast | DCIS | regulation of I-kappaB kinase/NF-kappaB signaling | 32/1390 | 249/18723 | 1.67e-03 | 1.66e-02 | 32 |
| GO:000724923 | Breast | DCIS | I-kappaB kinase/NF-kappaB signaling | 35/1390 | 281/18723 | 1.80e-03 | 1.74e-02 | 35 |
| GO:004312313 | Breast | DCIS | positive regulation of I-kappaB kinase/NF-kappaB signaling | 24/1390 | 186/18723 | 5.66e-03 | 4.09e-02 | 24 |
| GO:0043123 | Colorectum | AD | positive regulation of I-kappaB kinase/NF-kappaB signaling | 60/3918 | 186/18723 | 1.91e-04 | 2.56e-03 | 60 |
| GO:0043122 | Colorectum | AD | regulation of I-kappaB kinase/NF-kappaB signaling | 76/3918 | 249/18723 | 2.17e-04 | 2.85e-03 | 76 |
| GO:0007249 | Colorectum | AD | I-kappaB kinase/NF-kappaB signaling | 82/3918 | 281/18723 | 6.09e-04 | 6.40e-03 | 82 |
| GO:00431221 | Colorectum | MSS | regulation of I-kappaB kinase/NF-kappaB signaling | 71/3467 | 249/18723 | 7.12e-05 | 1.21e-03 | 71 |
| GO:00072491 | Colorectum | MSS | I-kappaB kinase/NF-kappaB signaling | 77/3467 | 281/18723 | 1.51e-04 | 2.19e-03 | 77 |
| GO:00431231 | Colorectum | MSS | positive regulation of I-kappaB kinase/NF-kappaB signaling | 55/3467 | 186/18723 | 1.60e-04 | 2.29e-03 | 55 |
| GO:004312318 | Esophagus | ESCC | positive regulation of I-kappaB kinase/NF-kappaB signaling | 132/8552 | 186/18723 | 2.07e-12 | 8.58e-11 | 132 |
| GO:0043122110 | Esophagus | ESCC | regulation of I-kappaB kinase/NF-kappaB signaling | 167/8552 | 249/18723 | 6.11e-12 | 2.32e-10 | 167 |
| GO:000724919 | Esophagus | ESCC | I-kappaB kinase/NF-kappaB signaling | 183/8552 | 281/18723 | 3.02e-11 | 1.01e-09 | 183 |
| GO:00072494 | Liver | Cirrhotic | I-kappaB kinase/NF-kappaB signaling | 108/4634 | 281/18723 | 2.21e-07 | 5.64e-06 | 108 |
| GO:00431225 | Liver | Cirrhotic | regulation of I-kappaB kinase/NF-kappaB signaling | 95/4634 | 249/18723 | 1.68e-06 | 3.22e-05 | 95 |
| GO:00431234 | Liver | Cirrhotic | positive regulation of I-kappaB kinase/NF-kappaB signaling | 71/4634 | 186/18723 | 3.20e-05 | 3.97e-04 | 71 |
| GO:000724912 | Liver | HCC | I-kappaB kinase/NF-kappaB signaling | 156/7958 | 281/18723 | 6.66e-06 | 8.00e-05 | 156 |
| GO:004312312 | Liver | HCC | positive regulation of I-kappaB kinase/NF-kappaB signaling | 108/7958 | 186/18723 | 1.28e-05 | 1.43e-04 | 108 |
| Page: 1 2 |
| Pathway ID | Tissue | Disease Stage | Description | Gene Ratio | Bg Ratio | pvalue | p.adjust | qvalue | Count |
| Page: 1 |
Top |
Cell-cell communication analysis |
| Identification of potential cell-cell interactions between two cell types and their ligand-receptor pairs for different disease states |
| Ligand | Receptor | LRpair | Pathway | Tissue | Disease Stage |
| Page: 1 |
Top |
Single-cell gene regulatory network inference analysis |
| Find out the significant the regulons (TFs) and the target genes of each regulon across cell types for different disease states |
| TF | Cell Type | Tissue | Disease Stage | Target Gene | RSS | Regulon Activity |
| ∗The dot plots of a searched regulon are shown for all cell subpopulations in each disease state of each tissue based on the regulon specific score inferred using pySCENIC and by calculating the average expression. |
| Page: 1 |
Top |
Somatic mutation of malignant transformation related genes |
| Annotation of somatic variants for genes involved in malignant transformation |
| Hugo Symbol | Variant Class | Variant Classification | dbSNP RS | HGVSc | HGVSp | HGVSp Short | SWISSPROT | BIOTYPE | SIFT | PolyPhen | Tumor Sample Barcode | Tissue | Histology | Sex | Age | Stage | Therapy Types | Drugs | Outcome |
| CXXC5 | SNV | Missense_Mutation | novel | c.466N>T | p.Ala156Ser | p.A156S | Q7LFL8 | protein_coding | tolerated(0.69) | benign(0.031) | TCGA-AC-A8OR-01 | Breast | breast invasive carcinoma | Female | >=65 | I/II | Unknown | Unknown | SD |
| CXXC5 | insertion | Frame_Shift_Ins | novel | c.614_615insACAGG | p.Ser206GlnfsTer20 | p.S206Qfs*20 | Q7LFL8 | protein_coding | TCGA-DS-A1OC-01 | Cervix | cervical & endocervical cancer | Female | <65 | I/II | Chemotherapy | gemcitabine | SD | ||
| CXXC5 | SNV | Missense_Mutation | c.223C>T | p.Arg75Cys | p.R75C | Q7LFL8 | protein_coding | deleterious(0) | possibly_damaging(0.642) | TCGA-AA-3673-01 | Colorectum | colon adenocarcinoma | Female | <65 | I/II | Unknown | Unknown | SD | |
| CXXC5 | SNV | Missense_Mutation | rs771147937 | c.482N>T | p.Thr161Met | p.T161M | Q7LFL8 | protein_coding | deleterious(0.04) | possibly_damaging(0.613) | TCGA-AZ-4313-01 | Colorectum | colon adenocarcinoma | Female | <65 | I/II | Unknown | Unknown | SD |
| CXXC5 | SNV | Missense_Mutation | c.885N>T | p.Lys295Asn | p.K295N | Q7LFL8 | protein_coding | deleterious(0) | probably_damaging(0.998) | TCGA-CM-6674-01 | Colorectum | colon adenocarcinoma | Male | <65 | I/II | Unknown | Unknown | SD | |
| CXXC5 | SNV | Missense_Mutation | novel | c.557C>T | p.Ala186Val | p.A186V | Q7LFL8 | protein_coding | tolerated(0.11) | benign(0.125) | TCGA-D5-6532-01 | Colorectum | colon adenocarcinoma | Male | <65 | I/II | Unknown | Unknown | SD |
| CXXC5 | SNV | Missense_Mutation | novel | c.814N>T | p.Arg272Cys | p.R272C | Q7LFL8 | protein_coding | deleterious(0) | probably_damaging(0.998) | TCGA-A5-A0G2-01 | Endometrium | uterine corpus endometrioid carcinoma | Female | <65 | III/IV | Unknown | Unknown | SD |
| CXXC5 | SNV | Missense_Mutation | rs373316102 | c.320N>T | p.Ala107Val | p.A107V | Q7LFL8 | protein_coding | tolerated(0.06) | benign(0) | TCGA-A5-A0GB-01 | Endometrium | uterine corpus endometrioid carcinoma | Female | >=65 | I/II | Unknown | Unknown | SD |
| CXXC5 | SNV | Missense_Mutation | rs766479360 | c.800C>T | p.Ala267Val | p.A267V | Q7LFL8 | protein_coding | tolerated(0.59) | benign(0.019) | TCGA-A5-A1OF-01 | Endometrium | uterine corpus endometrioid carcinoma | Female | <65 | I/II | Unknown | Unknown | SD |
| CXXC5 | SNV | Missense_Mutation | novel | c.927G>T | p.Lys309Asn | p.K309N | Q7LFL8 | protein_coding | tolerated(0.1) | probably_damaging(0.994) | TCGA-A5-A1OF-01 | Endometrium | uterine corpus endometrioid carcinoma | Female | <65 | I/II | Unknown | Unknown | SD |
| Page: 1 2 3 4 |
Top |
Related drugs of malignant transformation related genes |
| Identification of chemicals and drugs interact with genes involved in malignant transfromation |
| (DGIdb 4.0) |
| Entrez ID | Symbol | Category | Interaction Types | Drug Claim Name | Drug Name | PMIDs |
| Page: 1 |

Copyright 2023-Present -The University of Texas Health Science Center at Houston |