
|
|||||
|
 | |
| |
| |
| |
| |
| |
|
Gene: CXXC1 |
Gene summary for CXXC1 |
| Gene information | Species | Human | Gene symbol | CXXC1 | Gene ID | 30827 |
| Gene name | CXXC finger protein 1 | |
| Gene Alias | 2410002I16Rik | |
| Cytomap | 18q21.1 | |
| Gene Type | protein-coding | GO ID | GO:0006139 | UniProtAcc | Q9P0U4 |
Top |
Malignant transformation analysis |
| Identification of the aberrant gene expression in precancerous and cancerous lesions by comparing the gene expression of stem-like cells in diseased tissues with normal stem cells |
| Entrez ID | Symbol | Replicates | Species | Organ | Tissue | Adj P-value | Log2FC | Malignancy |
| 30827 | CXXC1 | HTA11_3410_2000001011 | Human | Colorectum | AD | 4.77e-07 | 1.83e-01 | 0.0155 |
| 30827 | CXXC1 | HTA11_2487_2000001011 | Human | Colorectum | SER | 3.05e-06 | 3.35e-01 | -0.1808 |
| 30827 | CXXC1 | HTA11_2951_2000001011 | Human | Colorectum | AD | 1.99e-05 | 4.32e-01 | 0.0216 |
| 30827 | CXXC1 | HTA11_1938_2000001011 | Human | Colorectum | AD | 6.49e-10 | 4.07e-01 | -0.0811 |
| 30827 | CXXC1 | HTA11_347_2000001011 | Human | Colorectum | AD | 1.34e-12 | 2.98e-01 | -0.1954 |
| 30827 | CXXC1 | HTA11_411_2000001011 | Human | Colorectum | SER | 6.89e-05 | 6.07e-01 | -0.2602 |
| 30827 | CXXC1 | HTA11_3361_2000001011 | Human | Colorectum | AD | 2.22e-10 | 5.15e-01 | -0.1207 |
| 30827 | CXXC1 | HTA11_83_2000001011 | Human | Colorectum | SER | 8.40e-05 | 2.77e-01 | -0.1526 |
| 30827 | CXXC1 | HTA11_696_2000001011 | Human | Colorectum | AD | 1.00e-07 | 3.19e-01 | -0.1464 |
| 30827 | CXXC1 | HTA11_866_2000001011 | Human | Colorectum | AD | 8.20e-03 | 1.88e-01 | -0.1001 |
| 30827 | CXXC1 | HTA11_1391_2000001011 | Human | Colorectum | AD | 4.92e-13 | 5.33e-01 | -0.059 |
| 30827 | CXXC1 | HTA11_5216_2000001011 | Human | Colorectum | SER | 3.31e-03 | 3.33e-01 | -0.1462 |
| 30827 | CXXC1 | HTA11_546_2000001011 | Human | Colorectum | AD | 4.06e-03 | 2.64e-01 | -0.0842 |
| 30827 | CXXC1 | HTA11_866_3004761011 | Human | Colorectum | AD | 8.43e-07 | 2.58e-01 | 0.096 |
| 30827 | CXXC1 | HTA11_10711_2000001011 | Human | Colorectum | AD | 1.47e-03 | 2.72e-01 | 0.0338 |
| 30827 | CXXC1 | HTA11_7696_3000711011 | Human | Colorectum | AD | 3.98e-08 | 3.16e-01 | 0.0674 |
| 30827 | CXXC1 | HTA11_6818_2000001011 | Human | Colorectum | AD | 1.50e-02 | 2.61e-01 | 0.0112 |
| 30827 | CXXC1 | HTA11_6818_2000001021 | Human | Colorectum | AD | 2.75e-04 | 2.28e-01 | 0.0588 |
| 30827 | CXXC1 | HTA11_99999970781_79442 | Human | Colorectum | MSS | 4.69e-03 | 2.25e-01 | 0.294 |
| 30827 | CXXC1 | HTA11_99999971662_82457 | Human | Colorectum | MSS | 9.17e-08 | 3.00e-01 | 0.3859 |
| Page: 1 2 3 4 5 |
| Tissue | Expression Dynamics | Abbreviation |
| Colorectum (GSE201348) |  | FAP: Familial adenomatous polyposis |
| CRC: Colorectal cancer | ||
| Colorectum (HTA11) |  | AD: Adenomas |
| SER: Sessile serrated lesions | ||
| MSI-H: Microsatellite-high colorectal cancer | ||
| MSS: Microsatellite stable colorectal cancer | ||
| Esophagus | 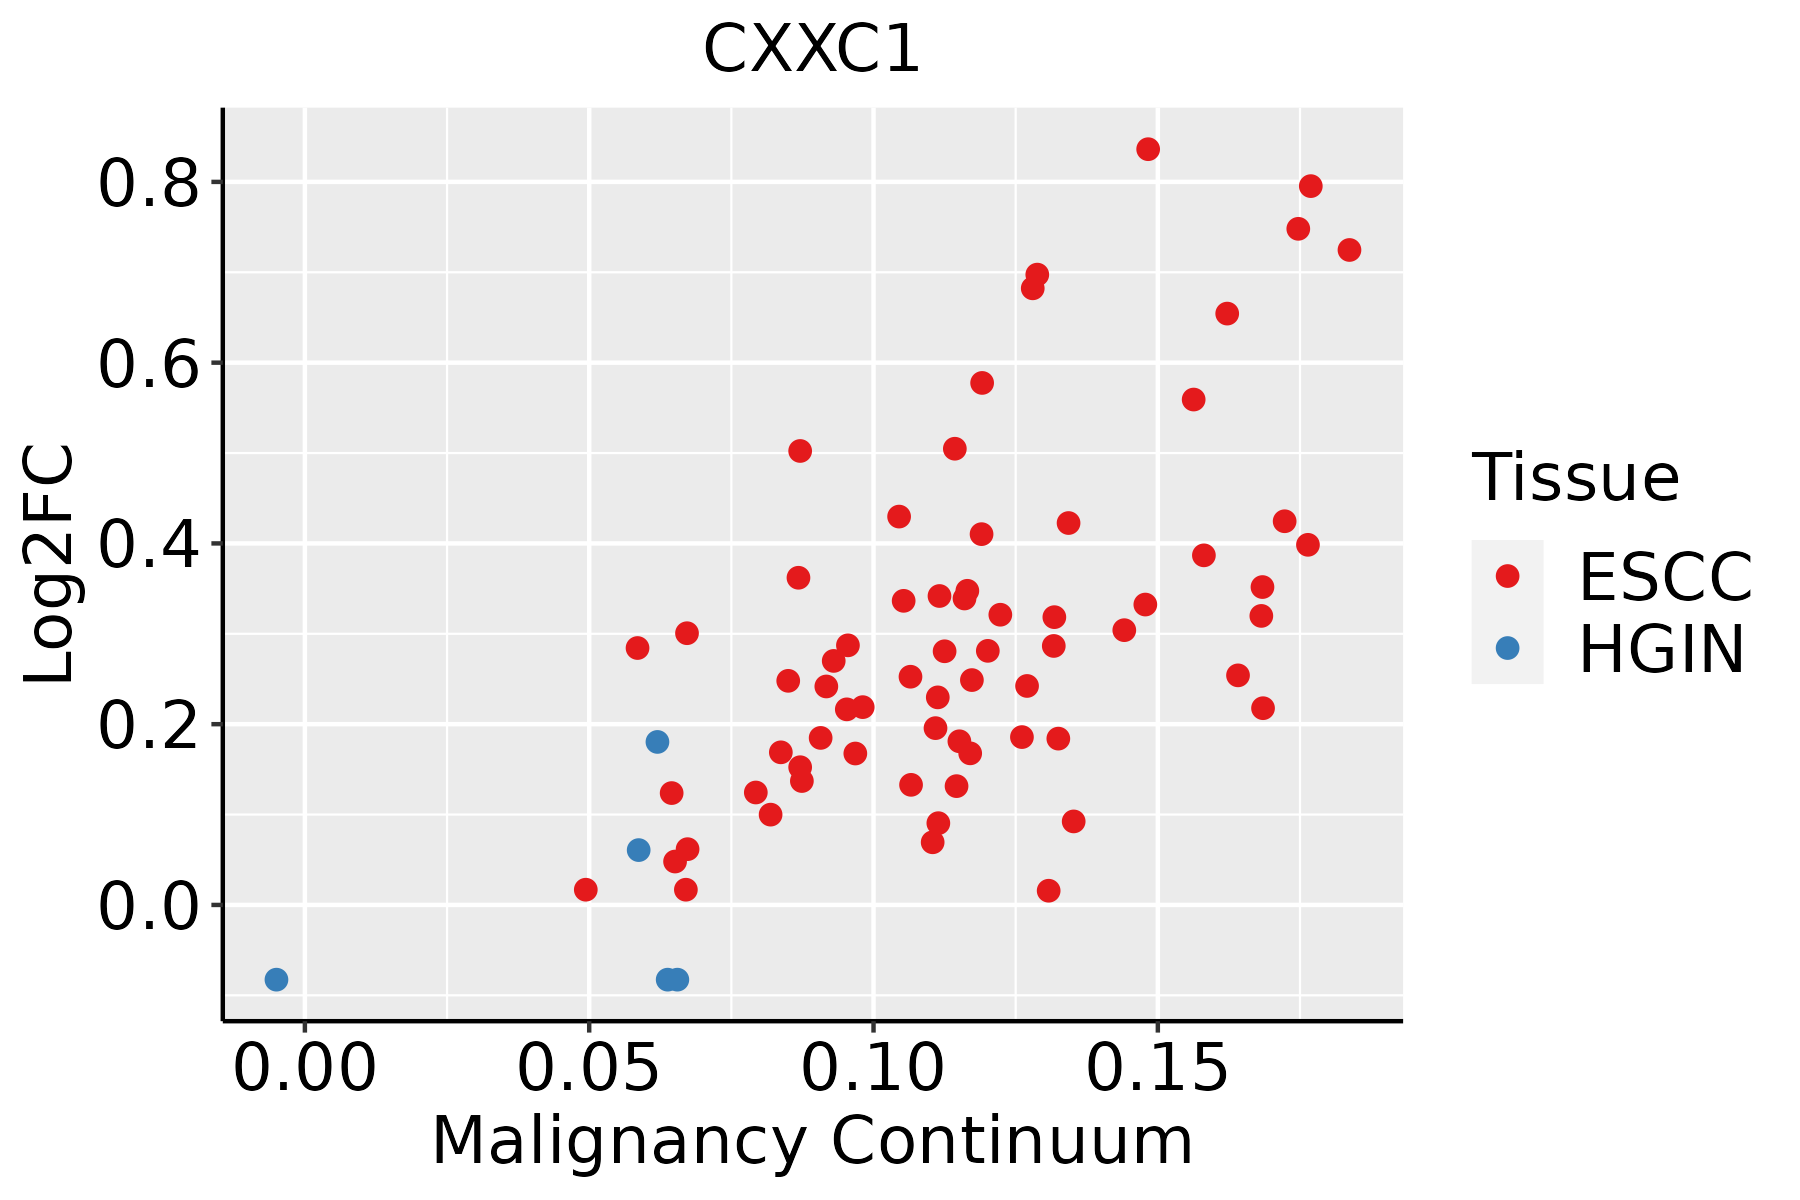 | ESCC: Esophageal squamous cell carcinoma |
| HGIN: High-grade intraepithelial neoplasias | ||
| LGIN: Low-grade intraepithelial neoplasias | ||
| Liver | 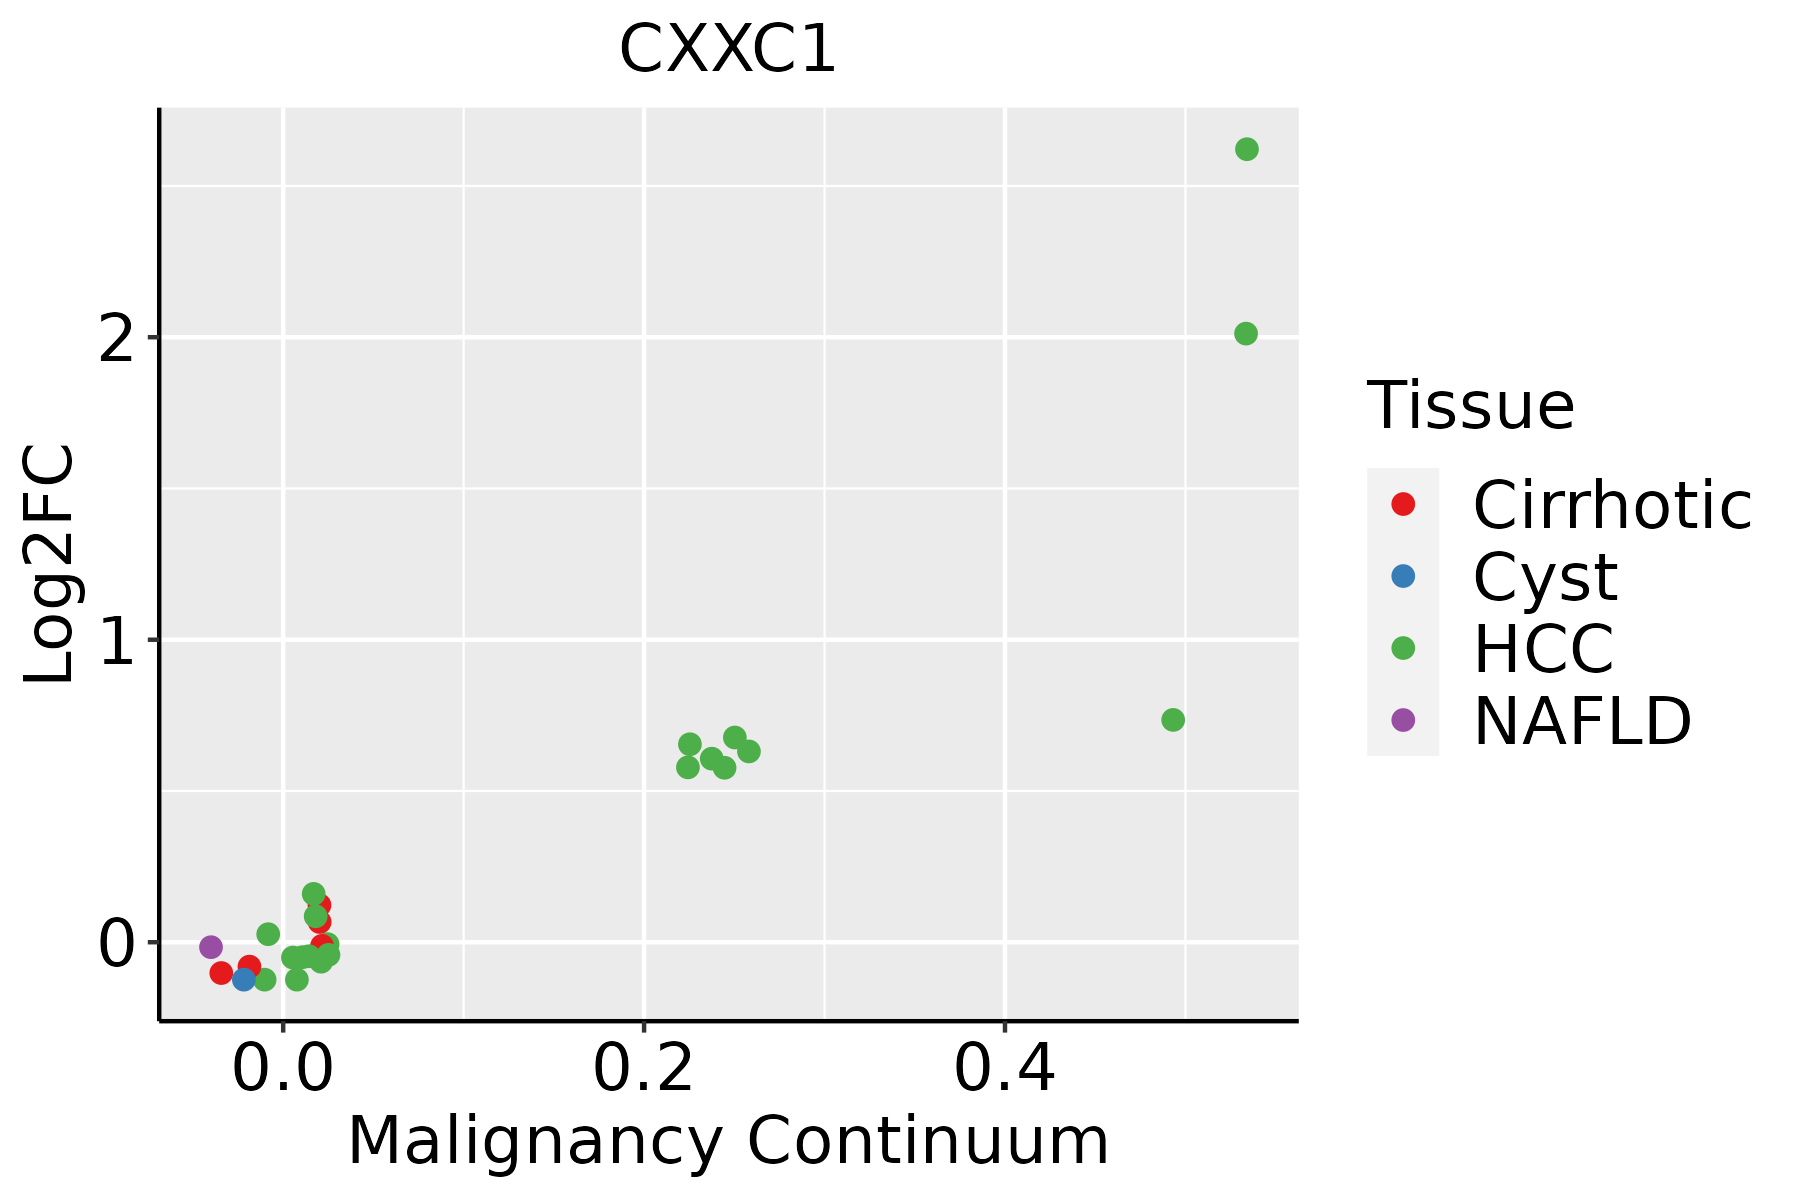 | HCC: Hepatocellular carcinoma |
| NAFLD: Non-alcoholic fatty liver disease | ||
| Oral Cavity |  | EOLP: Erosive Oral lichen planus |
| LP: leukoplakia | ||
| NEOLP: Non-erosive oral lichen planus | ||
| OSCC: Oral squamous cell carcinoma |
| ∗log2FC in expression of this searched gene in stem-like cells from each diseased tissue sample relative to stem-like cells in normal samples in each tissue plotted against the malignancy continuum. Samples are colored based on if they are from different disease stage. |
Top |
Malignant transformation related pathway analysis |
| Find out the enriched GO biological processes and KEGG pathways involved in transition from healthy to precancer to cancer |
| Tissue | Disease Stage | Enriched GO biological Processes |
| Colorectum | AD |  |
| Colorectum | SER |  |
| Colorectum | MSS |  |
| Colorectum | MSI-H |  |
| Colorectum | FAP |  |
| ∗Top 15 enriched GO BP terms are showed in the bar plot of each disease state in each tissue. Each row represents a significant GO biological process which is colored according to the -log10(p.adjust). |
| Page: 1 2 3 4 5 6 7 8 9 |
| GO ID | Tissue | Disease Stage | Description | Gene Ratio | Bg Ratio | pvalue | p.adjust | Count |
| GO:0016570 | Colorectum | MSS | histone modification | 113/3467 | 463/18723 | 8.37e-04 | 8.68e-03 | 113 |
| GO:001657015 | Esophagus | ESCC | histone modification | 323/8552 | 463/18723 | 2.61e-26 | 7.88e-24 | 323 |
| GO:001820514 | Esophagus | ESCC | peptidyl-lysine modification | 259/8552 | 376/18723 | 3.90e-20 | 5.26e-18 | 259 |
| GO:00434143 | Esophagus | ESCC | macromolecule methylation | 199/8552 | 316/18723 | 3.44e-10 | 9.57e-09 | 199 |
| GO:00322592 | Esophagus | ESCC | methylation | 222/8552 | 364/18723 | 2.26e-09 | 5.09e-08 | 222 |
| GO:000647914 | Esophagus | ESCC | protein methylation | 115/8552 | 181/18723 | 9.07e-07 | 1.16e-05 | 115 |
| GO:000821314 | Esophagus | ESCC | protein alkylation | 115/8552 | 181/18723 | 9.07e-07 | 1.16e-05 | 115 |
| GO:00165718 | Esophagus | ESCC | histone methylation | 89/8552 | 141/18723 | 2.17e-05 | 1.87e-04 | 89 |
| GO:003496814 | Esophagus | ESCC | histone lysine methylation | 72/8552 | 115/18723 | 1.85e-04 | 1.18e-03 | 72 |
| GO:001802214 | Esophagus | ESCC | peptidyl-lysine methylation | 79/8552 | 131/18723 | 5.17e-04 | 2.86e-03 | 79 |
| GO:00182051 | Liver | Cirrhotic | peptidyl-lysine modification | 134/4634 | 376/18723 | 1.29e-06 | 2.59e-05 | 134 |
| GO:001657011 | Liver | Cirrhotic | histone modification | 154/4634 | 463/18723 | 1.92e-05 | 2.57e-04 | 154 |
| GO:00064791 | Liver | Cirrhotic | protein methylation | 61/4634 | 181/18723 | 4.13e-03 | 2.21e-02 | 61 |
| GO:00082131 | Liver | Cirrhotic | protein alkylation | 61/4634 | 181/18723 | 4.13e-03 | 2.21e-02 | 61 |
| GO:00165711 | Liver | Cirrhotic | histone methylation | 49/4634 | 141/18723 | 4.90e-03 | 2.56e-02 | 49 |
| GO:001657021 | Liver | HCC | histone modification | 283/7958 | 463/18723 | 2.68e-16 | 2.33e-14 | 283 |
| GO:00182052 | Liver | HCC | peptidyl-lysine modification | 230/7958 | 376/18723 | 1.51e-13 | 8.32e-12 | 230 |
| GO:00434141 | Liver | HCC | macromolecule methylation | 183/7958 | 316/18723 | 2.00e-08 | 4.72e-07 | 183 |
| GO:0032259 | Liver | HCC | methylation | 206/7958 | 364/18723 | 3.35e-08 | 7.53e-07 | 206 |
| GO:00064792 | Liver | HCC | protein methylation | 111/7958 | 181/18723 | 2.36e-07 | 4.18e-06 | 111 |
| Page: 1 2 |
| Pathway ID | Tissue | Disease Stage | Description | Gene Ratio | Bg Ratio | pvalue | p.adjust | qvalue | Count |
| Page: 1 |
Top |
Cell-cell communication analysis |
| Identification of potential cell-cell interactions between two cell types and their ligand-receptor pairs for different disease states |
| Ligand | Receptor | LRpair | Pathway | Tissue | Disease Stage |
| Page: 1 |
Top |
Single-cell gene regulatory network inference analysis |
| Find out the significant the regulons (TFs) and the target genes of each regulon across cell types for different disease states |
| TF | Cell Type | Tissue | Disease Stage | Target Gene | RSS | Regulon Activity |
| CXXC1 | MDSC | Prostate | ADJ | HIST1H1E,HIST1H2BK,HIST1H1D, etc. | 1.21e-01 |  |
| CXXC1 | M1MAC | Prostate | ADJ | HIST1H1E,HIST1H2BK,HIST1H1D, etc. | 9.39e-02 | |
| CXXC1 | CD8TCM | Prostate | Tumor | HIST1H1E,HIST1H2BK,HIST1H1D, etc. | 1.83e-01 |  |
| CXXC1 | MDSC | Prostate | Tumor | HIST1H1E,HIST1H2BK,HIST1H1D, etc. | 8.15e-02 | |
| CXXC1 | FIB | Skin | ADJ | EP400,STAM2,PM20D2, etc. | 3.04e-02 |  |
| CXXC1 | SMC | Skin | Healthy | EP400,STAM2,PM20D2, etc. | 1.04e-01 |  |
| CXXC1 | FIB | Skin | SCCIS | EP400,STAM2,PM20D2, etc. | 1.64e-02 |  |
| ∗The dot plots of a searched regulon are shown for all cell subpopulations in each disease state of each tissue based on the regulon specific score inferred using pySCENIC and by calculating the average expression. |
| Page: 1 |
Top |
Somatic mutation of malignant transformation related genes |
| Annotation of somatic variants for genes involved in malignant transformation |
| Hugo Symbol | Variant Class | Variant Classification | dbSNP RS | HGVSc | HGVSp | HGVSp Short | SWISSPROT | BIOTYPE | SIFT | PolyPhen | Tumor Sample Barcode | Tissue | Histology | Sex | Age | Stage | Therapy Types | Drugs | Outcome |
| CXXC1 | SNV | Missense_Mutation | novel | c.921G>A | p.Met307Ile | p.M307I | Q9P0U4 | protein_coding | tolerated(0.44) | benign(0.015) | TCGA-AC-A3W6-01 | Breast | breast invasive carcinoma | Female | >=65 | III/IV | Unknown | Unknown | SD |
| CXXC1 | SNV | Missense_Mutation | rs372083898 | c.1105N>A | p.Asp369Asn | p.D369N | Q9P0U4 | protein_coding | tolerated(0.08) | possibly_damaging(0.599) | TCGA-GM-A2D9-01 | Breast | breast invasive carcinoma | Female | >=65 | I/II | Hormone Therapy | arimidex | SD |
| CXXC1 | insertion | Frame_Shift_Ins | novel | c.1280_1281insCACAGACCTGCAGATCTTCTGTGTTTCCTGTGGGCACCCCATC | p.Glu427AspfsTer45 | p.E427Dfs*45 | Q9P0U4 | protein_coding | TCGA-BH-A0H6-01 | Breast | breast invasive carcinoma | Female | >=65 | I/II | Unknown | Unknown | SD | ||
| CXXC1 | SNV | Missense_Mutation | novel | c.1058N>A | p.Arg353Gln | p.R353Q | Q9P0U4 | protein_coding | deleterious(0.01) | benign(0.062) | TCGA-2W-A8YY-01 | Cervix | cervical & endocervical cancer | Female | <65 | I/II | Chemotherapy | cisplatin | CR |
| CXXC1 | SNV | Missense_Mutation | novel | c.1057N>T | p.Arg353Trp | p.R353W | Q9P0U4 | protein_coding | deleterious(0) | possibly_damaging(0.802) | TCGA-2W-A8YY-01 | Cervix | cervical & endocervical cancer | Female | <65 | I/II | Chemotherapy | cisplatin | CR |
| CXXC1 | SNV | Missense_Mutation | rs200536058 | c.757N>T | p.Arg253Cys | p.R253C | Q9P0U4 | protein_coding | deleterious(0.01) | probably_damaging(0.942) | TCGA-2W-A8YY-01 | Cervix | cervical & endocervical cancer | Female | <65 | I/II | Chemotherapy | cisplatin | CR |
| CXXC1 | SNV | Missense_Mutation | novel | c.313G>A | p.Glu105Lys | p.E105K | Q9P0U4 | protein_coding | tolerated(0.14) | benign(0.024) | TCGA-JW-A5VL-01 | Cervix | cervical & endocervical cancer | Female | <65 | I/II | Unknown | Unknown | SD |
| CXXC1 | SNV | Missense_Mutation | c.1723G>C | p.Asp575His | p.D575H | Q9P0U4 | protein_coding | deleterious(0.04) | probably_damaging(0.975) | TCGA-LP-A7HU-01 | Cervix | cervical & endocervical cancer | Female | <65 | I/II | Unknown | Unknown | SD | |
| CXXC1 | SNV | Missense_Mutation | novel | c.1574N>T | p.Thr525Ile | p.T525I | Q9P0U4 | protein_coding | deleterious(0) | probably_damaging(0.984) | TCGA-5M-AAT6-01 | Colorectum | colon adenocarcinoma | Female | <65 | III/IV | Unknown | Unknown | PD |
| CXXC1 | SNV | Missense_Mutation | c.1778N>A | p.Arg593His | p.R593H | Q9P0U4 | protein_coding | tolerated(0.12) | benign(0.093) | TCGA-AA-A010-01 | Colorectum | colon adenocarcinoma | Female | <65 | I/II | Chemotherapy | folinic | CR |
| Page: 1 2 3 4 5 6 7 8 9 |
Top |
Related drugs of malignant transformation related genes |
| Identification of chemicals and drugs interact with genes involved in malignant transfromation |
| (DGIdb 4.0) |
| Entrez ID | Symbol | Category | Interaction Types | Drug Claim Name | Drug Name | PMIDs |
| Page: 1 |

Copyright 2023-Present -The University of Texas Health Science Center at Houston |