
|
|||||
|
 | |
| |
| |
| |
| |
| |
|
Gene: CXCR6 |
Gene summary for CXCR6 |
| Gene information | Species | Human | Gene symbol | CXCR6 | Gene ID | 10663 |
| Gene name | C-X-C motif chemokine receptor 6 | |
| Gene Alias | BONZO | |
| Cytomap | 3p21.31 | |
| Gene Type | protein-coding | GO ID | GO:0002376 | UniProtAcc | A0N0N3 |
Top |
Malignant transformation analysis |
| Identification of the aberrant gene expression in precancerous and cancerous lesions by comparing the gene expression of stem-like cells in diseased tissues with normal stem cells |
| Entrez ID | Symbol | Replicates | Species | Organ | Tissue | Adj P-value | Log2FC | Malignancy |
| 10663 | CXCR6 | C21 | Human | Oral cavity | OSCC | 8.63e-03 | 2.41e-01 | 0.2678 |
| 10663 | CXCR6 | C38 | Human | Oral cavity | OSCC | 2.38e-04 | 9.69e-01 | 0.172 |
| 10663 | CXCR6 | LN22 | Human | Oral cavity | OSCC | 1.09e-03 | 6.57e-01 | 0.1733 |
| Page: 1 |
| Tissue | Expression Dynamics | Abbreviation |
| Oral Cavity | 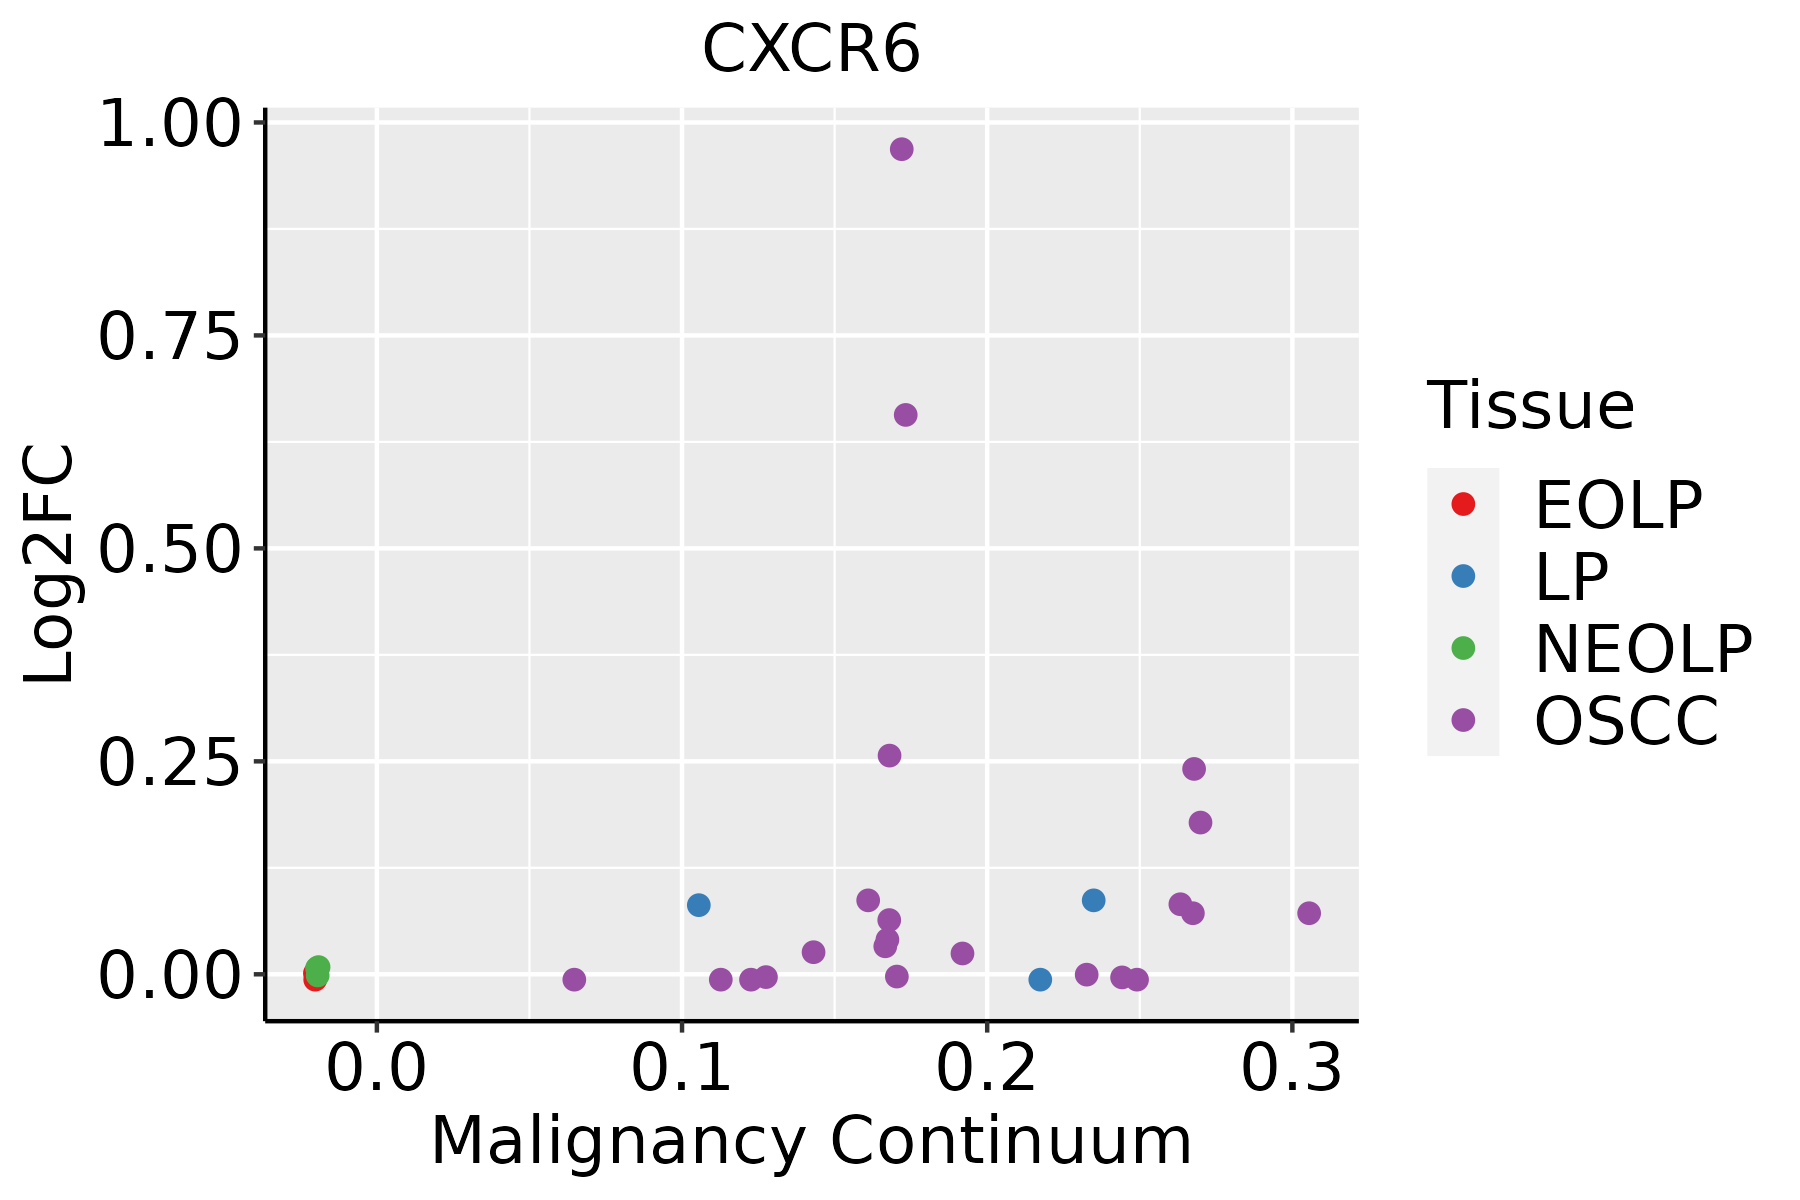 | EOLP: Erosive Oral lichen planus |
| LP: leukoplakia | ||
| NEOLP: Non-erosive oral lichen planus | ||
| OSCC: Oral squamous cell carcinoma |
| ∗log2FC in expression of this searched gene in stem-like cells from each diseased tissue sample relative to stem-like cells in normal samples in each tissue plotted against the malignancy continuum. Samples are colored based on if they are from different disease stage. |
Top |
Malignant transformation related pathway analysis |
| Find out the enriched GO biological processes and KEGG pathways involved in transition from healthy to precancer to cancer |
| Tissue | Disease Stage | Enriched GO biological Processes |
| Colorectum | AD |  |
| Colorectum | SER |  |
| Colorectum | MSS |  |
| Colorectum | MSI-H |  |
| Colorectum | FAP |  |
| ∗Top 15 enriched GO BP terms are showed in the bar plot of each disease state in each tissue. Each row represents a significant GO biological process which is colored according to the -log10(p.adjust). |
| Page: 1 2 3 4 5 6 7 8 9 |
| GO ID | Tissue | Disease Stage | Description | Gene Ratio | Bg Ratio | pvalue | p.adjust | Count |
| GO:001603220 | Oral cavity | OSCC | viral process | 274/7305 | 415/18723 | 2.42e-29 | 1.70e-26 | 274 |
| GO:001905820 | Oral cavity | OSCC | viral life cycle | 208/7305 | 317/18723 | 4.59e-22 | 1.00e-19 | 208 |
| GO:001907920 | Oral cavity | OSCC | viral genome replication | 95/7305 | 131/18723 | 6.35e-15 | 4.02e-13 | 95 |
| GO:00192214 | Oral cavity | OSCC | cytokine-mediated signaling pathway | 222/7305 | 472/18723 | 2.02e-04 | 1.35e-03 | 222 |
| GO:00603269 | Oral cavity | OSCC | cell chemotaxis | 146/7305 | 310/18723 | 2.13e-03 | 9.80e-03 | 146 |
| Page: 1 |
| Pathway ID | Tissue | Disease Stage | Description | Gene Ratio | Bg Ratio | pvalue | p.adjust | qvalue | Count |
| Page: 1 |
Top |
Cell-cell communication analysis |
| Identification of potential cell-cell interactions between two cell types and their ligand-receptor pairs for different disease states |
| Ligand | Receptor | LRpair | Pathway | Tissue | Disease Stage |
| CXCL16 | CXCR6 | CXCL16_CXCR6 | CXCL | Breast | ADJ |
| CXCL16 | CXCR6 | CXCL16_CXCR6 | CXCL | Breast | DCIS |
| CXCL16 | CXCR6 | CXCL16_CXCR6 | CXCL | Breast | Healthy |
| CXCL16 | CXCR6 | CXCL16_CXCR6 | CXCL | Breast | IDC |
| CXCL16 | CXCR6 | CXCL16_CXCR6 | CXCL | Breast | Precancer |
| CXCL16 | CXCR6 | CXCL16_CXCR6 | CXCL | Cervix | ADJ |
| CXCL16 | CXCR6 | CXCL16_CXCR6 | CXCL | Cervix | CC |
| CXCL16 | CXCR6 | CXCL16_CXCR6 | CXCL | Cervix | Precancer |
| CXCL16 | CXCR6 | CXCL16_CXCR6 | CXCL | CRC | MSI-H |
| CXCL16 | CXCR6 | CXCL16_CXCR6 | CXCL | CRC | SER |
| CXCL16 | CXCR6 | CXCL16_CXCR6 | CXCL | Endometrium | ADJ |
| CXCL16 | CXCR6 | CXCL16_CXCR6 | CXCL | Endometrium | AEH |
| CXCL16 | CXCR6 | CXCL16_CXCR6 | CXCL | Endometrium | EEC |
| CXCL16 | CXCR6 | CXCL16_CXCR6 | CXCL | GC | ADJ |
| CXCL16 | CXCR6 | CXCL16_CXCR6 | CXCL | GC | GC |
| CXCL16 | CXCR6 | CXCL16_CXCR6 | CXCL | HNSCC | ADJ |
| CXCL16 | CXCR6 | CXCL16_CXCR6 | CXCL | HNSCC | OSCC |
| CXCL16 | CXCR6 | CXCL16_CXCR6 | CXCL | HNSCC | Precancer |
| CXCL16 | CXCR6 | CXCL16_CXCR6 | CXCL | Liver | HCC |
| CXCL16 | CXCR6 | CXCL16_CXCR6 | CXCL | Liver | Healthy |
| Page: 1 |
Top |
Single-cell gene regulatory network inference analysis |
| Find out the significant the regulons (TFs) and the target genes of each regulon across cell types for different disease states |
| TF | Cell Type | Tissue | Disease Stage | Target Gene | RSS | Regulon Activity |
| ∗The dot plots of a searched regulon are shown for all cell subpopulations in each disease state of each tissue based on the regulon specific score inferred using pySCENIC and by calculating the average expression. |
| Page: 1 |
Top |
Somatic mutation of malignant transformation related genes |
| Annotation of somatic variants for genes involved in malignant transformation |
| Hugo Symbol | Variant Class | Variant Classification | dbSNP RS | HGVSc | HGVSp | HGVSp Short | SWISSPROT | BIOTYPE | SIFT | PolyPhen | Tumor Sample Barcode | Tissue | Histology | Sex | Age | Stage | Therapy Types | Drugs | Outcome |
| CXCR6 | SNV | Missense_Mutation | rs768831744 | c.464N>C | p.Ile155Thr | p.I155T | O00574 | protein_coding | tolerated(0.23) | benign(0.012) | TCGA-A2-A3XU-01 | Breast | breast invasive carcinoma | Female | <65 | I/II | Hormone Therapy | arimidex | PD |
| CXCR6 | SNV | Missense_Mutation | c.83N>G | p.Gln28Arg | p.Q28R | O00574 | protein_coding | tolerated(0.51) | benign(0) | TCGA-AC-A23H-01 | Breast | breast invasive carcinoma | Female | >=65 | I/II | Unknown | Unknown | PD | |
| CXCR6 | insertion | Frame_Shift_Ins | novel | c.272_273insAGCTCATATTATCAGTGGGCTCAAC | p.Ile92AlafsTer11 | p.I92Afs*11 | O00574 | protein_coding | TCGA-A2-A0D1-01 | Breast | breast invasive carcinoma | Female | >=65 | I/II | Chemotherapy | taxotere | SD | ||
| CXCR6 | insertion | In_Frame_Ins | novel | c.216_217insATTATT | p.Asn72_Leu73insIleIle | p.N72_L73insII | O00574 | protein_coding | TCGA-A2-A0EQ-01 | Breast | breast invasive carcinoma | Female | <65 | I/II | Chemotherapy | adriamycin | SD | ||
| CXCR6 | insertion | Nonsense_Mutation | novel | c.218_219insTAAGAGCAAAGCCACCTGTTTCATATTTTAAATGATGA | p.Pro74LysfsTer10 | p.P74Kfs*10 | O00574 | protein_coding | TCGA-A2-A0EQ-01 | Breast | breast invasive carcinoma | Female | <65 | I/II | Chemotherapy | adriamycin | SD | ||
| CXCR6 | insertion | Nonsense_Mutation | novel | c.78_79insTGACTTGCAGGGGTACAGGTCTGCCGGCTATGTTGCCCAGGCTGG | p.Phe26_Leu27insTer | p.F26_L27ins* | O00574 | protein_coding | TCGA-A8-A0A1-01 | Breast | breast invasive carcinoma | Female | >=65 | I/II | Hormone Therapy | tamoxiphen | SD | ||
| CXCR6 | insertion | Frame_Shift_Ins | novel | c.129_130insAACCATCCATCATCAGTGTTGCTCTTCCAAACAGCAC | p.Cys44AsnfsTer30 | p.C44Nfs*30 | O00574 | protein_coding | TCGA-B6-A0I6-01 | Breast | breast invasive carcinoma | Female | <65 | I/II | Unknown | Unknown | PD | ||
| CXCR6 | SNV | Missense_Mutation | rs777650347 | c.891N>C | p.Lys297Asn | p.K297N | O00574 | protein_coding | tolerated(0.12) | benign(0.006) | TCGA-EK-A2R8-01 | Cervix | cervical & endocervical cancer | Female | <65 | I/II | Unknown | Unknown | SD |
| CXCR6 | SNV | Missense_Mutation | c.89N>A | p.Ser30Asn | p.S30N | O00574 | protein_coding | tolerated(0.5) | benign(0) | TCGA-AA-3811-01 | Colorectum | colon adenocarcinoma | Female | >=65 | III/IV | Unknown | Unknown | PD | |
| CXCR6 | SNV | Missense_Mutation | novel | c.289N>A | p.Phe97Ile | p.F97I | O00574 | protein_coding | deleterious(0) | probably_damaging(0.999) | TCGA-A5-A0G2-01 | Endometrium | uterine corpus endometrioid carcinoma | Female | <65 | III/IV | Unknown | Unknown | SD |
| Page: 1 2 3 4 |
Top |
Related drugs of malignant transformation related genes |
| Identification of chemicals and drugs interact with genes involved in malignant transfromation |
| (DGIdb 4.0) |
| Entrez ID | Symbol | Category | Interaction Types | Drug Claim Name | Drug Name | PMIDs |
| 10663 | CXCR6 | G PROTEIN COUPLED RECEPTOR, DRUGGABLE GENOME, EXTERNAL SIDE OF PLASMA MEMBRANE | agonist | 178100558 | ||
| 10663 | CXCR6 | G PROTEIN COUPLED RECEPTOR, DRUGGABLE GENOME, EXTERNAL SIDE OF PLASMA MEMBRANE | agonist | 135651711 |
| Page: 1 |

Copyright 2023-Present -The University of Texas Health Science Center at Houston |