
|
|||||
|
 | |
| |
| |
| |
| |
| |
|
Gene: CXCR2 |
Gene summary for CXCR2 |
| Gene information | Species | Human | Gene symbol | CXCR2 | Gene ID | 3579 |
| Gene name | C-X-C motif chemokine receptor 2 | |
| Gene Alias | CD182 | |
| Cytomap | 2q35 | |
| Gene Type | protein-coding | GO ID | GO:0001525 | UniProtAcc | P25025 |
Top |
Malignant transformation analysis |
| Identification of the aberrant gene expression in precancerous and cancerous lesions by comparing the gene expression of stem-like cells in diseased tissues with normal stem cells |
| Entrez ID | Symbol | Replicates | Species | Organ | Tissue | Adj P-value | Log2FC | Malignancy |
| 3579 | CXCR2 | HCC1 | Human | Liver | HCC | 1.08e-08 | 8.70e-01 | 0.5336 |
| 3579 | CXCR2 | HCC2 | Human | Liver | HCC | 7.41e-12 | 9.57e-01 | 0.5341 |
| 3579 | CXCR2 | HCC5 | Human | Liver | HCC | 1.90e-09 | 1.64e+00 | 0.4932 |
| Page: 1 |
| Tissue | Expression Dynamics | Abbreviation |
| Liver | 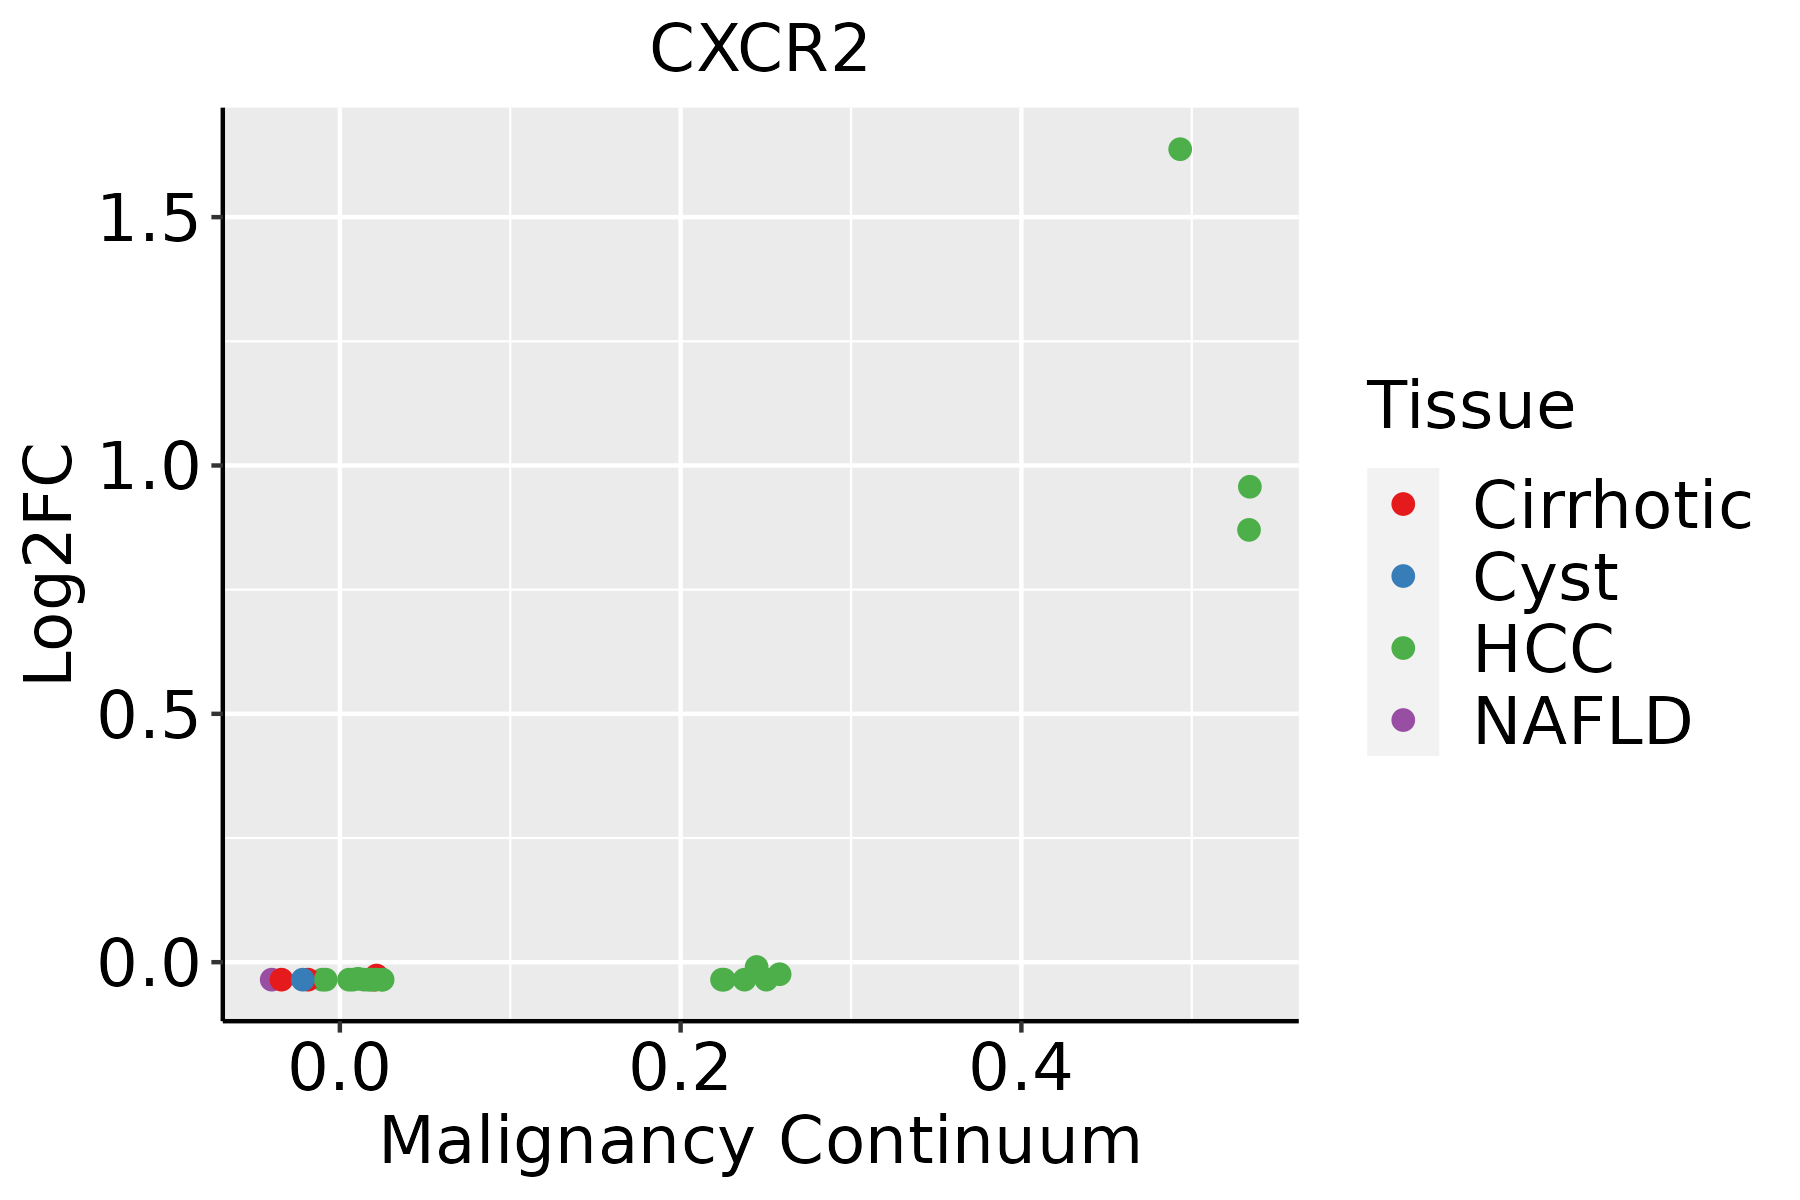 | HCC: Hepatocellular carcinoma |
| NAFLD: Non-alcoholic fatty liver disease |
| ∗log2FC in expression of this searched gene in stem-like cells from each diseased tissue sample relative to stem-like cells in normal samples in each tissue plotted against the malignancy continuum. Samples are colored based on if they are from different disease stage. |
Top |
Malignant transformation related pathway analysis |
| Find out the enriched GO biological processes and KEGG pathways involved in transition from healthy to precancer to cancer |
| Tissue | Disease Stage | Enriched GO biological Processes |
| Colorectum | AD |  |
| Colorectum | SER |  |
| Colorectum | MSS |  |
| Colorectum | MSI-H |  |
| Colorectum | FAP |  |
| ∗Top 15 enriched GO BP terms are showed in the bar plot of each disease state in each tissue. Each row represents a significant GO biological process which is colored according to the -log10(p.adjust). |
| Page: 1 2 3 4 5 6 7 8 9 |
| GO ID | Tissue | Disease Stage | Description | Gene Ratio | Bg Ratio | pvalue | p.adjust | Count |
| GO:000226222 | Liver | HCC | myeloid cell homeostasis | 93/7958 | 157/18723 | 1.67e-05 | 1.81e-04 | 93 |
| GO:004311221 | Liver | HCC | receptor metabolic process | 96/7958 | 166/18723 | 4.69e-05 | 4.50e-04 | 96 |
| GO:000689821 | Liver | HCC | receptor-mediated endocytosis | 134/7958 | 244/18723 | 5.73e-05 | 5.31e-04 | 134 |
| GO:004887222 | Liver | HCC | homeostasis of number of cells | 147/7958 | 272/18723 | 7.48e-05 | 6.70e-04 | 147 |
| GO:003090121 | Liver | HCC | midbrain development | 54/7958 | 90/18723 | 6.04e-04 | 3.79e-03 | 54 |
| GO:00016553 | Liver | HCC | urogenital system development | 170/7958 | 338/18723 | 2.15e-03 | 1.08e-02 | 170 |
| GO:00018222 | Liver | HCC | kidney development | 148/7958 | 293/18723 | 3.25e-03 | 1.49e-02 | 148 |
| GO:00720012 | Liver | HCC | renal system development | 152/7958 | 302/18723 | 3.45e-03 | 1.56e-02 | 152 |
| GO:00025262 | Liver | HCC | acute inflammatory response | 62/7958 | 112/18723 | 4.06e-03 | 1.77e-02 | 62 |
| Page: 1 |
| Pathway ID | Tissue | Disease Stage | Description | Gene Ratio | Bg Ratio | pvalue | p.adjust | qvalue | Count |
| hsa0414422 | Liver | HCC | Endocytosis | 178/4020 | 251/8465 | 2.03e-14 | 5.22e-13 | 2.91e-13 | 178 |
| hsa051202 | Liver | HCC | Epithelial cell signaling in Helicobacter pylori infection | 50/4020 | 70/8465 | 3.96e-05 | 2.16e-04 | 1.20e-04 | 50 |
| hsa0516322 | Liver | HCC | Human cytomegalovirus infection | 131/4020 | 225/8465 | 6.86e-04 | 2.77e-03 | 1.54e-03 | 131 |
| hsa0414432 | Liver | HCC | Endocytosis | 178/4020 | 251/8465 | 2.03e-14 | 5.22e-13 | 2.91e-13 | 178 |
| hsa051203 | Liver | HCC | Epithelial cell signaling in Helicobacter pylori infection | 50/4020 | 70/8465 | 3.96e-05 | 2.16e-04 | 1.20e-04 | 50 |
| hsa0516332 | Liver | HCC | Human cytomegalovirus infection | 131/4020 | 225/8465 | 6.86e-04 | 2.77e-03 | 1.54e-03 | 131 |
| Page: 1 |
Top |
Cell-cell communication analysis |
| Identification of potential cell-cell interactions between two cell types and their ligand-receptor pairs for different disease states |
| Ligand | Receptor | LRpair | Pathway | Tissue | Disease Stage |
| CXCL1 | CXCR2 | CXCL1_CXCR2 | CXCL | Cervix | ADJ |
| CXCL2 | CXCR2 | CXCL2_CXCR2 | CXCL | Cervix | ADJ |
| CXCL3 | CXCR2 | CXCL3_CXCR2 | CXCL | Cervix | ADJ |
| CXCL8 | CXCR2 | CXCL8_CXCR2 | CXCL | Cervix | ADJ |
| CXCL1 | CXCR2 | CXCL1_CXCR2 | CXCL | Cervix | CC |
| CXCL2 | CXCR2 | CXCL2_CXCR2 | CXCL | Cervix | CC |
| CXCL3 | CXCR2 | CXCL3_CXCR2 | CXCL | Cervix | CC |
| CXCL8 | CXCR2 | CXCL8_CXCR2 | CXCL | Cervix | CC |
| CXCL1 | CXCR2 | CXCL1_CXCR2 | CXCL | Cervix | Healthy |
| CXCL2 | CXCR2 | CXCL2_CXCR2 | CXCL | Cervix | Healthy |
| CXCL3 | CXCR2 | CXCL3_CXCR2 | CXCL | Cervix | Healthy |
| CXCL8 | CXCR2 | CXCL8_CXCR2 | CXCL | Cervix | Healthy |
| CXCL1 | CXCR2 | CXCL1_CXCR2 | CXCL | Cervix | Precancer |
| CXCL2 | CXCR2 | CXCL2_CXCR2 | CXCL | Cervix | Precancer |
| CXCL3 | CXCR2 | CXCL3_CXCR2 | CXCL | Cervix | Precancer |
| CXCL8 | CXCR2 | CXCL8_CXCR2 | CXCL | Cervix | Precancer |
| CXCL1 | CXCR2 | CXCL1_CXCR2 | CXCL | Endometrium | EEC |
| CXCL2 | CXCR2 | CXCL2_CXCR2 | CXCL | Endometrium | EEC |
| CXCL3 | CXCR2 | CXCL3_CXCR2 | CXCL | Endometrium | EEC |
| CXCL5 | CXCR2 | CXCL5_CXCR2 | CXCL | Endometrium | EEC |
| Page: 1 |
Top |
Single-cell gene regulatory network inference analysis |
| Find out the significant the regulons (TFs) and the target genes of each regulon across cell types for different disease states |
| TF | Cell Type | Tissue | Disease Stage | Target Gene | RSS | Regulon Activity |
| ∗The dot plots of a searched regulon are shown for all cell subpopulations in each disease state of each tissue based on the regulon specific score inferred using pySCENIC and by calculating the average expression. |
| Page: 1 |
Top |
Somatic mutation of malignant transformation related genes |
| Annotation of somatic variants for genes involved in malignant transformation |
| Hugo Symbol | Variant Class | Variant Classification | dbSNP RS | HGVSc | HGVSp | HGVSp Short | SWISSPROT | BIOTYPE | SIFT | PolyPhen | Tumor Sample Barcode | Tissue | Histology | Sex | Age | Stage | Therapy Types | Drugs | Outcome |
| CXCR2 | SNV | Missense_Mutation | rs776039485 | c.898G>A | p.Glu300Lys | p.E300K | P25025 | protein_coding | tolerated(0.14) | benign(0.073) | TCGA-3C-AALK-01 | Breast | breast invasive carcinoma | Female | <65 | I/II | Chemotherapy | docetaxel | SD |
| CXCR2 | deletion | Frame_Shift_Del | novel | c.1074delT | p.Thr359LeufsTer59 | p.T359Lfs*59 | P25025 | protein_coding | TCGA-D8-A27V-01 | Breast | breast invasive carcinoma | Female | <65 | I/II | Hormone Therapy | tamoxiphen | SD | ||
| CXCR2 | SNV | Missense_Mutation | rs200906463 | c.943N>A | p.Ala315Thr | p.A315T | P25025 | protein_coding | deleterious(0) | possibly_damaging(0.907) | TCGA-EA-A5O9-01 | Cervix | cervical & endocervical cancer | Female | <65 | I/II | Unknown | Unknown | SD |
| CXCR2 | SNV | Missense_Mutation | c.304N>T | p.Pro102Ser | p.P102S | P25025 | protein_coding | deleterious(0) | probably_damaging(0.998) | TCGA-A6-2686-01 | Colorectum | colon adenocarcinoma | Female | >=65 | I/II | Unknown | Unknown | SD | |
| CXCR2 | SNV | Missense_Mutation | c.993N>G | p.Ile331Met | p.I331M | P25025 | protein_coding | tolerated(0.25) | benign(0.003) | TCGA-A6-5665-01 | Colorectum | colon adenocarcinoma | Female | >=65 | I/II | Unknown | Unknown | PD | |
| CXCR2 | SNV | Missense_Mutation | c.575T>G | p.Val192Gly | p.V192G | P25025 | protein_coding | tolerated(0.35) | benign(0) | TCGA-AA-3510-01 | Colorectum | colon adenocarcinoma | Male | >=65 | I/II | Unknown | Unknown | SD | |
| CXCR2 | SNV | Missense_Mutation | c.1063N>A | p.His355Asn | p.H355N | P25025 | protein_coding | tolerated(1) | benign(0) | TCGA-AA-3846-01 | Colorectum | colon adenocarcinoma | Female | >=65 | I/II | Unknown | Unknown | SD | |
| CXCR2 | SNV | Missense_Mutation | rs761141296 | c.742N>T | p.Arg248Trp | p.R248W | P25025 | protein_coding | deleterious(0) | possibly_damaging(0.68) | TCGA-AZ-4313-01 | Colorectum | colon adenocarcinoma | Female | <65 | I/II | Unknown | Unknown | SD |
| CXCR2 | SNV | Missense_Mutation | novel | c.492N>A | p.Phe164Leu | p.F164L | P25025 | protein_coding | tolerated(0.08) | benign(0.241) | TCGA-AZ-4315-01 | Colorectum | colon adenocarcinoma | Male | <65 | I/II | Unknown | Unknown | SD |
| CXCR2 | SNV | Missense_Mutation | c.17N>C | p.Met6Thr | p.M6T | P25025 | protein_coding | tolerated(0.39) | benign(0.006) | TCGA-D5-5539-01 | Colorectum | colon adenocarcinoma | Male | <65 | III/IV | Chemotherapy | 5-fu | PD |
| Page: 1 2 3 4 5 |
Top |
Related drugs of malignant transformation related genes |
| Identification of chemicals and drugs interact with genes involved in malignant transfromation |
| (DGIdb 4.0) |
| Entrez ID | Symbol | Category | Interaction Types | Drug Claim Name | Drug Name | PMIDs |
| 3579 | CXCR2 | DRUGGABLE GENOME, G PROTEIN COUPLED RECEPTOR, EXTERNAL SIDE OF PLASMA MEMBRANE, CELL SURFACE | agonist | 178100555 | ||
| 3579 | CXCR2 | DRUGGABLE GENOME, G PROTEIN COUPLED RECEPTOR, EXTERNAL SIDE OF PLASMA MEMBRANE, CELL SURFACE | N-ACETYL-L-CYSTEINE | ACETYLCYSTEINE | 10716998 | |
| 3579 | CXCR2 | DRUGGABLE GENOME, G PROTEIN COUPLED RECEPTOR, EXTERNAL SIDE OF PLASMA MEMBRANE, CELL SURFACE | agonist | 252166704 | ||
| 3579 | CXCR2 | DRUGGABLE GENOME, G PROTEIN COUPLED RECEPTOR, EXTERNAL SIDE OF PLASMA MEMBRANE, CELL SURFACE | agonist | 135651724 | ||
| 3579 | CXCR2 | DRUGGABLE GENOME, G PROTEIN COUPLED RECEPTOR, EXTERNAL SIDE OF PLASMA MEMBRANE, CELL SURFACE | agonist | 178100554 | ||
| 3579 | CXCR2 | DRUGGABLE GENOME, G PROTEIN COUPLED RECEPTOR, EXTERNAL SIDE OF PLASMA MEMBRANE, CELL SURFACE | antagonist | CHEMBL2103864 | NAVARIXIN | |
| 3579 | CXCR2 | DRUGGABLE GENOME, G PROTEIN COUPLED RECEPTOR, EXTERNAL SIDE OF PLASMA MEMBRANE, CELL SURFACE | GSK1325756 | DANIRIXIN | ||
| 3579 | CXCR2 | DRUGGABLE GENOME, G PROTEIN COUPLED RECEPTOR, EXTERNAL SIDE OF PLASMA MEMBRANE, CELL SURFACE | antagonist | 252166707 | ||
| 3579 | CXCR2 | DRUGGABLE GENOME, G PROTEIN COUPLED RECEPTOR, EXTERNAL SIDE OF PLASMA MEMBRANE, CELL SURFACE | allosteric modulator | 252166706 | REPARIXIN | |
| 3579 | CXCR2 | DRUGGABLE GENOME, G PROTEIN COUPLED RECEPTOR, EXTERNAL SIDE OF PLASMA MEMBRANE, CELL SURFACE | modulator | CHEMBL189475 | LADARIXIN |
| Page: 1 2 3 4 5 |

Copyright 2023-Present -The University of Texas Health Science Center at Houston |