
|
|||||
|
 | |
| |
| |
| |
| |
| |
|
Gene: CXCL9 |
Gene summary for CXCL9 |
| Gene information | Species | Human | Gene symbol | CXCL9 | Gene ID | 4283 |
| Gene name | C-X-C motif chemokine ligand 9 | |
| Gene Alias | CMK | |
| Cytomap | 4q21.1 | |
| Gene Type | protein-coding | GO ID | GO:0000768 | UniProtAcc | Q07325 |
Top |
Malignant transformation analysis |
| Identification of the aberrant gene expression in precancerous and cancerous lesions by comparing the gene expression of stem-like cells in diseased tissues with normal stem cells |
| Entrez ID | Symbol | Replicates | Species | Organ | Tissue | Adj P-value | Log2FC | Malignancy |
| 4283 | CXCL9 | CA_HPV_1 | Human | Cervix | CC | 2.39e-18 | 7.89e-01 | 0.0264 |
| 4283 | CXCL9 | Tumor | Human | Cervix | CC | 8.05e-07 | 2.73e-01 | 0.1241 |
| 4283 | CXCL9 | sample1 | Human | Cervix | CC | 8.75e-08 | 6.20e-01 | 0.0959 |
| 4283 | CXCL9 | T1 | Human | Cervix | CC | 3.71e-08 | 3.45e-01 | 0.0918 |
| 4283 | CXCL9 | T3 | Human | Cervix | CC | 1.24e-06 | 2.09e-01 | 0.1389 |
| 4283 | CXCL9 | P8T-E | Human | Esophagus | ESCC | 3.50e-02 | 4.26e-01 | 0.0889 |
| 4283 | CXCL9 | P24T-E | Human | Esophagus | ESCC | 9.44e-07 | 4.31e-01 | 0.1287 |
| 4283 | CXCL9 | P37T-E | Human | Esophagus | ESCC | 2.57e-08 | 1.19e+00 | 0.1371 |
| 4283 | CXCL9 | P52T-E | Human | Esophagus | ESCC | 1.13e-16 | 1.27e+00 | 0.1555 |
| 4283 | CXCL9 | P62T-E | Human | Esophagus | ESCC | 2.60e-04 | 8.70e-01 | 0.1302 |
| 4283 | CXCL9 | P75T-E | Human | Esophagus | ESCC | 2.02e-06 | 4.87e-01 | 0.1125 |
| 4283 | CXCL9 | P80T-E | Human | Esophagus | ESCC | 4.18e-08 | 2.88e+00 | 0.155 |
| 4283 | CXCL9 | P91T-E | Human | Esophagus | ESCC | 8.74e-05 | 3.34e+00 | 0.1828 |
| 4283 | CXCL9 | HCC5 | Human | Liver | HCC | 3.84e-03 | 4.50e+00 | 0.4932 |
| 4283 | CXCL9 | Pt13.a | Human | Liver | HCC | 6.11e-05 | 2.67e-01 | 0.021 |
| 4283 | CXCL9 | Pt13.c | Human | Liver | HCC | 3.35e-03 | 4.83e-01 | 0.0076 |
| 4283 | CXCL9 | S028 | Human | Liver | HCC | 4.91e-06 | 2.51e+00 | 0.2503 |
| 4283 | CXCL9 | S029 | Human | Liver | HCC | 9.73e-04 | 3.38e+00 | 0.2581 |
| 4283 | CXCL9 | C21 | Human | Oral cavity | OSCC | 2.99e-02 | 1.96e-01 | 0.2678 |
| 4283 | CXCL9 | C30 | Human | Oral cavity | OSCC | 5.67e-45 | 2.77e+00 | 0.3055 |
| Page: 1 2 |
| Tissue | Expression Dynamics | Abbreviation |
| Cervix | 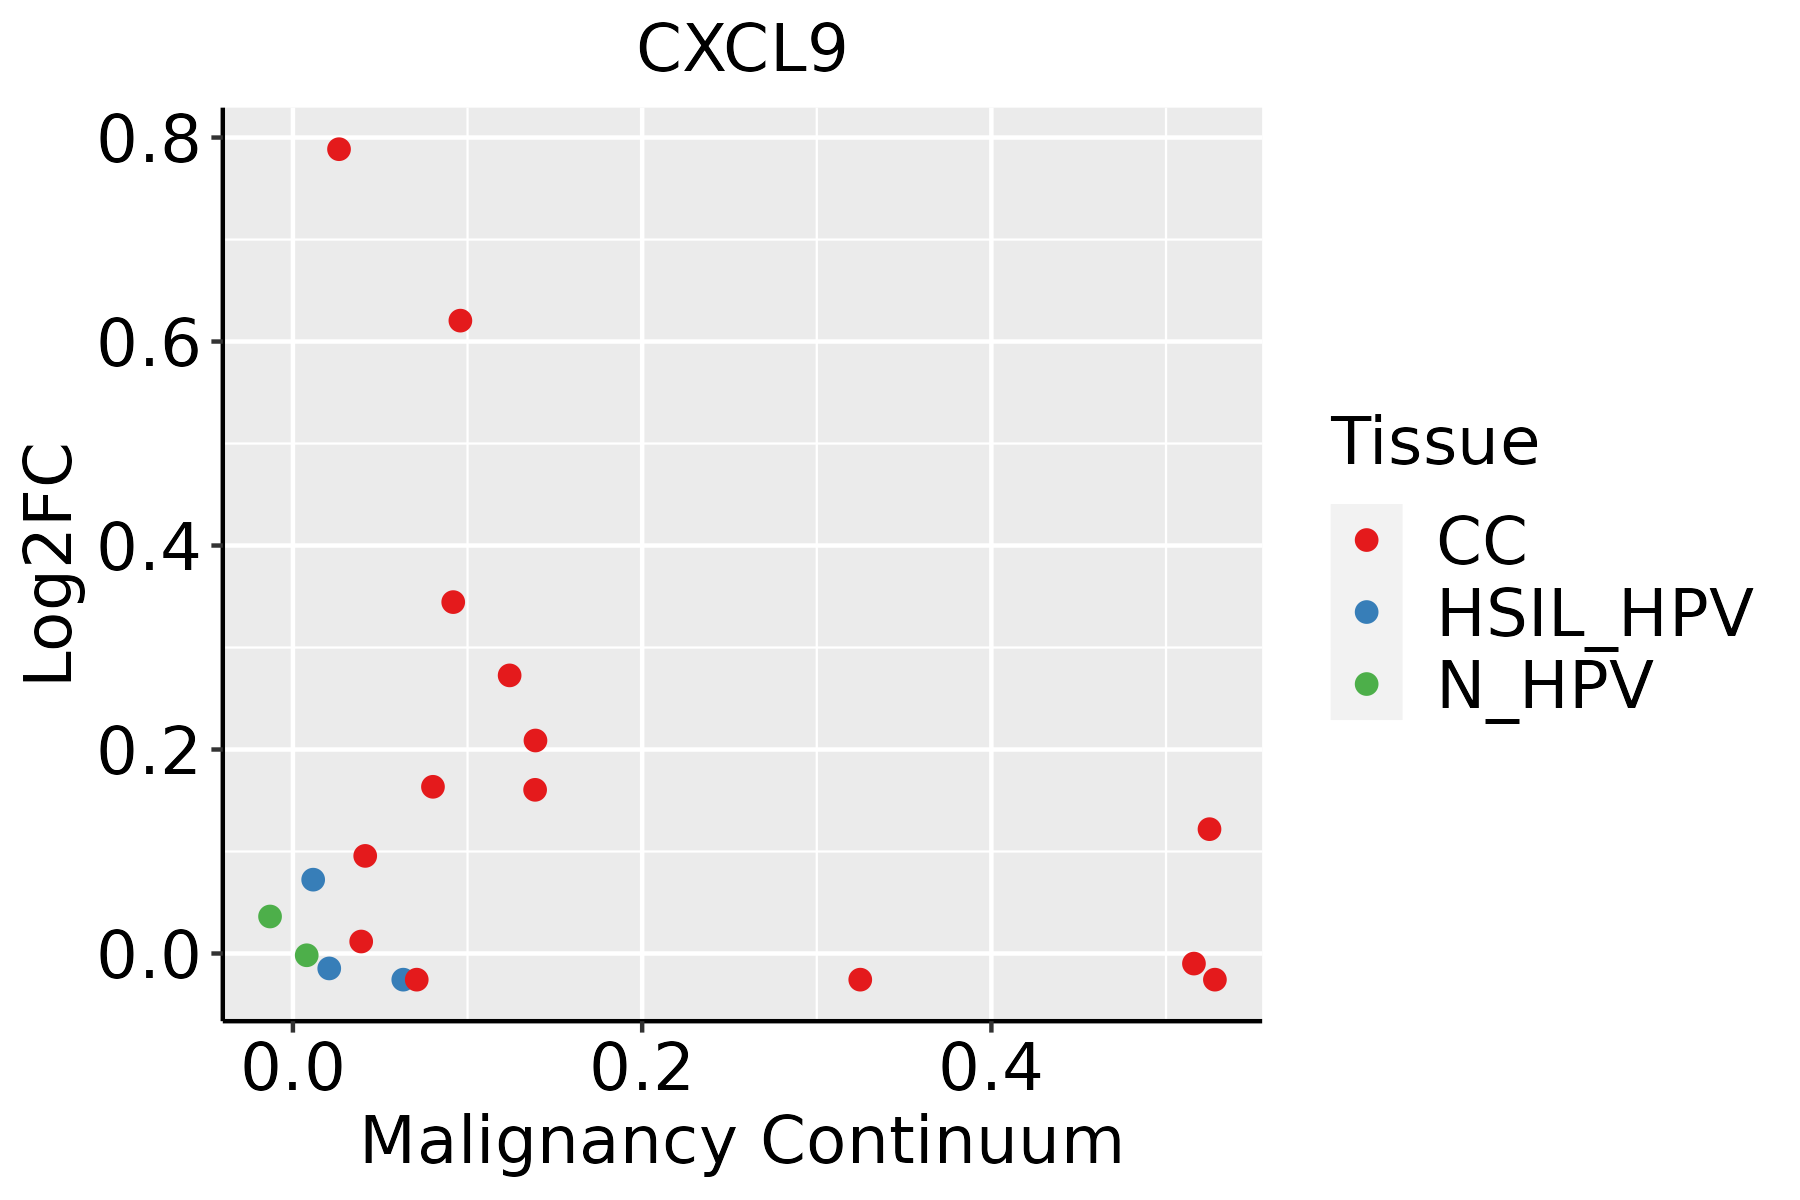 | CC: Cervix cancer |
| HSIL_HPV: HPV-infected high-grade squamous intraepithelial lesions | ||
| N_HPV: HPV-infected normal cervix | ||
| Esophagus | 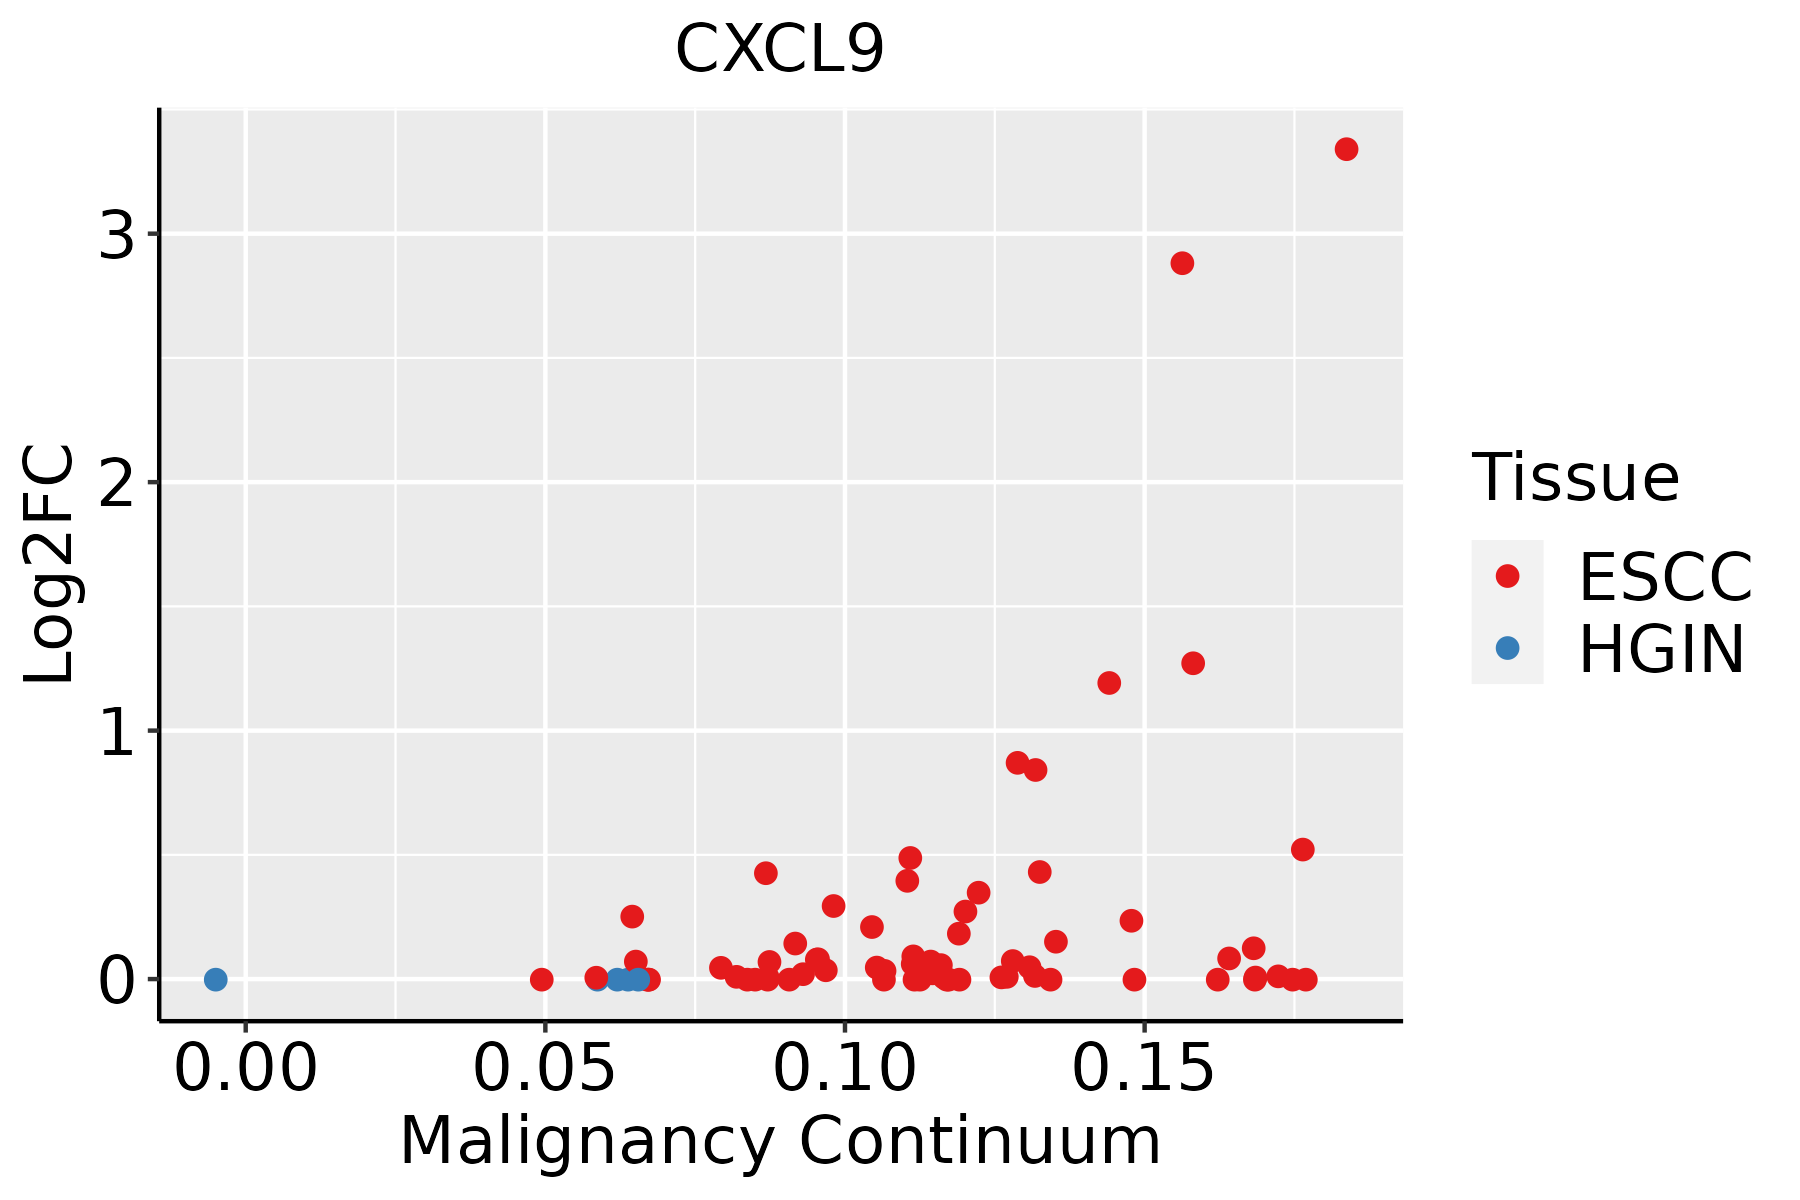 | ESCC: Esophageal squamous cell carcinoma |
| HGIN: High-grade intraepithelial neoplasias | ||
| LGIN: Low-grade intraepithelial neoplasias | ||
| Liver | 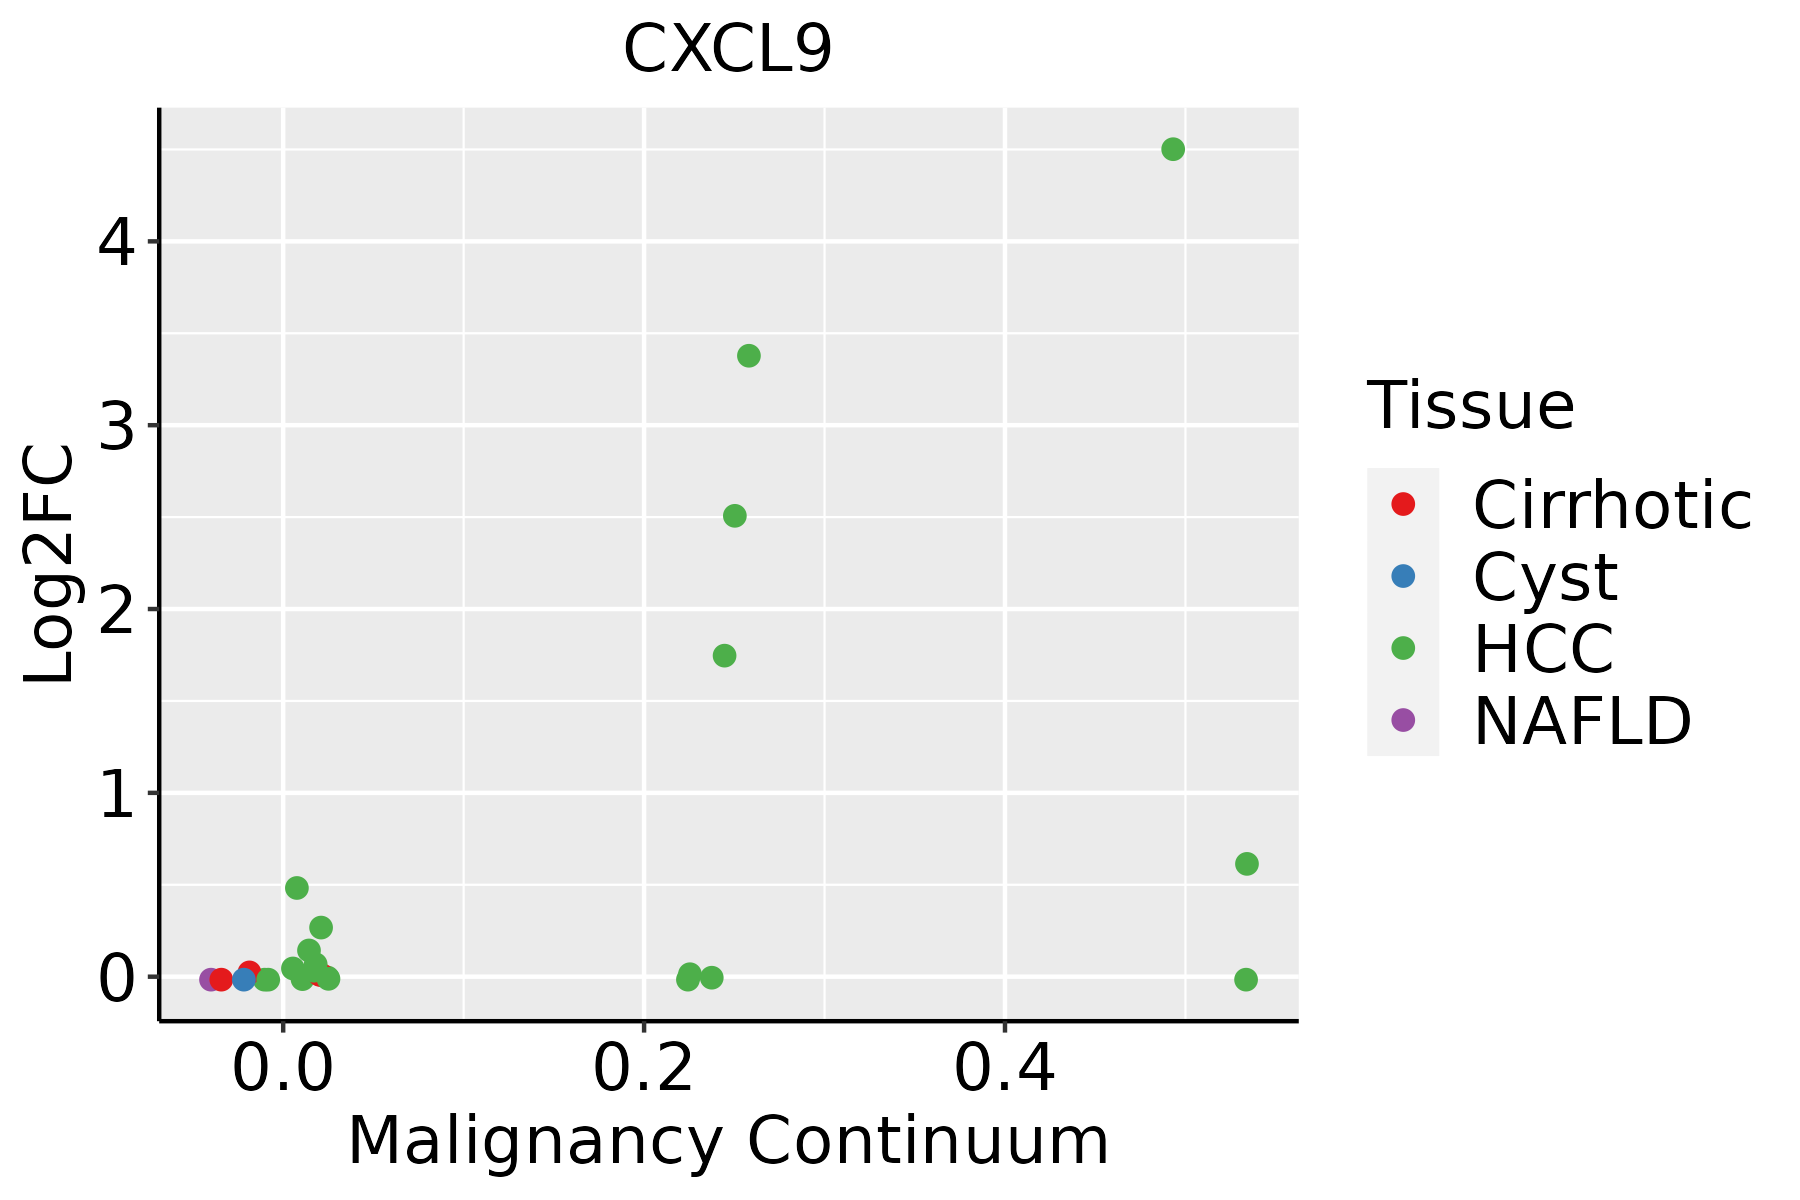 | HCC: Hepatocellular carcinoma |
| NAFLD: Non-alcoholic fatty liver disease | ||
| Oral Cavity | 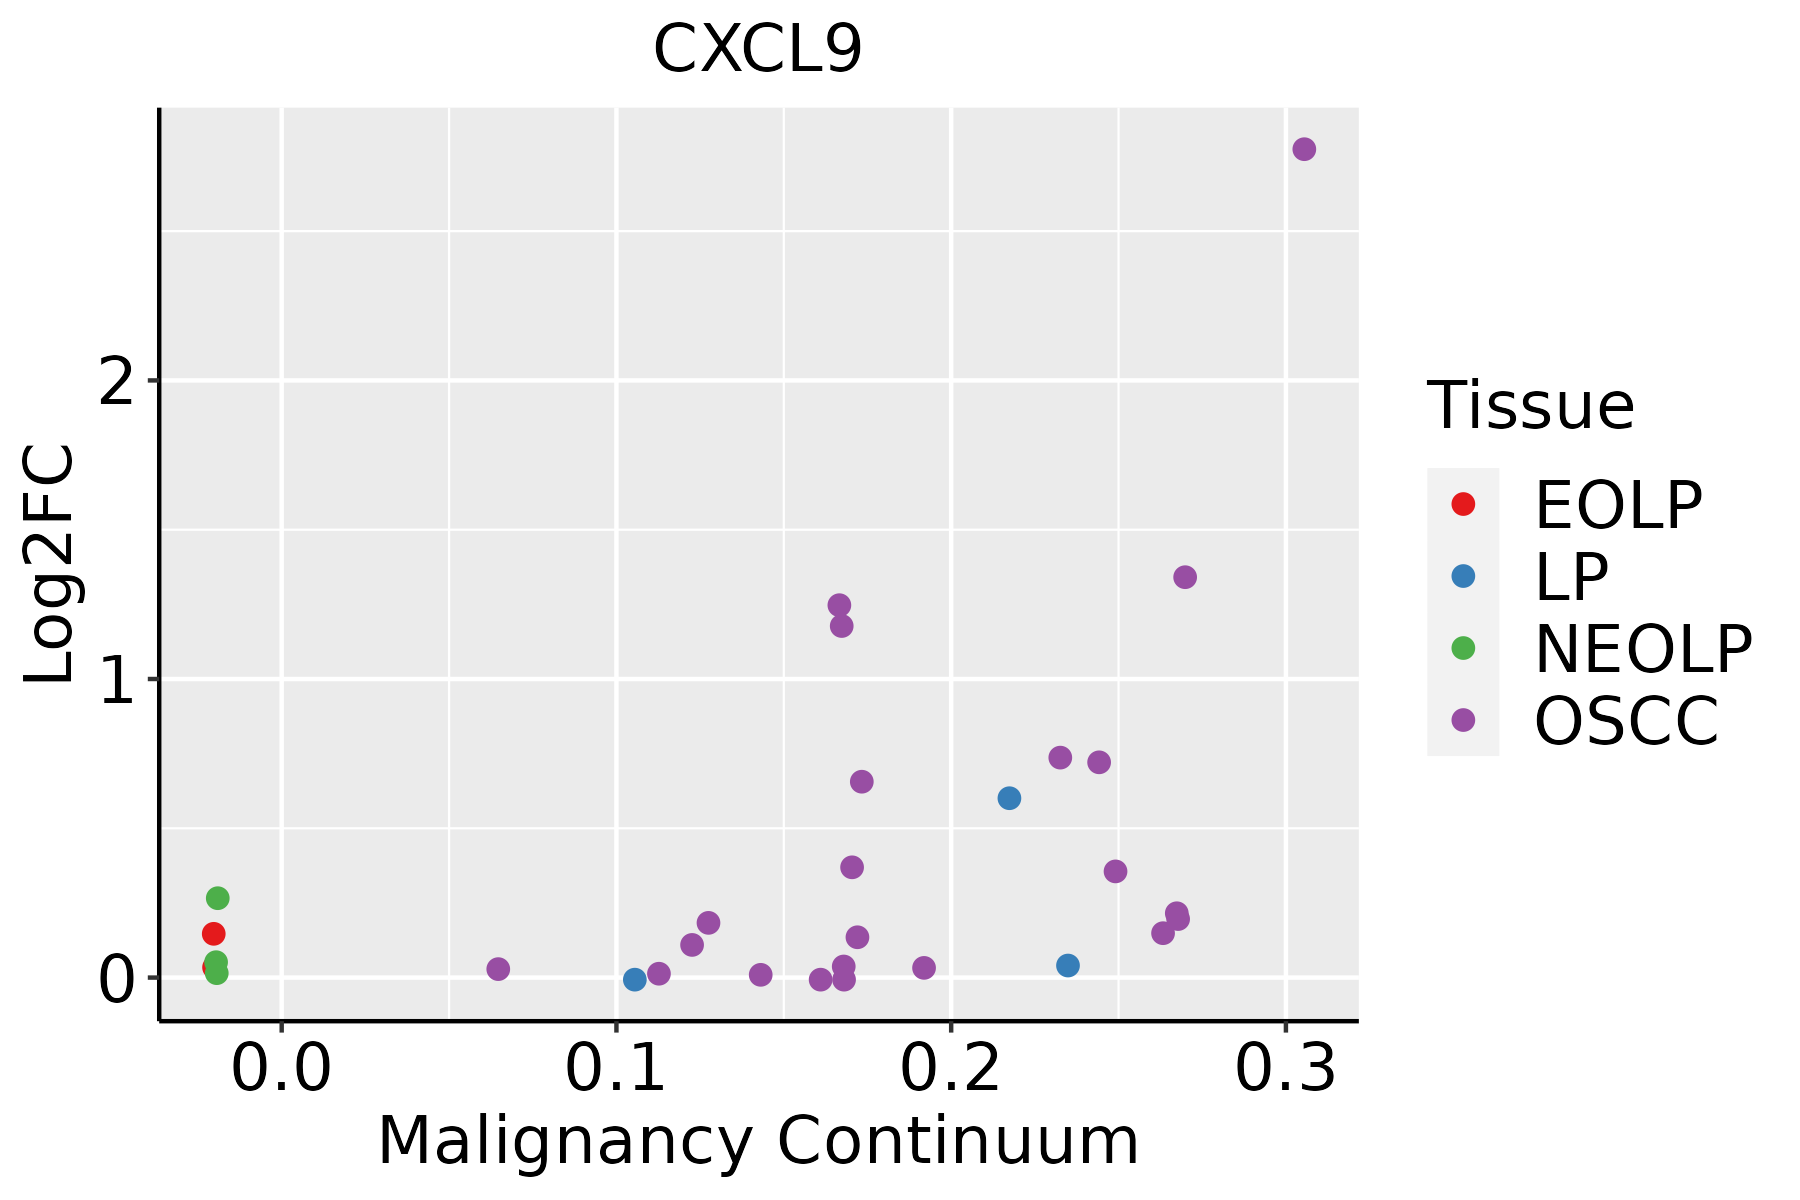 | EOLP: Erosive Oral lichen planus |
| LP: leukoplakia | ||
| NEOLP: Non-erosive oral lichen planus | ||
| OSCC: Oral squamous cell carcinoma | ||
| Skin | 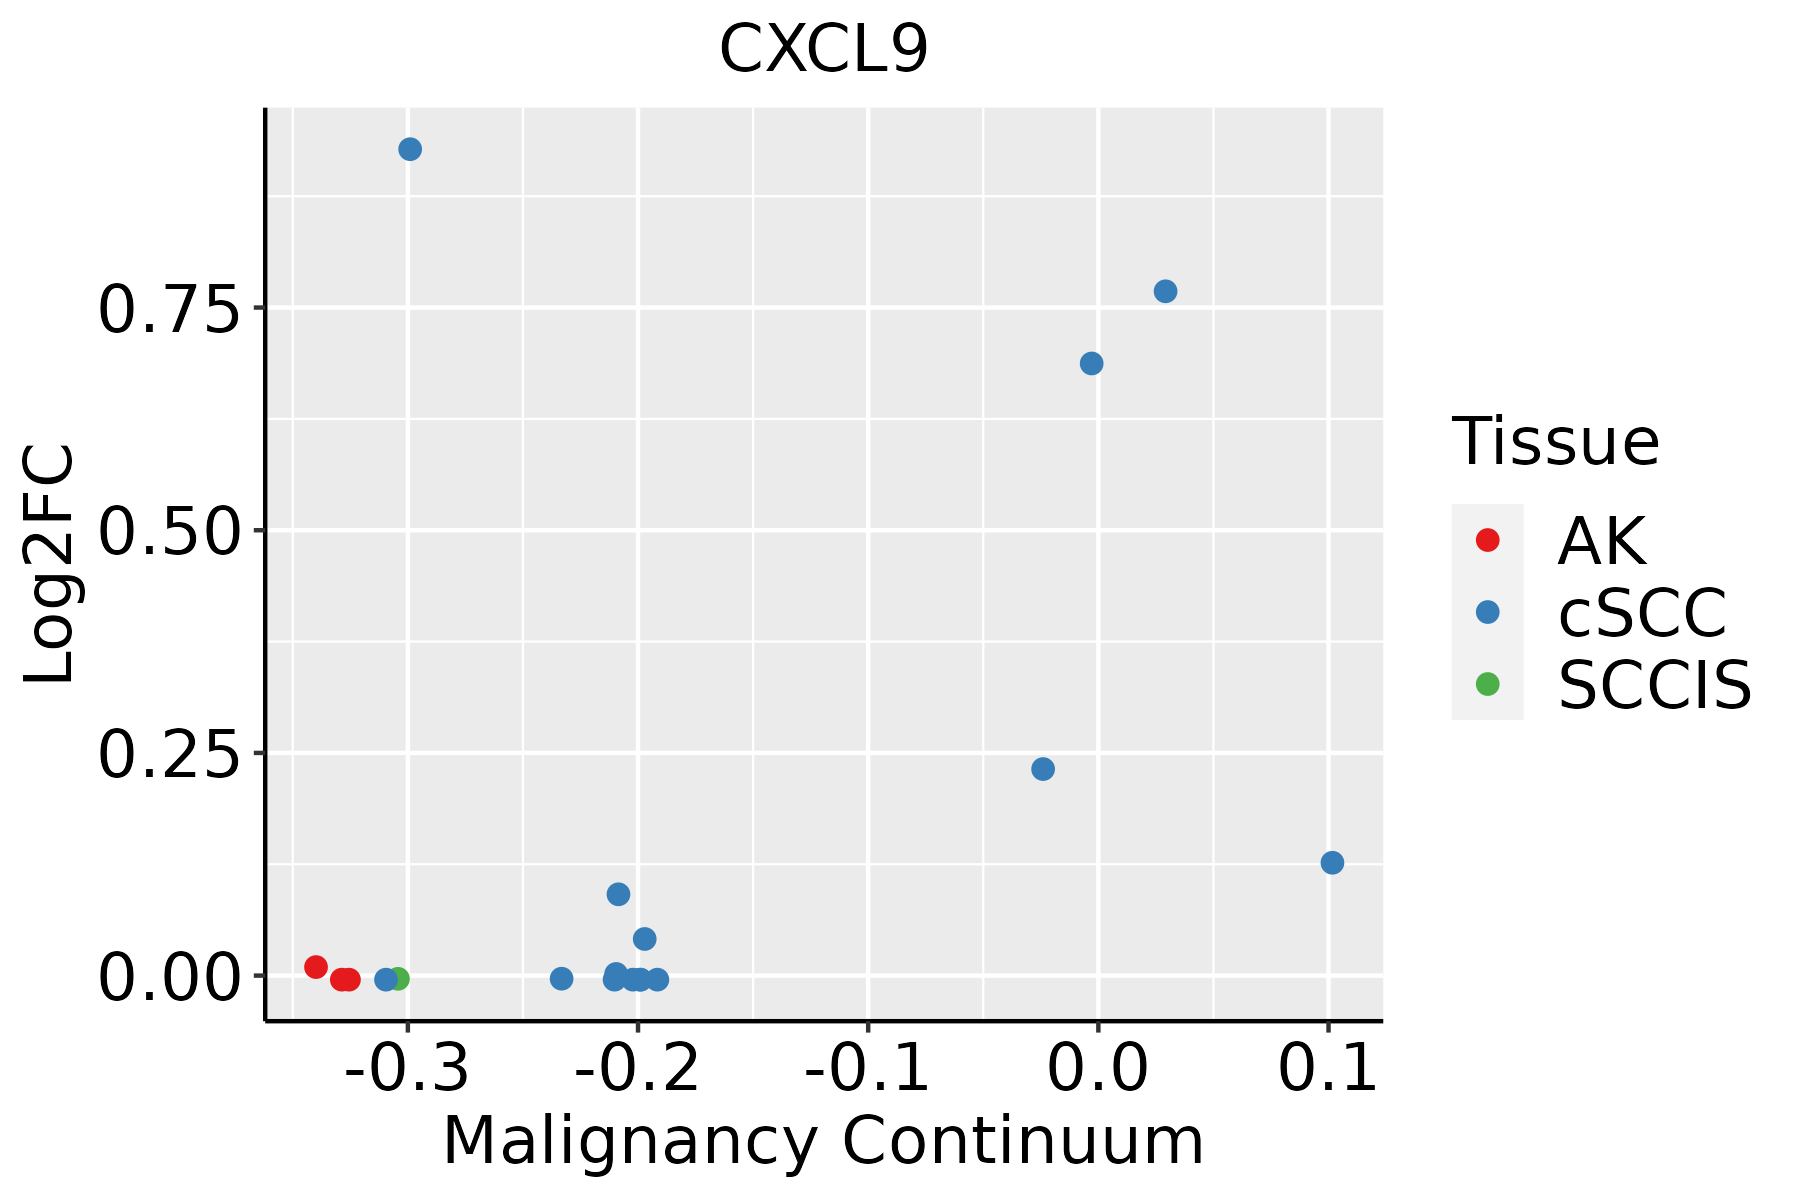 | AK: Actinic keratosis |
| cSCC: Cutaneous squamous cell carcinoma | ||
| SCCIS:squamous cell carcinoma in situ |
| ∗log2FC in expression of this searched gene in stem-like cells from each diseased tissue sample relative to stem-like cells in normal samples in each tissue plotted against the malignancy continuum. Samples are colored based on if they are from different disease stage. |
Top |
Malignant transformation related pathway analysis |
| Find out the enriched GO biological processes and KEGG pathways involved in transition from healthy to precancer to cancer |
| Tissue | Disease Stage | Enriched GO biological Processes |
| Colorectum | AD |  |
| Colorectum | SER |  |
| Colorectum | MSS |  |
| Colorectum | MSI-H |  |
| Colorectum | FAP |  |
| ∗Top 15 enriched GO BP terms are showed in the bar plot of each disease state in each tissue. Each row represents a significant GO biological process which is colored according to the -log10(p.adjust). |
| Page: 1 2 3 4 5 6 7 8 9 |
| GO ID | Tissue | Disease Stage | Description | Gene Ratio | Bg Ratio | pvalue | p.adjust | Count |
| GO:00512359 | Cervix | CC | maintenance of location | 78/2311 | 327/18723 | 5.18e-09 | 4.92e-07 | 78 |
| GO:00603267 | Cervix | CC | cell chemotaxis | 73/2311 | 310/18723 | 2.82e-08 | 1.96e-06 | 73 |
| GO:005165110 | Cervix | CC | maintenance of location in cell | 55/2311 | 214/18723 | 6.63e-08 | 3.85e-06 | 55 |
| GO:00975298 | Cervix | CC | myeloid leukocyte migration | 56/2311 | 220/18723 | 7.21e-08 | 4.15e-06 | 56 |
| GO:00305957 | Cervix | CC | leukocyte chemotaxis | 57/2311 | 230/18723 | 1.48e-07 | 7.07e-06 | 57 |
| GO:00716218 | Cervix | CC | granulocyte chemotaxis | 37/2311 | 125/18723 | 2.16e-07 | 9.56e-06 | 37 |
| GO:00022379 | Cervix | CC | response to molecule of bacterial origin | 78/2311 | 363/18723 | 5.55e-07 | 2.06e-05 | 78 |
| GO:00324969 | Cervix | CC | response to lipopolysaccharide | 74/2311 | 343/18723 | 9.15e-07 | 3.25e-05 | 74 |
| GO:00509007 | Cervix | CC | leukocyte migration | 78/2311 | 369/18723 | 1.09e-06 | 3.80e-05 | 78 |
| GO:00975308 | Cervix | CC | granulocyte migration | 39/2311 | 148/18723 | 2.67e-06 | 7.87e-05 | 39 |
| GO:00305938 | Cervix | CC | neutrophil chemotaxis | 30/2311 | 103/18723 | 4.24e-06 | 1.09e-04 | 30 |
| GO:00096158 | Cervix | CC | response to virus | 73/2311 | 367/18723 | 2.22e-05 | 3.95e-04 | 73 |
| GO:19902666 | Cervix | CC | neutrophil migration | 32/2311 | 122/18723 | 2.25e-05 | 4.00e-04 | 32 |
| GO:00192213 | Cervix | CC | cytokine-mediated signaling pathway | 84/2311 | 472/18723 | 3.25e-04 | 3.44e-03 | 84 |
| GO:00426924 | Cervix | CC | muscle cell differentiation | 69/2311 | 384/18723 | 8.12e-04 | 7.09e-03 | 69 |
| GO:0045445 | Cervix | CC | myoblast differentiation | 21/2311 | 84/18723 | 1.08e-03 | 8.94e-03 | 21 |
| GO:00712228 | Cervix | CC | cellular response to lipopolysaccharide | 41/2311 | 209/18723 | 1.69e-03 | 1.29e-02 | 41 |
| GO:00197308 | Cervix | CC | antimicrobial humoral response | 27/2311 | 122/18723 | 1.70e-03 | 1.29e-02 | 27 |
| GO:0000768 | Cervix | CC | syncytium formation by plasma membrane fusion | 15/2311 | 55/18723 | 2.14e-03 | 1.54e-02 | 15 |
| GO:0140253 | Cervix | CC | cell-cell fusion | 15/2311 | 55/18723 | 2.14e-03 | 1.54e-02 | 15 |
| Page: 1 2 3 4 5 |
| Pathway ID | Tissue | Disease Stage | Description | Gene Ratio | Bg Ratio | pvalue | p.adjust | qvalue | Count |
| hsa04062 | Cervix | CC | Chemokine signaling pathway | 43/1267 | 192/8465 | 3.60e-03 | 1.34e-02 | 7.91e-03 | 43 |
| hsa040621 | Cervix | CC | Chemokine signaling pathway | 43/1267 | 192/8465 | 3.60e-03 | 1.34e-02 | 7.91e-03 | 43 |
| hsa04620 | Oral cavity | OSCC | Toll-like receptor signaling pathway | 58/3704 | 104/8465 | 8.77e-03 | 1.98e-02 | 1.01e-02 | 58 |
| hsa046201 | Oral cavity | OSCC | Toll-like receptor signaling pathway | 58/3704 | 104/8465 | 8.77e-03 | 1.98e-02 | 1.01e-02 | 58 |
| Page: 1 |
Top |
Cell-cell communication analysis |
| Identification of potential cell-cell interactions between two cell types and their ligand-receptor pairs for different disease states |
| Ligand | Receptor | LRpair | Pathway | Tissue | Disease Stage |
| CXCL9 | ACKR1 | CXCL9_ACKR1 | CXCL | Breast | IDC |
| CXCL9 | CXCR3 | CXCL9_CXCR3 | CXCL | Breast | IDC |
| CXCL9 | ACKR1 | CXCL9_ACKR1 | CXCL | Cervix | CC |
| CXCL9 | CXCR3 | CXCL9_CXCR3 | CXCL | Cervix | CC |
| CXCL9 | ACKR1 | CXCL9_ACKR1 | CXCL | CRC | MSI-H |
| CXCL9 | ACKR1 | CXCL9_ACKR1 | CXCL | Esophagus | ESCC |
| CXCL9 | ACKR1 | CXCL9_ACKR1 | CXCL | HNSCC | OSCC |
| CXCL9 | CXCR3 | CXCL9_CXCR3 | CXCL | HNSCC | OSCC |
| CXCL9 | ACKR1 | CXCL9_ACKR1 | CXCL | HNSCC | Precancer |
| CXCL9 | CXCR3 | CXCL9_CXCR3 | CXCL | HNSCC | Precancer |
| CXCL9 | ACKR1 | CXCL9_ACKR1 | CXCL | Skin | cSCC |
| CXCL9 | CXCR3 | CXCL9_CXCR3 | CXCL | Skin | cSCC |
| CXCL9 | ACKR1 | CXCL9_ACKR1 | CXCL | THCA | Cancer |
| CXCL9 | CXCR3 | CXCL9_CXCR3 | CXCL | THCA | Cancer |
| Page: 1 |
Top |
Single-cell gene regulatory network inference analysis |
| Find out the significant the regulons (TFs) and the target genes of each regulon across cell types for different disease states |
| TF | Cell Type | Tissue | Disease Stage | Target Gene | RSS | Regulon Activity |
| ∗The dot plots of a searched regulon are shown for all cell subpopulations in each disease state of each tissue based on the regulon specific score inferred using pySCENIC and by calculating the average expression. |
| Page: 1 |
Top |
Somatic mutation of malignant transformation related genes |
| Annotation of somatic variants for genes involved in malignant transformation |
| Hugo Symbol | Variant Class | Variant Classification | dbSNP RS | HGVSc | HGVSp | HGVSp Short | SWISSPROT | BIOTYPE | SIFT | PolyPhen | Tumor Sample Barcode | Tissue | Histology | Sex | Age | Stage | Therapy Types | Drugs | Outcome |
| CXCL9 | SNV | Missense_Mutation | rs751666778 | c.109A>G | p.Asn37Asp | p.N37D | Q07325 | protein_coding | tolerated(0.07) | benign(0.089) | TCGA-2W-A8YY-01 | Cervix | cervical & endocervical cancer | Female | <65 | I/II | Chemotherapy | cisplatin | CR |
| CXCL9 | SNV | Missense_Mutation | c.356C>G | p.Ser119Cys | p.S119C | Q07325 | protein_coding | deleterious(0.02) | benign(0.078) | TCGA-MY-A5BD-01 | Cervix | cervical & endocervical cancer | Female | <65 | I/II | Chemotherapy | cisplatin | CR | |
| CXCL9 | SNV | Missense_Mutation | rs764068063 | c.353N>A | p.Arg118His | p.R118H | Q07325 | protein_coding | tolerated(0.36) | benign(0.003) | TCGA-AY-6197-01 | Colorectum | colon adenocarcinoma | Male | <65 | I/II | Unknown | Unknown | SD |
| CXCL9 | SNV | Missense_Mutation | c.232N>T | p.Asp78Tyr | p.D78Y | Q07325 | protein_coding | deleterious(0) | probably_damaging(0.993) | TCGA-AP-A0LM-01 | Endometrium | uterine corpus endometrioid carcinoma | Female | <65 | III/IV | Chemotherapy | cisplatin | SD | |
| CXCL9 | SNV | Missense_Mutation | novel | c.300G>T | p.Lys100Asn | p.K100N | Q07325 | protein_coding | deleterious(0.01) | benign(0.042) | TCGA-B5-A1MR-01 | Endometrium | uterine corpus endometrioid carcinoma | Female | >=65 | III/IV | Unknown | Unknown | SD |
| CXCL9 | SNV | Missense_Mutation | novel | c.204G>T | p.Lys68Asn | p.K68N | Q07325 | protein_coding | deleterious(0) | probably_damaging(0.998) | TCGA-B5-A1MR-01 | Endometrium | uterine corpus endometrioid carcinoma | Female | >=65 | III/IV | Unknown | Unknown | SD |
| CXCL9 | SNV | Missense_Mutation | rs764068063 | c.353G>A | p.Arg118His | p.R118H | Q07325 | protein_coding | tolerated(0.36) | benign(0.003) | TCGA-B5-A3FC-01 | Endometrium | uterine corpus endometrioid carcinoma | Female | <65 | I/II | Unknown | Unknown | SD |
| CXCL9 | SNV | Missense_Mutation | c.270G>T | p.Glu90Asp | p.E90D | Q07325 | protein_coding | tolerated(0.06) | benign(0.321) | TCGA-D1-A17Q-01 | Endometrium | uterine corpus endometrioid carcinoma | Female | <65 | I/II | Unknown | Unknown | SD | |
| CXCL9 | SNV | Missense_Mutation | novel | c.177G>T | p.Glu59Asp | p.E59D | Q07325 | protein_coding | tolerated(0.42) | benign(0.089) | TCGA-E6-A1LX-01 | Endometrium | uterine corpus endometrioid carcinoma | Female | <65 | I/II | Unknown | Unknown | SD |
| CXCL9 | SNV | Missense_Mutation | novel | c.19N>A | p.Leu7Ile | p.L7I | Q07325 | protein_coding | tolerated(0.46) | benign(0.069) | TCGA-EO-A3AY-01 | Endometrium | uterine corpus endometrioid carcinoma | Female | <65 | I/II | Unknown | Unknown | PD |
| Page: 1 2 |
Top |
Related drugs of malignant transformation related genes |
| Identification of chemicals and drugs interact with genes involved in malignant transfromation |
| (DGIdb 4.0) |
| Entrez ID | Symbol | Category | Interaction Types | Drug Claim Name | Drug Name | PMIDs |
| Page: 1 |

Copyright 2023-Present -The University of Texas Health Science Center at Houston |