
|
|||||
|
 | |
| |
| |
| |
| |
| |
|
Gene: CXCL8 |
Gene summary for CXCL8 |
| Gene information | Species | Human | Gene symbol | CXCL8 | Gene ID | 3576 |
| Gene name | C-X-C motif chemokine ligand 8 | |
| Gene Alias | GCP-1 | |
| Cytomap | 4q13.3 | |
| Gene Type | protein-coding | GO ID | GO:0001525 | UniProtAcc | A0A024RDA5 |
Top |
Malignant transformation analysis |
| Identification of the aberrant gene expression in precancerous and cancerous lesions by comparing the gene expression of stem-like cells in diseased tissues with normal stem cells |
| Entrez ID | Symbol | Replicates | Species | Organ | Tissue | Adj P-value | Log2FC | Malignancy |
| 3576 | CXCL8 | GSM4909281 | Human | Breast | IDC | 4.35e-36 | -9.85e-01 | 0.21 |
| 3576 | CXCL8 | GSM4909282 | Human | Breast | IDC | 9.02e-30 | -9.44e-01 | -0.0288 |
| 3576 | CXCL8 | GSM4909285 | Human | Breast | IDC | 4.92e-34 | -9.88e-01 | 0.21 |
| 3576 | CXCL8 | GSM4909286 | Human | Breast | IDC | 5.36e-41 | -1.00e+00 | 0.1081 |
| 3576 | CXCL8 | GSM4909287 | Human | Breast | IDC | 1.65e-31 | -9.65e-01 | 0.2057 |
| 3576 | CXCL8 | GSM4909288 | Human | Breast | IDC | 3.02e-06 | -8.61e-01 | 0.0988 |
| 3576 | CXCL8 | GSM4909289 | Human | Breast | IDC | 2.44e-06 | -9.72e-01 | 0.1064 |
| 3576 | CXCL8 | GSM4909290 | Human | Breast | IDC | 5.48e-13 | -8.04e-01 | 0.2096 |
| 3576 | CXCL8 | GSM4909291 | Human | Breast | IDC | 2.33e-15 | -9.22e-01 | 0.1753 |
| 3576 | CXCL8 | GSM4909292 | Human | Breast | IDC | 6.65e-05 | -1.00e+00 | 0.1236 |
| 3576 | CXCL8 | GSM4909293 | Human | Breast | IDC | 4.03e-30 | -9.48e-01 | 0.1581 |
| 3576 | CXCL8 | GSM4909294 | Human | Breast | IDC | 5.36e-41 | -9.89e-01 | 0.2022 |
| 3576 | CXCL8 | GSM4909295 | Human | Breast | IDC | 4.00e-09 | -8.41e-01 | 0.0898 |
| 3576 | CXCL8 | GSM4909296 | Human | Breast | IDC | 2.62e-37 | -9.96e-01 | 0.1524 |
| 3576 | CXCL8 | GSM4909297 | Human | Breast | IDC | 5.68e-22 | -8.24e-01 | 0.1517 |
| 3576 | CXCL8 | GSM4909298 | Human | Breast | IDC | 1.98e-41 | -9.98e-01 | 0.1551 |
| 3576 | CXCL8 | GSM4909299 | Human | Breast | IDC | 5.58e-29 | -9.35e-01 | 0.035 |
| 3576 | CXCL8 | GSM4909300 | Human | Breast | IDC | 1.18e-02 | -6.48e-01 | 0.0334 |
| 3576 | CXCL8 | GSM4909301 | Human | Breast | IDC | 1.98e-41 | -1.00e+00 | 0.1577 |
| 3576 | CXCL8 | GSM4909302 | Human | Breast | IDC | 7.75e-35 | -9.89e-01 | 0.1545 |
| Page: 1 2 3 4 5 6 7 8 9 10 11 12 13 |
| Tissue | Expression Dynamics | Abbreviation |
| Breast |  | IDC: Invasive ductal carcinoma |
| DCIS: Ductal carcinoma in situ | ||
| Precancer(BRCA1-mut): Precancerous lesion from BRCA1 mutation carriers | ||
| Cervix | 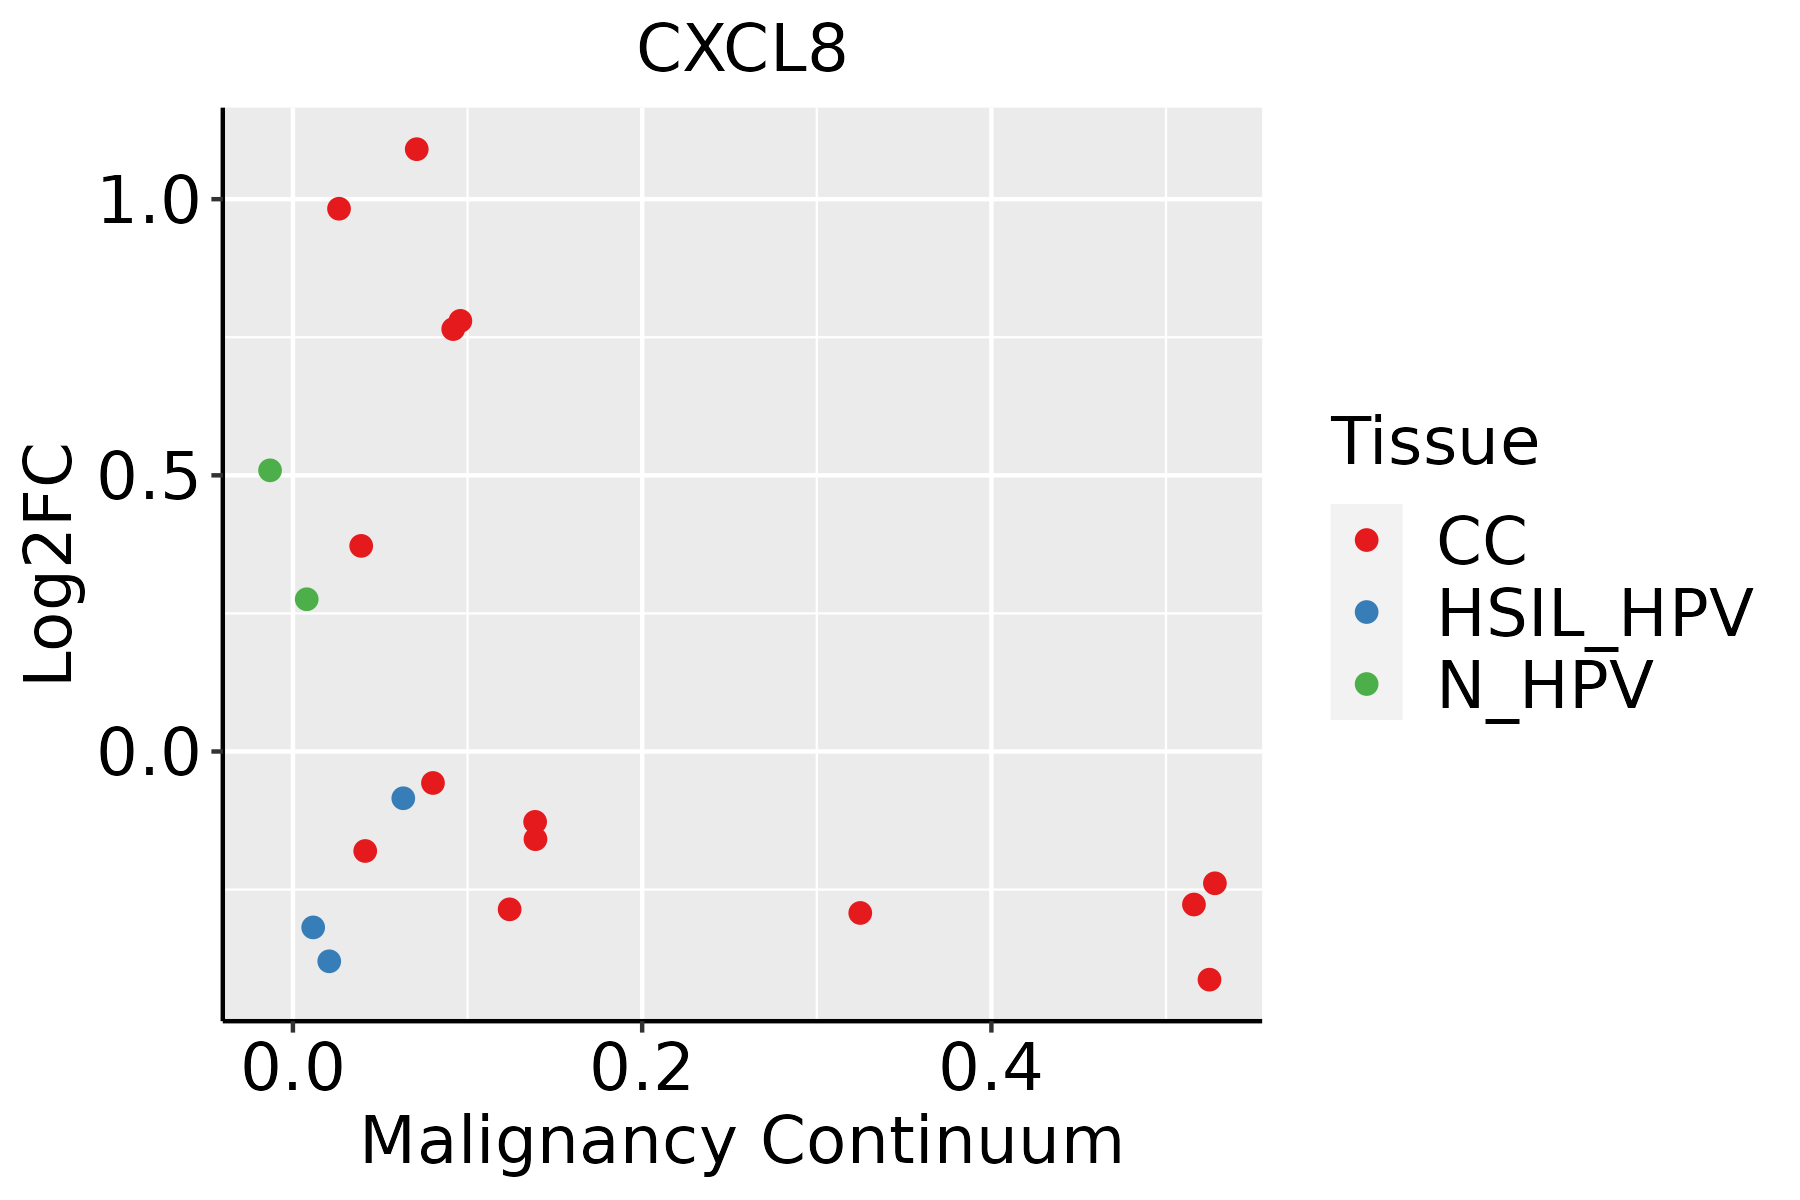 | CC: Cervix cancer |
| HSIL_HPV: HPV-infected high-grade squamous intraepithelial lesions | ||
| N_HPV: HPV-infected normal cervix | ||
| Endometrium | 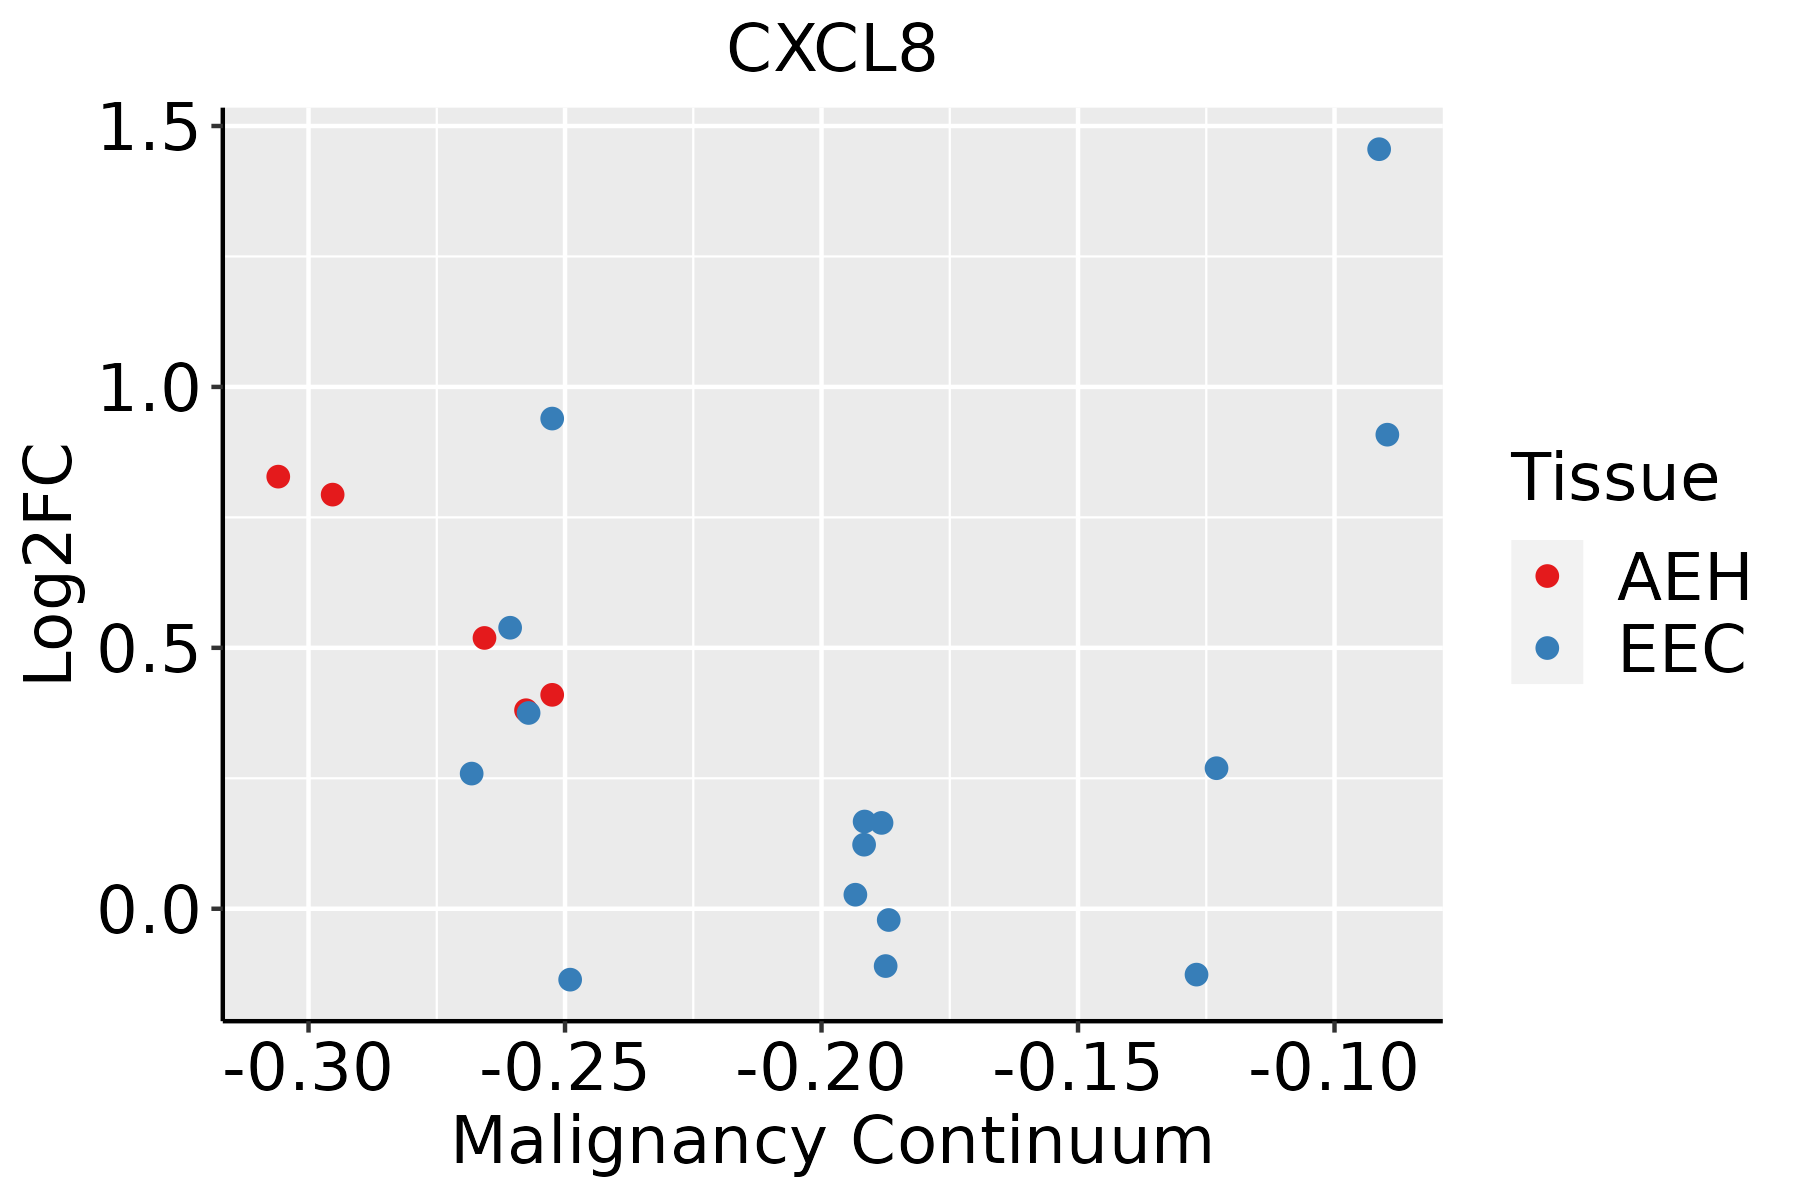 | AEH: Atypical endometrial hyperplasia |
| EEC: Endometrioid Cancer | ||
| Esophagus |  | ESCC: Esophageal squamous cell carcinoma |
| HGIN: High-grade intraepithelial neoplasias | ||
| LGIN: Low-grade intraepithelial neoplasias | ||
| GC | 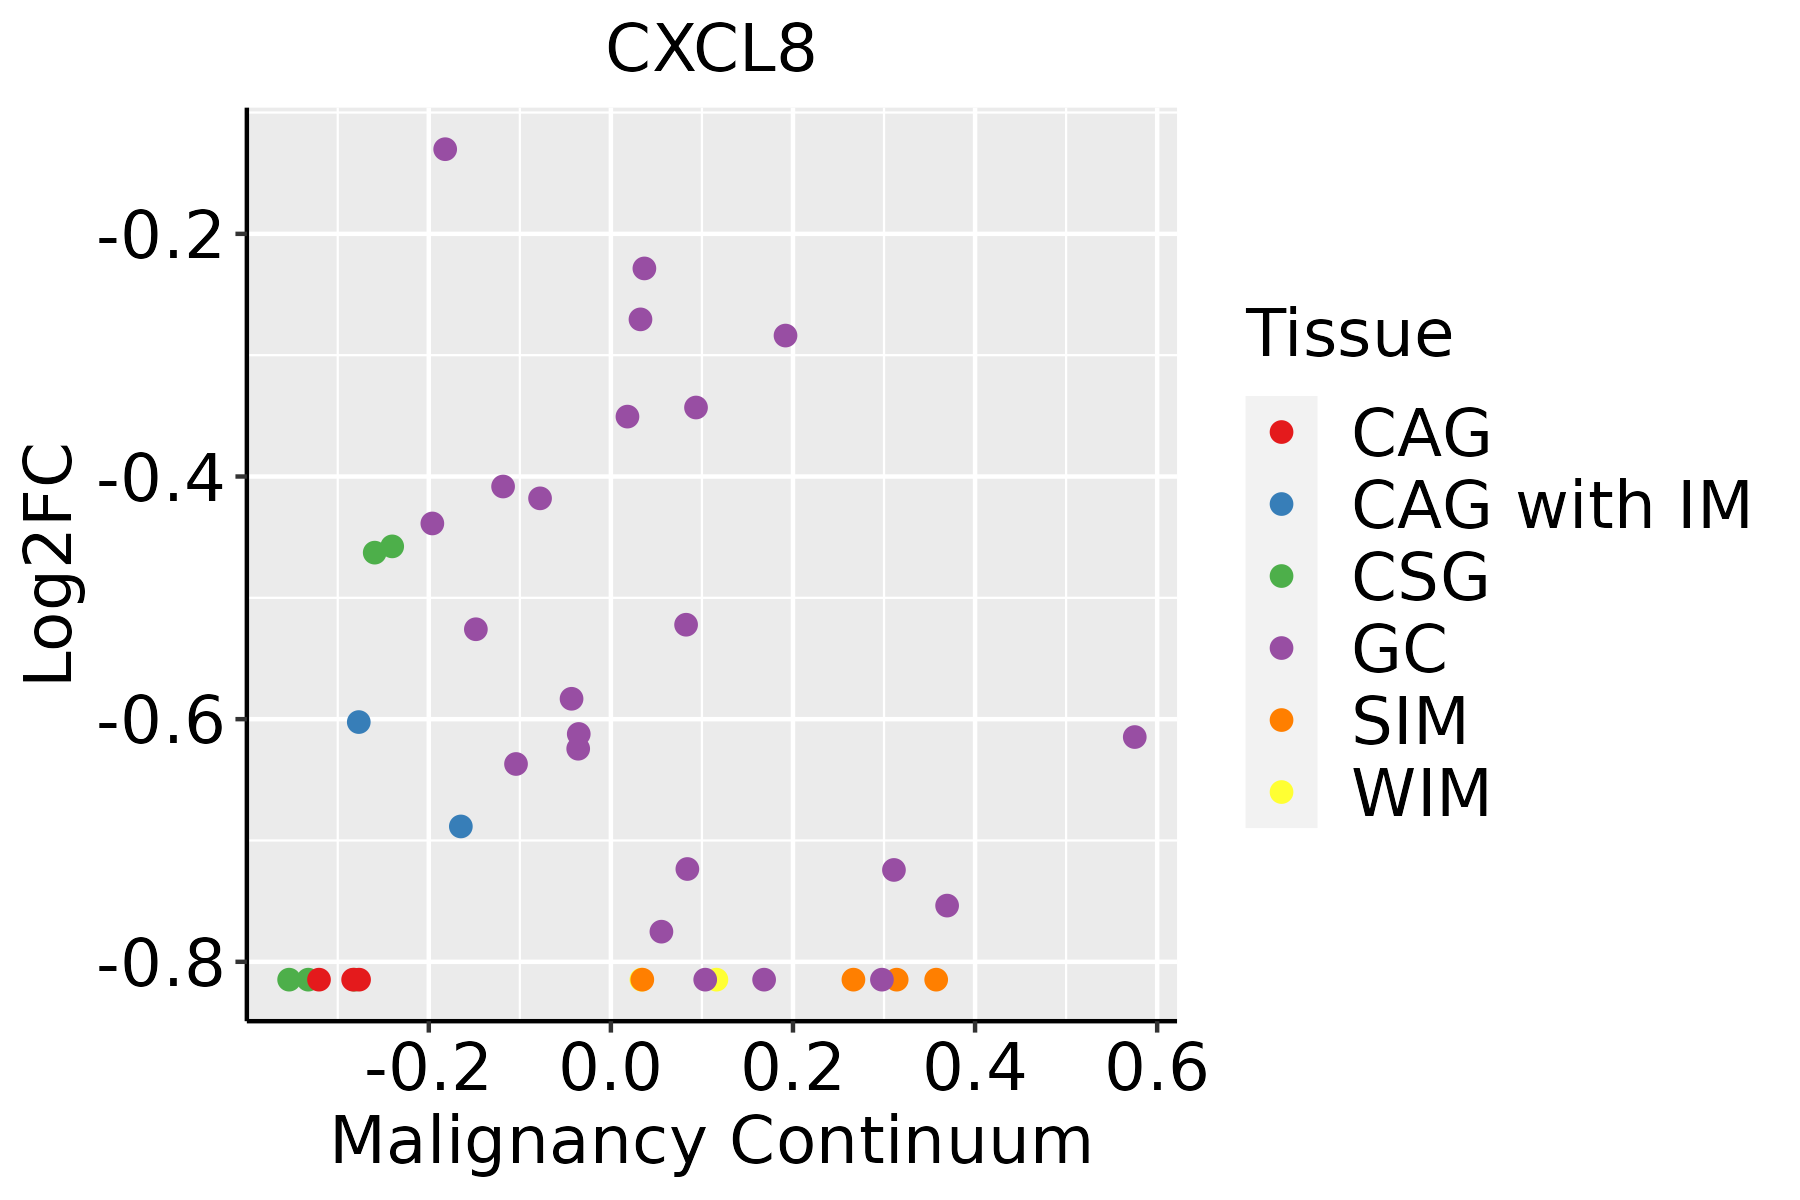 | CAG: Chronic atrophic gastritis |
| CAG with IM: Chronic atrophic gastritis with intestinal metaplasia | ||
| CSG: Chronic superficial gastritis | ||
| GC: Gastric cancer | ||
| SIM: Severe intestinal metaplasia | ||
| WIM: Wild intestinal metaplasia | ||
| Liver |  | HCC: Hepatocellular carcinoma |
| NAFLD: Non-alcoholic fatty liver disease | ||
| Lung | 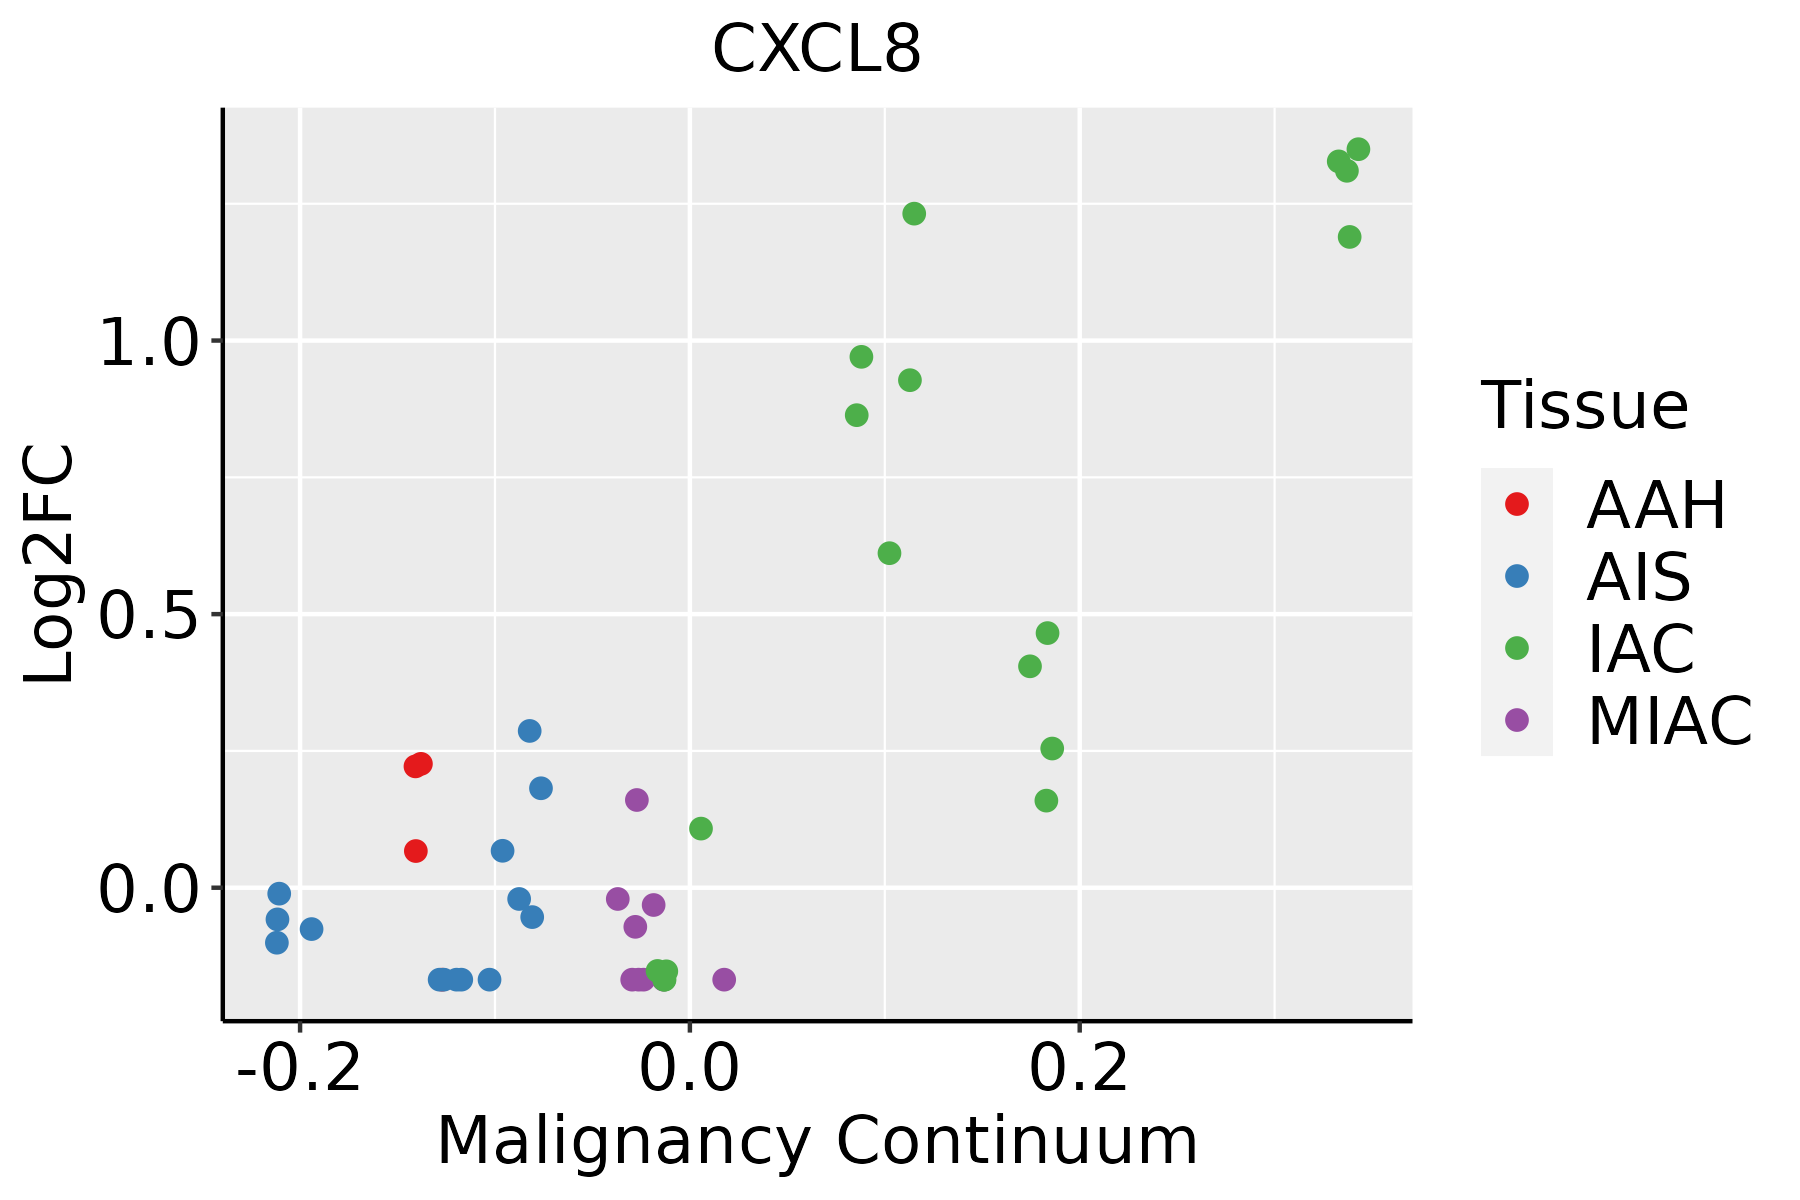 | AAH: Atypical adenomatous hyperplasia |
| AIS: Adenocarcinoma in situ | ||
| IAC: Invasive lung adenocarcinoma | ||
| MIA: Minimally invasive adenocarcinoma | ||
| Oral Cavity |  | EOLP: Erosive Oral lichen planus |
| LP: leukoplakia | ||
| NEOLP: Non-erosive oral lichen planus | ||
| OSCC: Oral squamous cell carcinoma | ||
| Prostate | 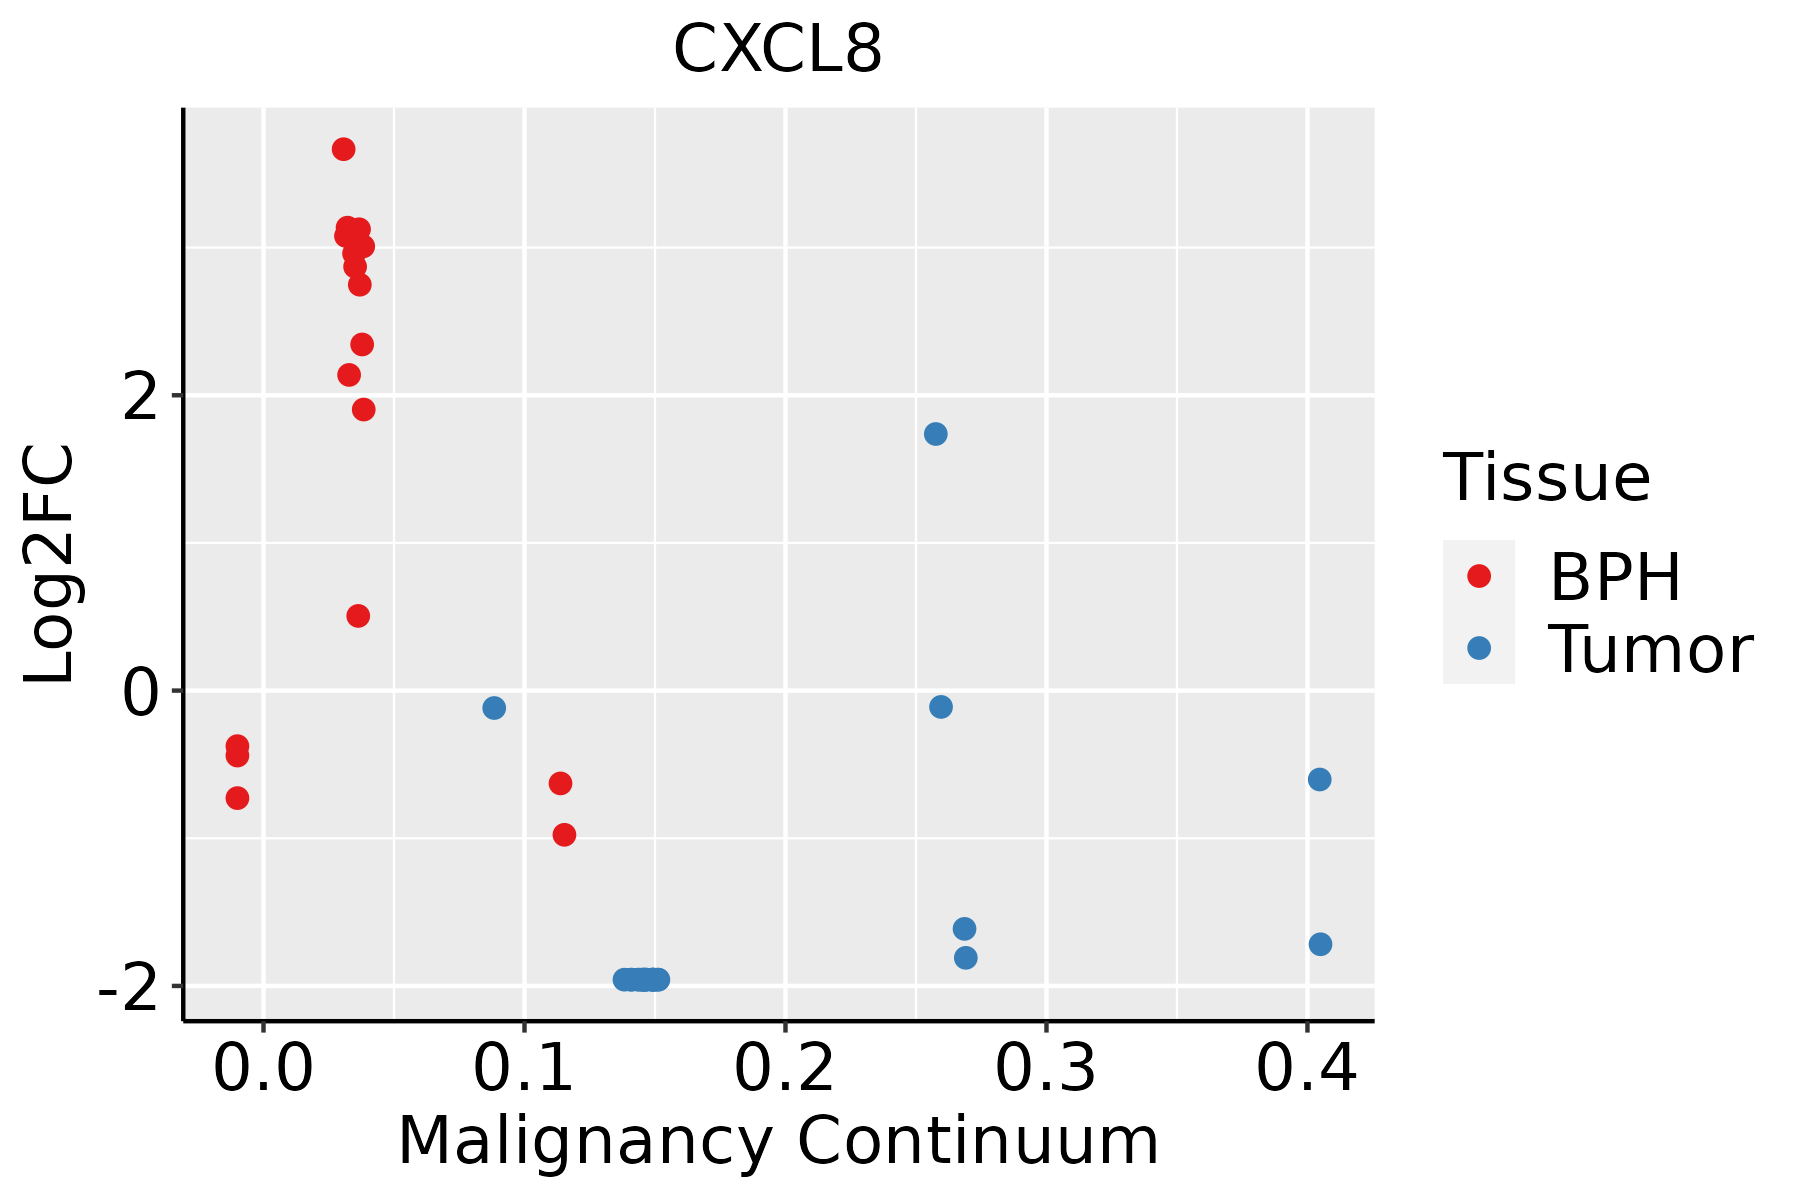 | BPH: Benign Prostatic Hyperplasia |
| Thyroid | 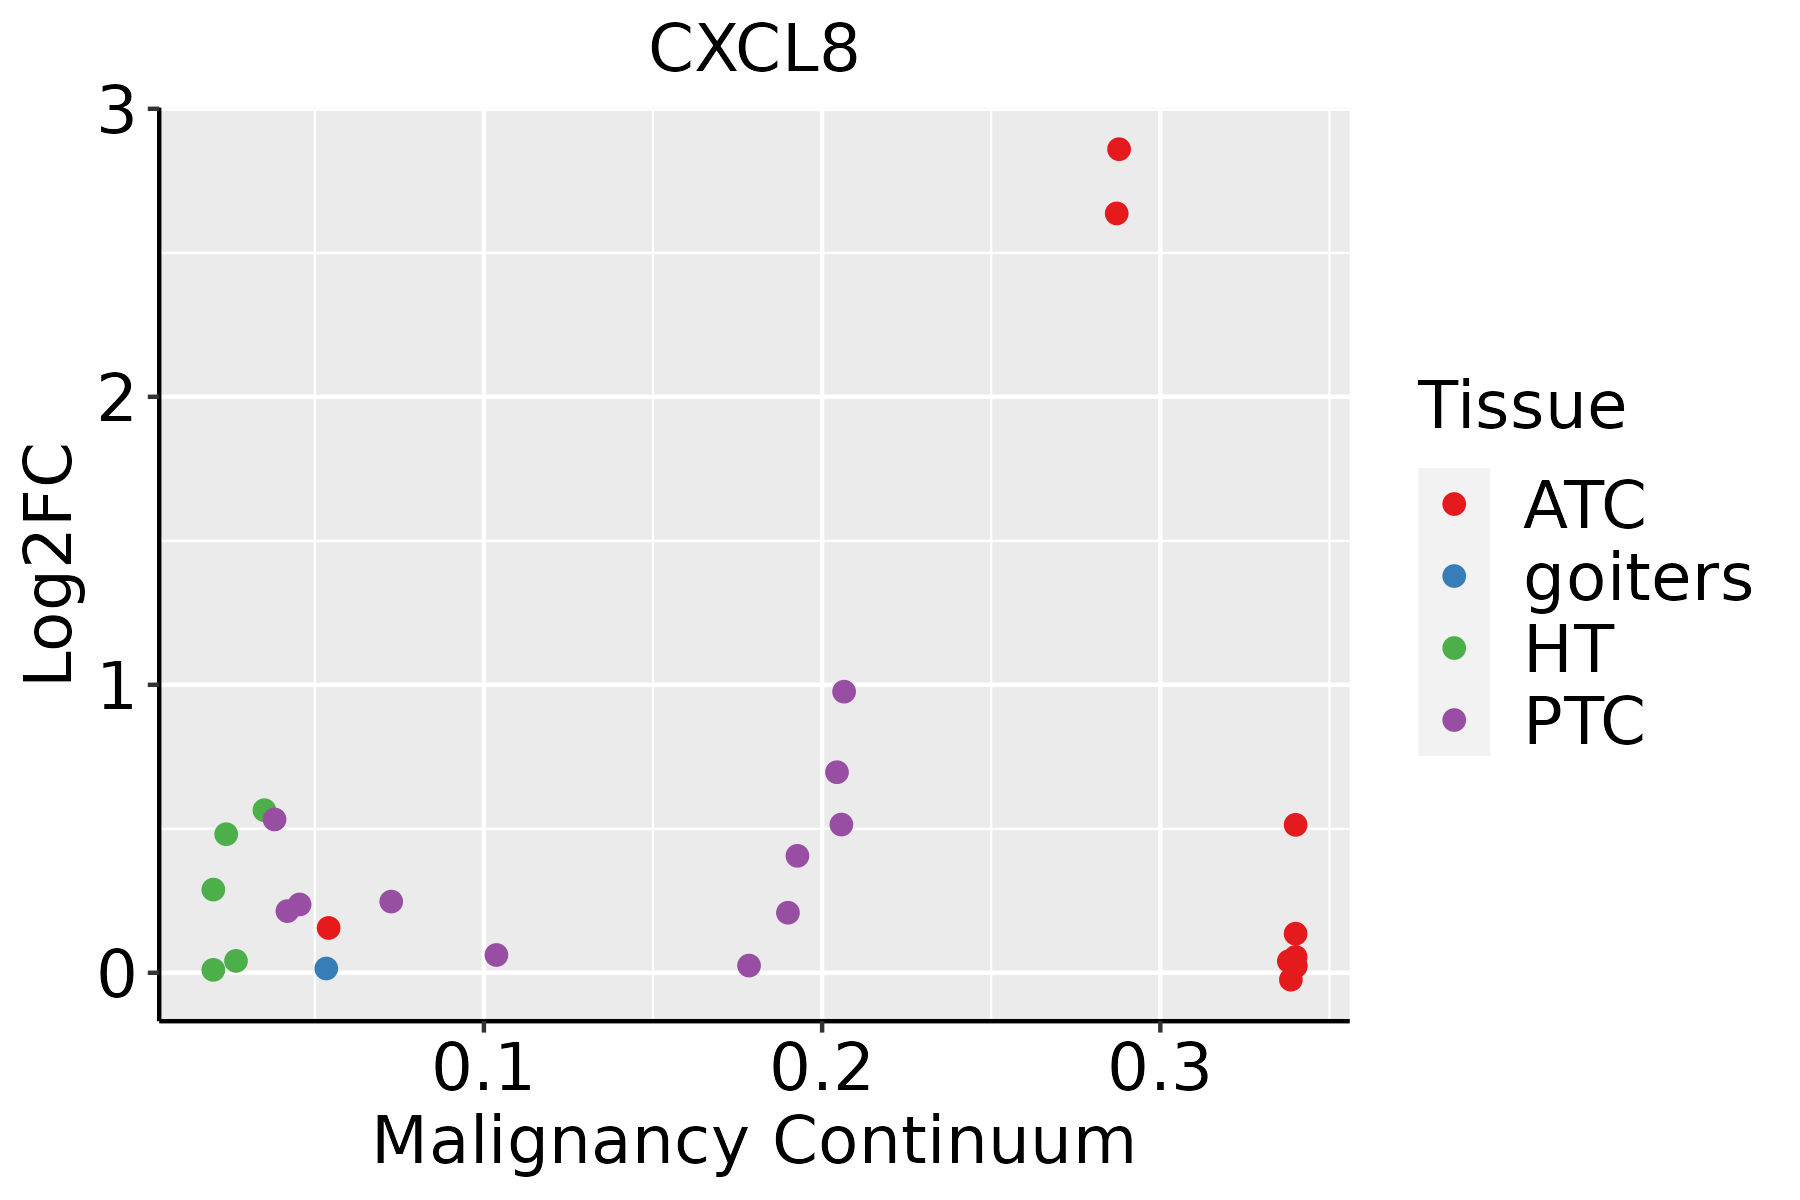 | ATC: Anaplastic thyroid cancer |
| HT: Hashimoto's thyroiditis | ||
| PTC: Papillary thyroid cancer |
| ∗log2FC in expression of this searched gene in stem-like cells from each diseased tissue sample relative to stem-like cells in normal samples in each tissue plotted against the malignancy continuum. Samples are colored based on if they are from different disease stage. |
Top |
Malignant transformation related pathway analysis |
| Find out the enriched GO biological processes and KEGG pathways involved in transition from healthy to precancer to cancer |
| Tissue | Disease Stage | Enriched GO biological Processes |
| Colorectum | AD |  |
| Colorectum | SER |  |
| Colorectum | MSS |  |
| Colorectum | MSI-H |  |
| Colorectum | FAP |  |
| ∗Top 15 enriched GO BP terms are showed in the bar plot of each disease state in each tissue. Each row represents a significant GO biological process which is colored according to the -log10(p.adjust). |
| Page: 1 2 3 4 5 6 7 8 9 |
| GO ID | Tissue | Disease Stage | Description | Gene Ratio | Bg Ratio | pvalue | p.adjust | Count |
| GO:00160329 | Breast | Precancer | viral process | 58/1080 | 415/18723 | 3.42e-10 | 3.16e-08 | 58 |
| GO:00190589 | Breast | Precancer | viral life cycle | 47/1080 | 317/18723 | 2.42e-09 | 1.99e-07 | 47 |
| GO:00444039 | Breast | Precancer | biological process involved in symbiotic interaction | 42/1080 | 290/18723 | 3.40e-08 | 2.11e-06 | 42 |
| GO:00349769 | Breast | Precancer | response to endoplasmic reticulum stress | 38/1080 | 256/18723 | 7.89e-08 | 4.60e-06 | 38 |
| GO:00975297 | Breast | Precancer | myeloid leukocyte migration | 34/1080 | 220/18723 | 1.42e-07 | 7.82e-06 | 34 |
| GO:00521269 | Breast | Precancer | movement in host environment | 29/1080 | 175/18723 | 2.59e-07 | 1.28e-05 | 29 |
| GO:00509006 | Breast | Precancer | leukocyte migration | 47/1080 | 369/18723 | 2.82e-07 | 1.39e-05 | 47 |
| GO:00305956 | Breast | Precancer | leukocyte chemotaxis | 34/1080 | 230/18723 | 4.16e-07 | 1.89e-05 | 34 |
| GO:00603266 | Breast | Precancer | cell chemotaxis | 41/1080 | 310/18723 | 5.99e-07 | 2.55e-05 | 41 |
| GO:00517019 | Breast | Precancer | biological process involved in interaction with host | 31/1080 | 203/18723 | 6.52e-07 | 2.71e-05 | 31 |
| GO:00716217 | Breast | Precancer | granulocyte chemotaxis | 23/1080 | 125/18723 | 6.73e-07 | 2.77e-05 | 23 |
| GO:00507929 | Breast | Precancer | regulation of viral process | 27/1080 | 164/18723 | 7.59e-07 | 3.05e-05 | 27 |
| GO:00444099 | Breast | Precancer | entry into host | 25/1080 | 151/18723 | 1.74e-06 | 6.19e-05 | 25 |
| GO:00975307 | Breast | Precancer | granulocyte migration | 24/1080 | 148/18723 | 4.04e-06 | 1.26e-04 | 24 |
| GO:00190799 | Breast | Precancer | viral genome replication | 22/1080 | 131/18723 | 5.63e-06 | 1.66e-04 | 22 |
| GO:00305937 | Breast | Precancer | neutrophil chemotaxis | 19/1080 | 103/18723 | 5.94e-06 | 1.71e-04 | 19 |
| GO:00022378 | Breast | Precancer | response to molecule of bacterial origin | 43/1080 | 363/18723 | 6.05e-06 | 1.72e-04 | 43 |
| GO:00324968 | Breast | Precancer | response to lipopolysaccharide | 41/1080 | 343/18723 | 7.94e-06 | 2.17e-04 | 41 |
| GO:00439039 | Breast | Precancer | regulation of biological process involved in symbiotic interaction | 15/1080 | 72/18723 | 1.23e-05 | 3.17e-04 | 15 |
| GO:19039009 | Breast | Precancer | regulation of viral life cycle | 23/1080 | 148/18723 | 1.31e-05 | 3.30e-04 | 23 |
| Page: 1 2 3 4 5 6 7 8 9 10 11 12 13 14 15 16 17 18 19 20 21 22 23 24 25 26 27 28 29 30 31 32 33 34 35 36 37 38 39 40 41 42 43 44 45 46 |
| Pathway ID | Tissue | Disease Stage | Description | Gene Ratio | Bg Ratio | pvalue | p.adjust | qvalue | Count |
| hsa0517118 | Breast | Precancer | Coronavirus disease - COVID-19 | 81/684 | 232/8465 | 3.74e-32 | 2.36e-30 | 1.81e-30 | 81 |
| hsa0493216 | Breast | Precancer | Non-alcoholic fatty liver disease | 48/684 | 155/8465 | 6.16e-17 | 1.50e-15 | 1.15e-15 | 48 |
| hsa0513218 | Breast | Precancer | Salmonella infection | 49/684 | 249/8465 | 2.92e-09 | 6.15e-08 | 4.71e-08 | 49 |
| hsa0513414 | Breast | Precancer | Legionellosis | 19/684 | 57/8465 | 4.62e-08 | 9.12e-07 | 6.98e-07 | 19 |
| hsa0513018 | Breast | Precancer | Pathogenic Escherichia coli infection | 38/684 | 197/8465 | 3.12e-07 | 5.81e-06 | 4.45e-06 | 38 |
| hsa0513118 | Breast | Precancer | Shigellosis | 44/684 | 247/8465 | 3.91e-07 | 6.86e-06 | 5.26e-06 | 44 |
| hsa0516718 | Breast | Precancer | Kaposi sarcoma-associated herpesvirus infection | 36/684 | 194/8465 | 1.68e-06 | 2.53e-05 | 1.94e-05 | 36 |
| hsa0541718 | Breast | Precancer | Lipid and atherosclerosis | 37/684 | 215/8465 | 7.64e-06 | 9.29e-05 | 7.12e-05 | 37 |
| hsa042189 | Breast | Precancer | Cellular senescence | 29/684 | 156/8465 | 1.66e-05 | 1.69e-04 | 1.30e-04 | 29 |
| hsa0465716 | Breast | Precancer | IL-17 signaling pathway | 20/684 | 94/8465 | 4.74e-05 | 4.54e-04 | 3.48e-04 | 20 |
| hsa0532312 | Breast | Precancer | Rheumatoid arthritis | 19/684 | 93/8465 | 1.30e-04 | 1.14e-03 | 8.73e-04 | 19 |
| hsa0516316 | Breast | Precancer | Human cytomegalovirus infection | 32/684 | 225/8465 | 1.13e-03 | 7.57e-03 | 5.80e-03 | 32 |
| hsa051206 | Breast | Precancer | Epithelial cell signaling in Helicobacter pylori infection | 14/684 | 70/8465 | 1.21e-03 | 7.99e-03 | 6.12e-03 | 14 |
| hsa052196 | Breast | Precancer | Bladder cancer | 9/684 | 41/8465 | 4.65e-03 | 2.72e-02 | 2.08e-02 | 9 |
| hsa0517119 | Breast | Precancer | Coronavirus disease - COVID-19 | 81/684 | 232/8465 | 3.74e-32 | 2.36e-30 | 1.81e-30 | 81 |
| hsa0493217 | Breast | Precancer | Non-alcoholic fatty liver disease | 48/684 | 155/8465 | 6.16e-17 | 1.50e-15 | 1.15e-15 | 48 |
| hsa0513219 | Breast | Precancer | Salmonella infection | 49/684 | 249/8465 | 2.92e-09 | 6.15e-08 | 4.71e-08 | 49 |
| hsa0513415 | Breast | Precancer | Legionellosis | 19/684 | 57/8465 | 4.62e-08 | 9.12e-07 | 6.98e-07 | 19 |
| hsa0513019 | Breast | Precancer | Pathogenic Escherichia coli infection | 38/684 | 197/8465 | 3.12e-07 | 5.81e-06 | 4.45e-06 | 38 |
| hsa0513119 | Breast | Precancer | Shigellosis | 44/684 | 247/8465 | 3.91e-07 | 6.86e-06 | 5.26e-06 | 44 |
| Page: 1 2 3 4 5 6 7 8 9 10 11 12 13 14 15 16 17 18 19 20 21 22 23 24 25 26 27 28 29 30 31 32 33 34 35 |
Top |
Cell-cell communication analysis |
| Identification of potential cell-cell interactions between two cell types and their ligand-receptor pairs for different disease states |
| Ligand | Receptor | LRpair | Pathway | Tissue | Disease Stage |
| CXCL8 | ACKR1 | CXCL8_ACKR1 | CXCL | Breast | DCIS |
| CXCL8 | ACKR1 | CXCL8_ACKR1 | CXCL | Breast | IDC |
| CXCL8 | ACKR1 | CXCL8_ACKR1 | CXCL | Cervix | ADJ |
| CXCL8 | CXCR2 | CXCL8_CXCR2 | CXCL | Cervix | ADJ |
| CXCL8 | ACKR1 | CXCL8_ACKR1 | CXCL | Cervix | CC |
| CXCL8 | CXCR1 | CXCL8_CXCR1 | CXCL | Cervix | CC |
| CXCL8 | CXCR2 | CXCL8_CXCR2 | CXCL | Cervix | CC |
| CXCL8 | CXCR1 | CXCL8_CXCR1 | CXCL | Cervix | Healthy |
| CXCL8 | CXCR2 | CXCL8_CXCR2 | CXCL | Cervix | Healthy |
| CXCL8 | ACKR1 | CXCL8_ACKR1 | CXCL | Cervix | Precancer |
| CXCL8 | CXCR1 | CXCL8_CXCR1 | CXCL | Cervix | Precancer |
| CXCL8 | CXCR2 | CXCL8_CXCR2 | CXCL | Cervix | Precancer |
| CXCL8 | ACKR1 | CXCL8_ACKR1 | CXCL | CRC | MSI-H |
| CXCL8 | ACKR1 | CXCL8_ACKR1 | CXCL | CRC | MSS |
| CXCL8 | ACKR1 | CXCL8_ACKR1 | CXCL | Endometrium | ADJ |
| CXCL8 | ACKR1 | CXCL8_ACKR1 | CXCL | Endometrium | AEH |
| CXCL8 | ACKR1 | CXCL8_ACKR1 | CXCL | Endometrium | Healthy |
| CXCL8 | ACKR1 | CXCL8_ACKR1 | CXCL | Esophagus | ESCC |
| CXCL8 | ACKR1 | CXCL8_ACKR1 | CXCL | Esophagus | Healthy |
| CXCL8 | ACKR1 | CXCL8_ACKR1 | CXCL | GC | ADJ |
| Page: 1 2 |
Top |
Single-cell gene regulatory network inference analysis |
| Find out the significant the regulons (TFs) and the target genes of each regulon across cell types for different disease states |
| TF | Cell Type | Tissue | Disease Stage | Target Gene | RSS | Regulon Activity |
| ∗The dot plots of a searched regulon are shown for all cell subpopulations in each disease state of each tissue based on the regulon specific score inferred using pySCENIC and by calculating the average expression. |
| Page: 1 |
Top |
Somatic mutation of malignant transformation related genes |
| Annotation of somatic variants for genes involved in malignant transformation |
| Hugo Symbol | Variant Class | Variant Classification | dbSNP RS | HGVSc | HGVSp | HGVSp Short | SWISSPROT | BIOTYPE | SIFT | PolyPhen | Tumor Sample Barcode | Tissue | Histology | Sex | Age | Stage | Therapy Types | Drugs | Outcome |
| CXCL8 | SNV | Missense_Mutation | c.193G>A | p.Glu65Lys | p.E65K | P10145 | protein_coding | deleterious(0.02) | probably_damaging(0.998) | TCGA-BH-A18U-01 | Breast | breast invasive carcinoma | Female | >=65 | III/IV | Unknown | Unknown | SD | |
| CXCL8 | deletion | Frame_Shift_Del | c.*5delA | P10145 | protein_coding | TCGA-BH-A18G-01 | Breast | breast invasive carcinoma | Female | >=65 | I/II | Unknown | Unknown | SD | |||||
| CXCL8 | SNV | Missense_Mutation | c.232N>A | p.Leu78Met | p.L78M | P10145 | protein_coding | deleterious(0) | probably_damaging(0.999) | TCGA-C5-A1MH-01 | Cervix | cervical & endocervical cancer | Female | >=65 | III/IV | Chemotherapy | cisplatin | PD | |
| CXCL8 | deletion | Frame_Shift_Del | c.299delN | p.Ter100%3D | p.*100%3D | P10145 | protein_coding | TCGA-EA-A410-01 | Cervix | cervical & endocervical cancer | Female | <65 | I/II | Unknown | Unknown | SD | |||
| CXCL8 | SNV | Missense_Mutation | c.260G>T | p.Arg87Met | p.R87M | P10145 | protein_coding | tolerated(0.12) | benign(0.424) | TCGA-A6-6781-01 | Colorectum | colon adenocarcinoma | Male | <65 | III/IV | Chemotherapy | oxaliplatin | SD | |
| CXCL8 | SNV | Missense_Mutation | novel | c.291N>T | p.Glu97Asp | p.E97D | P10145 | protein_coding | tolerated(0.09) | benign(0.017) | TCGA-AG-A002-01 | Colorectum | rectum adenocarcinoma | Male | <65 | I/II | Unknown | Unknown | SD |
| CXCL8 | SNV | Missense_Mutation | novel | c.291G>T | p.Glu97Asp | p.E97D | P10145 | protein_coding | tolerated(0.09) | benign(0.017) | TCGA-F5-6814-01 | Colorectum | rectum adenocarcinoma | Male | <65 | I/II | Unknown | Unknown | SD |
| CXCL8 | deletion | Frame_Shift_Del | c.*5delA | P10145 | protein_coding | TCGA-CK-6746-01 | Colorectum | colon adenocarcinoma | Female | >=65 | I/II | Unknown | Unknown | SD | |||||
| CXCL8 | SNV | Missense_Mutation | novel | c.16N>A | p.Ala6Thr | p.A6T | P10145 | protein_coding | tolerated(0.48) | benign(0.003) | TCGA-B5-A1MX-01 | Endometrium | uterine corpus endometrioid carcinoma | Female | <65 | I/II | Hormone Therapy | megace | SD |
| CXCL8 | SNV | Missense_Mutation | novel | c.196N>T | p.Ile66Phe | p.I66F | P10145 | protein_coding | deleterious(0) | probably_damaging(0.977) | TCGA-D1-A0ZU-01 | Endometrium | uterine corpus endometrioid carcinoma | Female | <65 | I/II | Chemotherapy | carboplatin | SD |
| Page: 1 2 |
Top |
Related drugs of malignant transformation related genes |
| Identification of chemicals and drugs interact with genes involved in malignant transfromation |
| (DGIdb 4.0) |
| Entrez ID | Symbol | Category | Interaction Types | Drug Claim Name | Drug Name | PMIDs |
| 3576 | CXCL8 | DRUGGABLE GENOME | METHIMAZOLE | METHIMAZOLE | 11453524 | |
| 3576 | CXCL8 | DRUGGABLE GENOME | PROTECTIVE AGENT | 9479645 | ||
| 3576 | CXCL8 | DRUGGABLE GENOME | E319 | E319 | ||
| 3576 | CXCL8 | DRUGGABLE GENOME | YANGONIN | YANGONIN | ||
| 3576 | CXCL8 | DRUGGABLE GENOME | CHLORDANE | CHLORDANE | ||
| 3576 | CXCL8 | DRUGGABLE GENOME | ALPRAZOLAM | ALPRAZOLAM | 12218154 | |
| 3576 | CXCL8 | DRUGGABLE GENOME | FENTANYL | FENTANYL | 9527747 | |
| 3576 | CXCL8 | DRUGGABLE GENOME | Ibuprofen | IBUPROFEN | ||
| 3576 | CXCL8 | DRUGGABLE GENOME | CI-1033 | CANERTINIB | 15956251 | |
| 3576 | CXCL8 | DRUGGABLE GENOME | ALPHA INTERFERON | CETUXIMAB | 10614716 |
| Page: 1 2 3 4 5 6 7 8 9 |

Copyright 2023-Present -The University of Texas Health Science Center at Houston |