
|
|||||
|
 | |
| |
| |
| |
| |
| |
|
Gene: CXCL6 |
Gene summary for CXCL6 |
| Gene information | Species | Human | Gene symbol | CXCL6 | Gene ID | 6372 |
| Gene name | C-X-C motif chemokine ligand 6 | |
| Gene Alias | CKA-3 | |
| Cytomap | 4q13.3 | |
| Gene Type | protein-coding | GO ID | GO:0001775 | UniProtAcc | P80162 |
Top |
Malignant transformation analysis |
| Identification of the aberrant gene expression in precancerous and cancerous lesions by comparing the gene expression of stem-like cells in diseased tissues with normal stem cells |
| Entrez ID | Symbol | Replicates | Species | Organ | Tissue | Adj P-value | Log2FC | Malignancy |
| 6372 | CXCL6 | LZE20T | Human | Esophagus | ESCC | 3.89e-02 | 5.22e-01 | 0.0662 |
| 6372 | CXCL6 | P2T-E | Human | Esophagus | ESCC | 2.98e-32 | 8.78e-01 | 0.1177 |
| 6372 | CXCL6 | P4T-E | Human | Esophagus | ESCC | 1.75e-09 | 4.89e-01 | 0.1323 |
| 6372 | CXCL6 | P5T-E | Human | Esophagus | ESCC | 1.36e-04 | 2.59e-01 | 0.1327 |
| 6372 | CXCL6 | P8T-E | Human | Esophagus | ESCC | 4.11e-16 | 6.47e-01 | 0.0889 |
| 6372 | CXCL6 | P12T-E | Human | Esophagus | ESCC | 6.35e-18 | 6.05e-01 | 0.1122 |
| 6372 | CXCL6 | P15T-E | Human | Esophagus | ESCC | 3.63e-05 | 4.58e-01 | 0.1149 |
| 6372 | CXCL6 | P16T-E | Human | Esophagus | ESCC | 7.92e-38 | 9.24e-01 | 0.1153 |
| 6372 | CXCL6 | P23T-E | Human | Esophagus | ESCC | 4.67e-11 | 9.62e-01 | 0.108 |
| 6372 | CXCL6 | P26T-E | Human | Esophagus | ESCC | 6.91e-06 | 2.08e-01 | 0.1276 |
| 6372 | CXCL6 | P49T-E | Human | Esophagus | ESCC | 2.46e-05 | 9.26e-01 | 0.1768 |
| 6372 | CXCL6 | P56T-E | Human | Esophagus | ESCC | 2.08e-02 | 7.45e-01 | 0.1613 |
| 6372 | CXCL6 | P57T-E | Human | Esophagus | ESCC | 1.66e-03 | 5.34e-01 | 0.0926 |
| 6372 | CXCL6 | P61T-E | Human | Esophagus | ESCC | 2.08e-02 | 7.80e-02 | 0.099 |
| 6372 | CXCL6 | P62T-E | Human | Esophagus | ESCC | 1.49e-06 | 1.79e-01 | 0.1302 |
| 6372 | CXCL6 | P74T-E | Human | Esophagus | ESCC | 2.50e-10 | 6.32e-01 | 0.1479 |
| 6372 | CXCL6 | P75T-E | Human | Esophagus | ESCC | 8.81e-24 | 1.07e+00 | 0.1125 |
| 6372 | CXCL6 | P76T-E | Human | Esophagus | ESCC | 7.69e-15 | 1.22e+00 | 0.1207 |
| 6372 | CXCL6 | P82T-E | Human | Esophagus | ESCC | 4.07e-02 | 1.04e+00 | 0.1072 |
| 6372 | CXCL6 | P83T-E | Human | Esophagus | ESCC | 3.72e-02 | 7.16e-02 | 0.1738 |
| Page: 1 2 3 |
| Tissue | Expression Dynamics | Abbreviation |
| Esophagus |  | ESCC: Esophageal squamous cell carcinoma |
| HGIN: High-grade intraepithelial neoplasias | ||
| LGIN: Low-grade intraepithelial neoplasias | ||
| Liver | 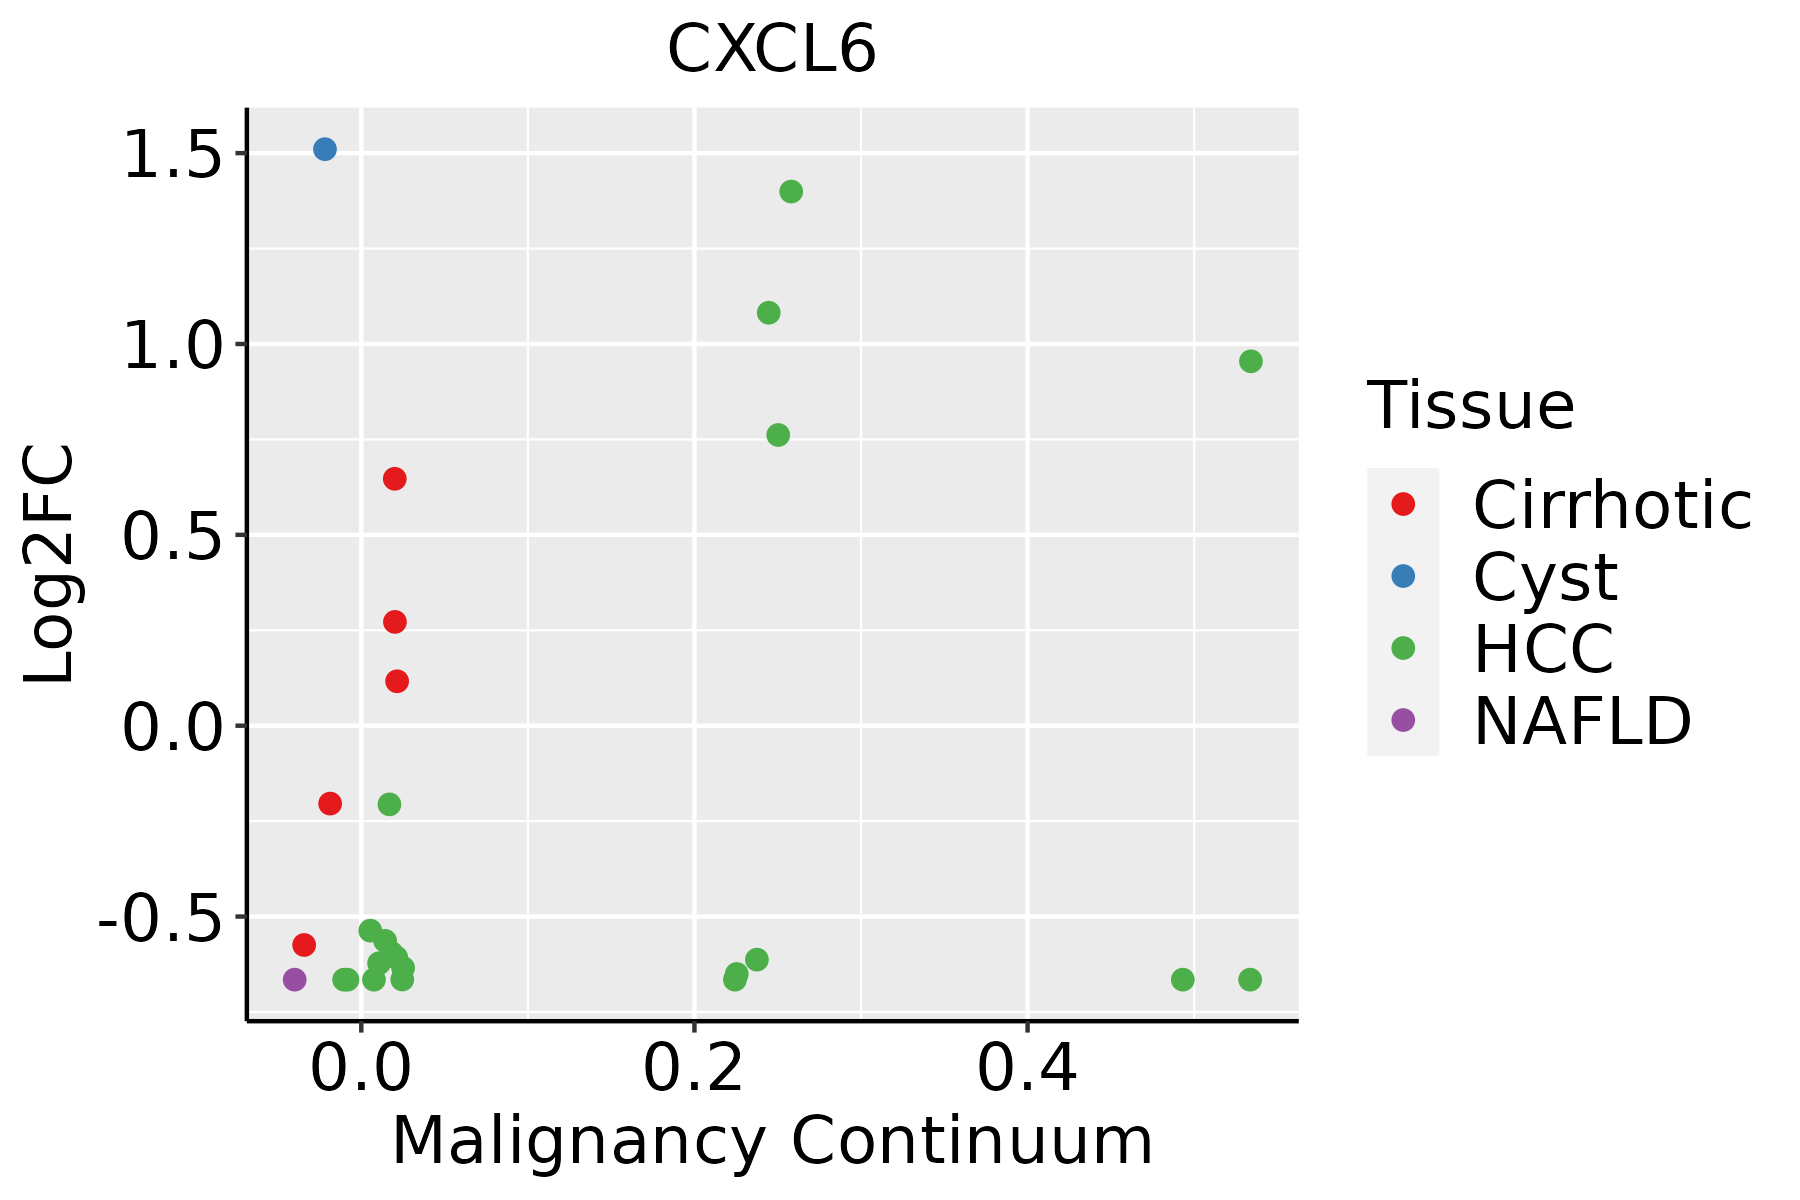 | HCC: Hepatocellular carcinoma |
| NAFLD: Non-alcoholic fatty liver disease | ||
| Oral Cavity | 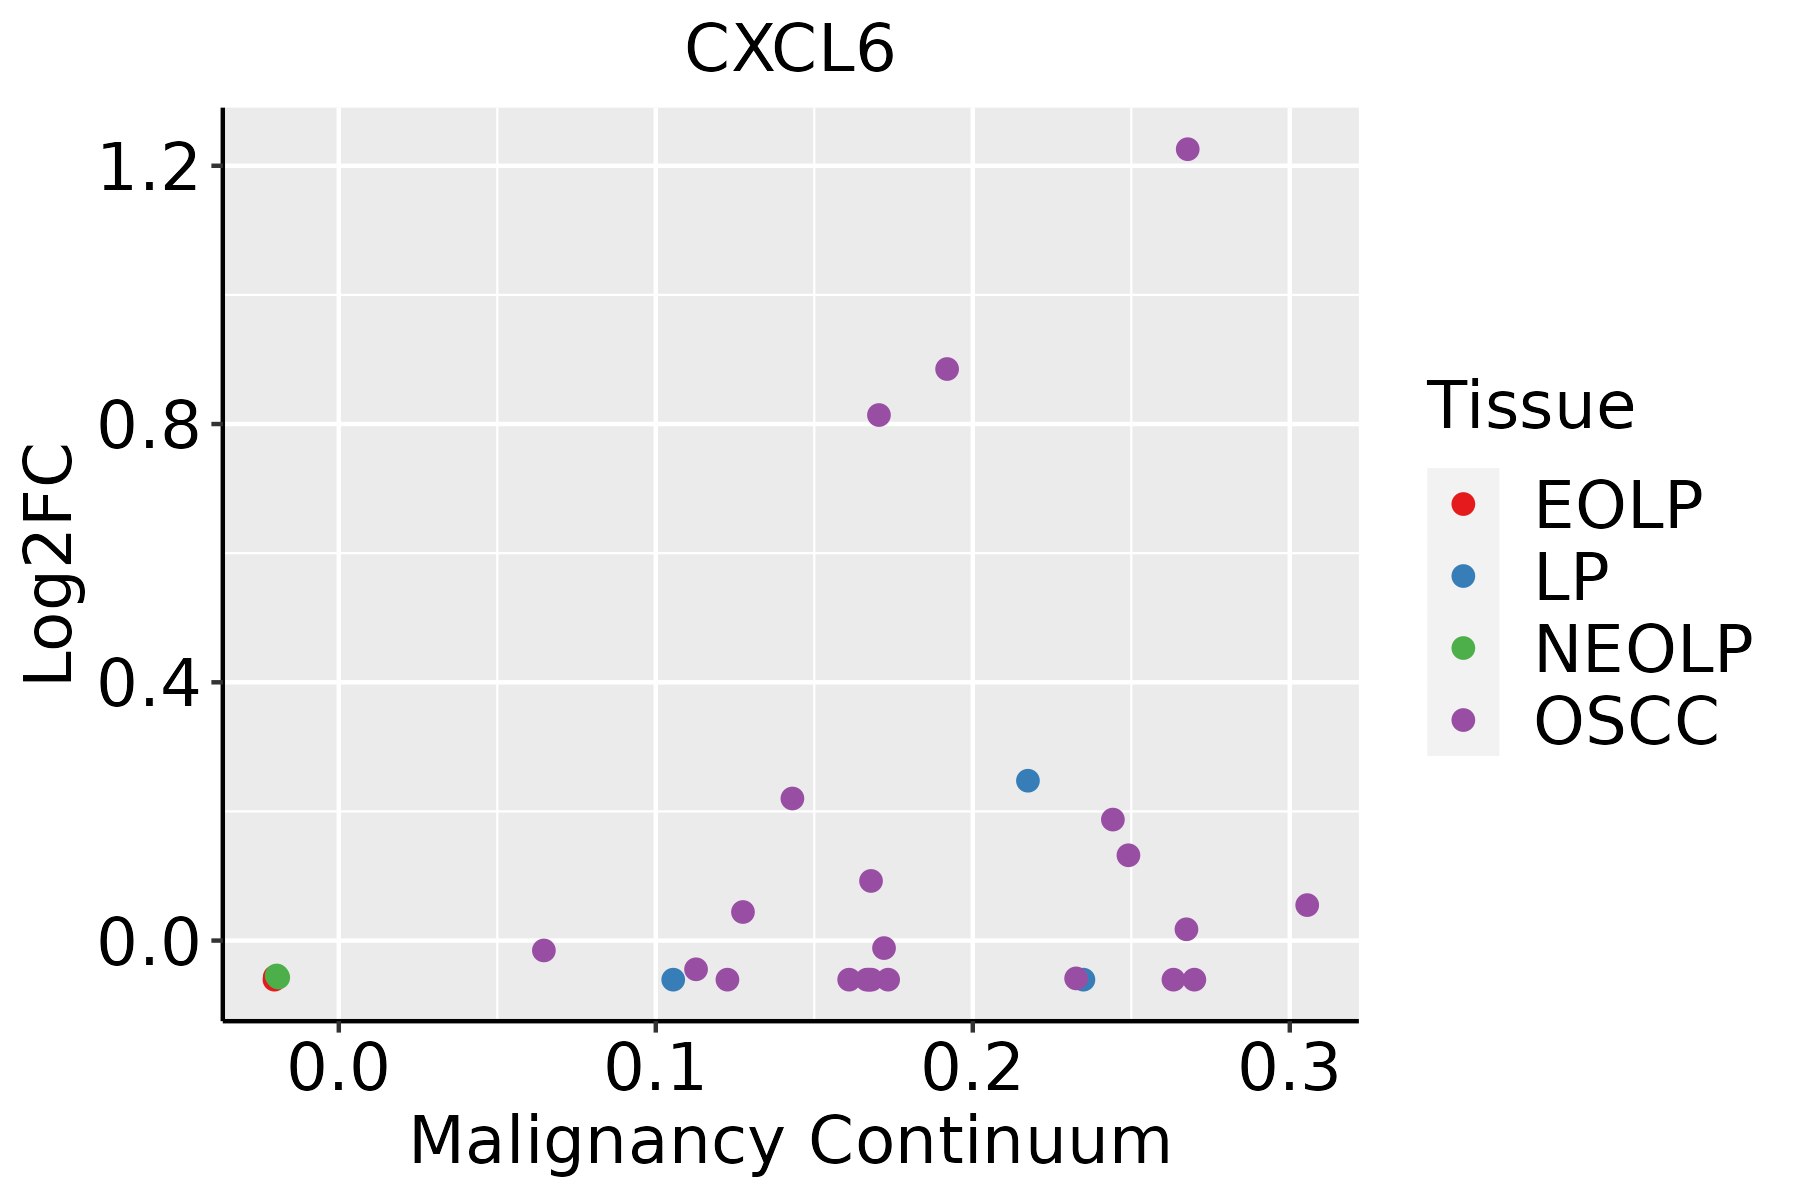 | EOLP: Erosive Oral lichen planus |
| LP: leukoplakia | ||
| NEOLP: Non-erosive oral lichen planus | ||
| OSCC: Oral squamous cell carcinoma | ||
| Thyroid |  | ATC: Anaplastic thyroid cancer |
| HT: Hashimoto's thyroiditis | ||
| PTC: Papillary thyroid cancer |
| ∗log2FC in expression of this searched gene in stem-like cells from each diseased tissue sample relative to stem-like cells in normal samples in each tissue plotted against the malignancy continuum. Samples are colored based on if they are from different disease stage. |
Top |
Malignant transformation related pathway analysis |
| Find out the enriched GO biological processes and KEGG pathways involved in transition from healthy to precancer to cancer |
| Tissue | Disease Stage | Enriched GO biological Processes |
| Colorectum | AD |  |
| Colorectum | SER |  |
| Colorectum | MSS |  |
| Colorectum | MSI-H |  |
| Colorectum | FAP |  |
| ∗Top 15 enriched GO BP terms are showed in the bar plot of each disease state in each tissue. Each row represents a significant GO biological process which is colored according to the -log10(p.adjust). |
| Page: 1 2 3 4 5 6 7 8 9 |
| GO ID | Tissue | Disease Stage | Description | Gene Ratio | Bg Ratio | pvalue | p.adjust | Count |
| GO:0044403111 | Esophagus | ESCC | biological process involved in symbiotic interaction | 186/8552 | 290/18723 | 1.43e-10 | 4.16e-09 | 186 |
| GO:0048872111 | Esophagus | ESCC | homeostasis of number of cells | 163/8552 | 272/18723 | 1.40e-06 | 1.69e-05 | 163 |
| GO:00028318 | Esophagus | ESCC | regulation of response to biotic stimulus | 191/8552 | 327/18723 | 2.12e-06 | 2.45e-05 | 191 |
| GO:0043903111 | Esophagus | ESCC | regulation of biological process involved in symbiotic interaction | 49/8552 | 72/18723 | 1.03e-04 | 7.26e-04 | 49 |
| GO:003249619 | Esophagus | ESCC | response to lipopolysaccharide | 191/8552 | 343/18723 | 1.11e-04 | 7.73e-04 | 191 |
| GO:003582114 | Esophagus | ESCC | modulation of process of other organism | 64/8552 | 106/18723 | 1.61e-03 | 7.50e-03 | 64 |
| GO:000223719 | Esophagus | ESCC | response to molecule of bacterial origin | 194/8552 | 363/18723 | 1.64e-03 | 7.61e-03 | 194 |
| GO:005170214 | Esophagus | ESCC | biological process involved in interaction with symbiont | 57/8552 | 94/18723 | 2.46e-03 | 1.07e-02 | 57 |
| GO:007122215 | Esophagus | ESCC | cellular response to lipopolysaccharide | 113/8552 | 209/18723 | 8.79e-03 | 3.10e-02 | 113 |
| GO:007121617 | Esophagus | ESCC | cellular response to biotic stimulus | 131/8552 | 246/18723 | 9.85e-03 | 3.39e-02 | 131 |
| GO:004440312 | Liver | Cirrhotic | biological process involved in symbiotic interaction | 131/4634 | 290/18723 | 2.00e-14 | 1.84e-12 | 131 |
| GO:005170211 | Liver | Cirrhotic | biological process involved in interaction with symbiont | 48/4634 | 94/18723 | 3.41e-08 | 1.14e-06 | 48 |
| GO:00358213 | Liver | Cirrhotic | modulation of process of other organism | 49/4634 | 106/18723 | 1.20e-06 | 2.43e-05 | 49 |
| GO:00439037 | Liver | Cirrhotic | regulation of biological process involved in symbiotic interaction | 34/4634 | 72/18723 | 2.86e-05 | 3.64e-04 | 34 |
| GO:00324966 | Liver | Cirrhotic | response to lipopolysaccharide | 111/4634 | 343/18723 | 8.15e-04 | 5.95e-03 | 111 |
| GO:004887212 | Liver | Cirrhotic | homeostasis of number of cells | 89/4634 | 272/18723 | 1.76e-03 | 1.12e-02 | 89 |
| GO:00022376 | Liver | Cirrhotic | response to molecule of bacterial origin | 113/4634 | 363/18723 | 3.23e-03 | 1.81e-02 | 113 |
| GO:00028311 | Liver | Cirrhotic | regulation of response to biotic stimulus | 101/4634 | 327/18723 | 6.58e-03 | 3.25e-02 | 101 |
| GO:004440322 | Liver | HCC | biological process involved in symbiotic interaction | 183/7958 | 290/18723 | 9.13e-13 | 4.59e-11 | 183 |
| GO:003582111 | Liver | HCC | modulation of process of other organism | 67/7958 | 106/18723 | 1.34e-05 | 1.48e-04 | 67 |
| Page: 1 2 3 4 |
| Pathway ID | Tissue | Disease Stage | Description | Gene Ratio | Bg Ratio | pvalue | p.adjust | qvalue | Count |
| hsa0466810 | Esophagus | ESCC | TNF signaling pathway | 89/4205 | 114/8465 | 3.36e-10 | 4.01e-09 | 2.06e-09 | 89 |
| hsa0465727 | Esophagus | ESCC | IL-17 signaling pathway | 66/4205 | 94/8465 | 3.93e-05 | 1.75e-04 | 8.99e-05 | 66 |
| hsa0532320 | Esophagus | ESCC | Rheumatoid arthritis | 59/4205 | 93/8465 | 4.98e-03 | 1.27e-02 | 6.52e-03 | 59 |
| hsa051339 | Esophagus | ESCC | Pertussis | 48/4205 | 76/8465 | 1.21e-02 | 2.77e-02 | 1.42e-02 | 48 |
| hsa0466817 | Esophagus | ESCC | TNF signaling pathway | 89/4205 | 114/8465 | 3.36e-10 | 4.01e-09 | 2.06e-09 | 89 |
| hsa0465734 | Esophagus | ESCC | IL-17 signaling pathway | 66/4205 | 94/8465 | 3.93e-05 | 1.75e-04 | 8.99e-05 | 66 |
| hsa05323110 | Esophagus | ESCC | Rheumatoid arthritis | 59/4205 | 93/8465 | 4.98e-03 | 1.27e-02 | 6.52e-03 | 59 |
| hsa0513314 | Esophagus | ESCC | Pertussis | 48/4205 | 76/8465 | 1.21e-02 | 2.77e-02 | 1.42e-02 | 48 |
| hsa05133 | Liver | Cirrhotic | Pertussis | 37/2530 | 76/8465 | 4.17e-04 | 2.57e-03 | 1.58e-03 | 37 |
| hsa0532310 | Liver | Cirrhotic | Rheumatoid arthritis | 38/2530 | 93/8465 | 1.52e-02 | 4.57e-02 | 2.82e-02 | 38 |
| hsa051331 | Liver | Cirrhotic | Pertussis | 37/2530 | 76/8465 | 4.17e-04 | 2.57e-03 | 1.58e-03 | 37 |
| hsa0532311 | Liver | Cirrhotic | Rheumatoid arthritis | 38/2530 | 93/8465 | 1.52e-02 | 4.57e-02 | 2.82e-02 | 38 |
| hsa046684 | Liver | HCC | TNF signaling pathway | 73/4020 | 114/8465 | 2.53e-04 | 1.19e-03 | 6.63e-04 | 73 |
| hsa051332 | Liver | HCC | Pertussis | 48/4020 | 76/8465 | 4.17e-03 | 1.27e-02 | 7.06e-03 | 48 |
| hsa0466811 | Liver | HCC | TNF signaling pathway | 73/4020 | 114/8465 | 2.53e-04 | 1.19e-03 | 6.63e-04 | 73 |
| hsa051333 | Liver | HCC | Pertussis | 48/4020 | 76/8465 | 4.17e-03 | 1.27e-02 | 7.06e-03 | 48 |
| hsa051334 | Liver | Cyst | Pertussis | 11/339 | 76/8465 | 2.00e-04 | 2.51e-03 | 2.07e-03 | 11 |
| hsa0465712 | Liver | Cyst | IL-17 signaling pathway | 11/339 | 94/8465 | 1.27e-03 | 1.36e-02 | 1.12e-02 | 11 |
| hsa046682 | Liver | Cyst | TNF signaling pathway | 12/339 | 114/8465 | 1.96e-03 | 1.88e-02 | 1.56e-02 | 12 |
| hsa051335 | Liver | Cyst | Pertussis | 11/339 | 76/8465 | 2.00e-04 | 2.51e-03 | 2.07e-03 | 11 |
| Page: 1 2 |
Top |
Cell-cell communication analysis |
| Identification of potential cell-cell interactions between two cell types and their ligand-receptor pairs for different disease states |
| Ligand | Receptor | LRpair | Pathway | Tissue | Disease Stage |
| CXCL6 | ACKR1 | CXCL6_ACKR1 | CXCL | Breast | Healthy |
| CXCL6 | ACKR1 | CXCL6_ACKR1 | CXCL | Breast | Precancer |
| CXCL6 | ACKR1 | CXCL6_ACKR1 | CXCL | Esophagus | ESCC |
| CXCL6 | ACKR1 | CXCL6_ACKR1 | CXCL | HNSCC | Healthy |
| CXCL6 | ACKR1 | CXCL6_ACKR1 | CXCL | HNSCC | OSCC |
| CXCL6 | ACKR1 | CXCL6_ACKR1 | CXCL | HNSCC | Precancer |
| CXCL6 | CXCR2 | CXCL6_CXCR2 | CXCL | HNSCC | Precancer |
| CXCL6 | ACKR1 | CXCL6_ACKR1 | CXCL | Liver | Precancer |
| CXCL6 | ACKR1 | CXCL6_ACKR1 | CXCL | Lung | AAH |
| CXCL6 | ACKR1 | CXCL6_ACKR1 | CXCL | Prostate | BPH |
| CXCL6 | ACKR1 | CXCL6_ACKR1 | CXCL | Prostate | Healthy |
| CXCL6 | ACKR1 | CXCL6_ACKR1 | CXCL | THCA | Cancer |
| Page: 1 |
Top |
Single-cell gene regulatory network inference analysis |
| Find out the significant the regulons (TFs) and the target genes of each regulon across cell types for different disease states |
| TF | Cell Type | Tissue | Disease Stage | Target Gene | RSS | Regulon Activity |
| ∗The dot plots of a searched regulon are shown for all cell subpopulations in each disease state of each tissue based on the regulon specific score inferred using pySCENIC and by calculating the average expression. |
| Page: 1 |
Top |
Somatic mutation of malignant transformation related genes |
| Annotation of somatic variants for genes involved in malignant transformation |
| Hugo Symbol | Variant Class | Variant Classification | dbSNP RS | HGVSc | HGVSp | HGVSp Short | SWISSPROT | BIOTYPE | SIFT | PolyPhen | Tumor Sample Barcode | Tissue | Histology | Sex | Age | Stage | Therapy Types | Drugs | Outcome |
| CXCL6 | SNV | Missense_Mutation | novel | c.44N>T | p.Ser15Leu | p.S15L | P80162 | protein_coding | tolerated(0.05) | benign(0.003) | TCGA-BH-A0B6-01 | Breast | breast invasive carcinoma | Female | <65 | I/II | Unknown | Unknown | SD |
| CXCL6 | SNV | Missense_Mutation | c.281N>T | p.Pro94Leu | p.P94L | P80162 | protein_coding | deleterious(0) | probably_damaging(0.999) | TCGA-C8-A12W-01 | Breast | breast invasive carcinoma | Female | <65 | III/IV | Unknown | Unknown | SD | |
| CXCL6 | SNV | Missense_Mutation | c.19N>T | p.Arg7Cys | p.R7C | P80162 | protein_coding | deleterious(0) | benign(0) | TCGA-A6-2686-01 | Colorectum | colon adenocarcinoma | Female | >=65 | I/II | Unknown | Unknown | SD | |
| CXCL6 | SNV | Missense_Mutation | novel | c.287N>T | p.Ala96Val | p.A96V | P80162 | protein_coding | deleterious(0.01) | probably_damaging(0.914) | TCGA-AA-3984-01 | Colorectum | colon adenocarcinoma | Female | <65 | I/II | Unknown | Unknown | SD |
| CXCL6 | SNV | Missense_Mutation | novel | c.170G>T | p.Arg57Ile | p.R57I | P80162 | protein_coding | deleterious(0) | possibly_damaging(0.602) | TCGA-A5-A0G2-01 | Endometrium | uterine corpus endometrioid carcinoma | Female | <65 | III/IV | Unknown | Unknown | SD |
| CXCL6 | SNV | Missense_Mutation | c.68C>T | p.Ala23Val | p.A23V | P80162 | protein_coding | tolerated(0.11) | benign(0.147) | TCGA-AJ-A2QO-01 | Endometrium | uterine corpus endometrioid carcinoma | Female | >=65 | I/II | Unknown | Unknown | SD | |
| CXCL6 | SNV | Missense_Mutation | novel | c.205N>G | p.Phe69Val | p.F69V | P80162 | protein_coding | tolerated(0.26) | benign(0.01) | TCGA-AX-A1CE-01 | Endometrium | uterine corpus endometrioid carcinoma | Female | <65 | I/II | Unspecific | Paclitaxel | SD |
| CXCL6 | SNV | Missense_Mutation | novel | c.331N>G | p.Asn111Asp | p.N111D | P80162 | protein_coding | tolerated(0.11) | benign(0.037) | TCGA-B5-A3FA-01 | Endometrium | uterine corpus endometrioid carcinoma | Female | >=65 | I/II | Unknown | Unknown | SD |
| CXCL6 | SNV | Missense_Mutation | novel | c.143G>A | p.Arg48His | p.R48H | P80162 | protein_coding | deleterious(0) | probably_damaging(0.999) | TCGA-BS-A0UF-01 | Endometrium | uterine corpus endometrioid carcinoma | Female | >=65 | I/II | Unknown | Unknown | SD |
| CXCL6 | SNV | Missense_Mutation | novel | c.200A>T | p.Gln67Leu | p.Q67L | P80162 | protein_coding | deleterious(0) | possibly_damaging(0.828) | TCGA-DD-AADS-01 | Liver | liver hepatocellular carcinoma | Male | <65 | I/II | Unknown | Unknown | SD |
| Page: 1 2 |
Top |
Related drugs of malignant transformation related genes |
| Identification of chemicals and drugs interact with genes involved in malignant transfromation |
| (DGIdb 4.0) |
| Entrez ID | Symbol | Category | Interaction Types | Drug Claim Name | Drug Name | PMIDs |
| Page: 1 |

Copyright 2023-Present -The University of Texas Health Science Center at Houston |