
|
|||||
|
 | |
| |
| |
| |
| |
| |
|
Gene: CXCL3 |
Gene summary for CXCL3 |
| Gene information | Species | Human | Gene symbol | CXCL3 | Gene ID | 2921 |
| Gene name | C-X-C motif chemokine ligand 3 | |
| Gene Alias | CINC-2b | |
| Cytomap | 4q13.3 | |
| Gene Type | protein-coding | GO ID | GO:0002237 | UniProtAcc | P19876 |
Top |
Malignant transformation analysis |
| Identification of the aberrant gene expression in precancerous and cancerous lesions by comparing the gene expression of stem-like cells in diseased tissues with normal stem cells |
| Entrez ID | Symbol | Replicates | Species | Organ | Tissue | Adj P-value | Log2FC | Malignancy |
| 2921 | CXCL3 | GSM4909280 | Human | Breast | Precancer | 5.67e-06 | 9.14e-01 | 0.0305 |
| 2921 | CXCL3 | GSM4909281 | Human | Breast | IDC | 2.55e-23 | -6.04e-01 | 0.21 |
| 2921 | CXCL3 | GSM4909282 | Human | Breast | IDC | 2.27e-19 | -5.67e-01 | -0.0288 |
| 2921 | CXCL3 | GSM4909285 | Human | Breast | IDC | 1.81e-11 | -5.77e-01 | 0.21 |
| 2921 | CXCL3 | GSM4909286 | Human | Breast | IDC | 1.63e-27 | -6.22e-01 | 0.1081 |
| 2921 | CXCL3 | GSM4909287 | Human | Breast | IDC | 1.93e-11 | -5.24e-01 | 0.2057 |
| 2921 | CXCL3 | GSM4909290 | Human | Breast | IDC | 5.33e-08 | -5.13e-01 | 0.2096 |
| 2921 | CXCL3 | GSM4909291 | Human | Breast | IDC | 2.76e-07 | -5.55e-01 | 0.1753 |
| 2921 | CXCL3 | GSM4909293 | Human | Breast | IDC | 1.20e-21 | -5.96e-01 | 0.1581 |
| 2921 | CXCL3 | GSM4909294 | Human | Breast | IDC | 8.49e-24 | -5.98e-01 | 0.2022 |
| 2921 | CXCL3 | GSM4909296 | Human | Breast | IDC | 1.06e-19 | -5.89e-01 | 0.1524 |
| 2921 | CXCL3 | GSM4909297 | Human | Breast | IDC | 5.46e-18 | -5.93e-01 | 0.1517 |
| 2921 | CXCL3 | GSM4909298 | Human | Breast | IDC | 1.02e-24 | -6.14e-01 | 0.1551 |
| 2921 | CXCL3 | GSM4909299 | Human | Breast | IDC | 4.81e-03 | -3.42e-01 | 0.035 |
| 2921 | CXCL3 | GSM4909301 | Human | Breast | IDC | 9.66e-27 | -6.18e-01 | 0.1577 |
| 2921 | CXCL3 | GSM4909302 | Human | Breast | IDC | 1.21e-16 | -5.77e-01 | 0.1545 |
| 2921 | CXCL3 | GSM4909304 | Human | Breast | IDC | 5.70e-25 | -6.21e-01 | 0.1636 |
| 2921 | CXCL3 | GSM4909306 | Human | Breast | IDC | 2.09e-14 | -5.47e-01 | 0.1564 |
| 2921 | CXCL3 | GSM4909307 | Human | Breast | IDC | 7.57e-18 | -5.81e-01 | 0.1569 |
| 2921 | CXCL3 | GSM4909308 | Human | Breast | IDC | 5.46e-22 | -6.22e-01 | 0.158 |
| Page: 1 2 3 4 5 6 7 8 9 10 |
| Tissue | Expression Dynamics | Abbreviation |
| Breast | 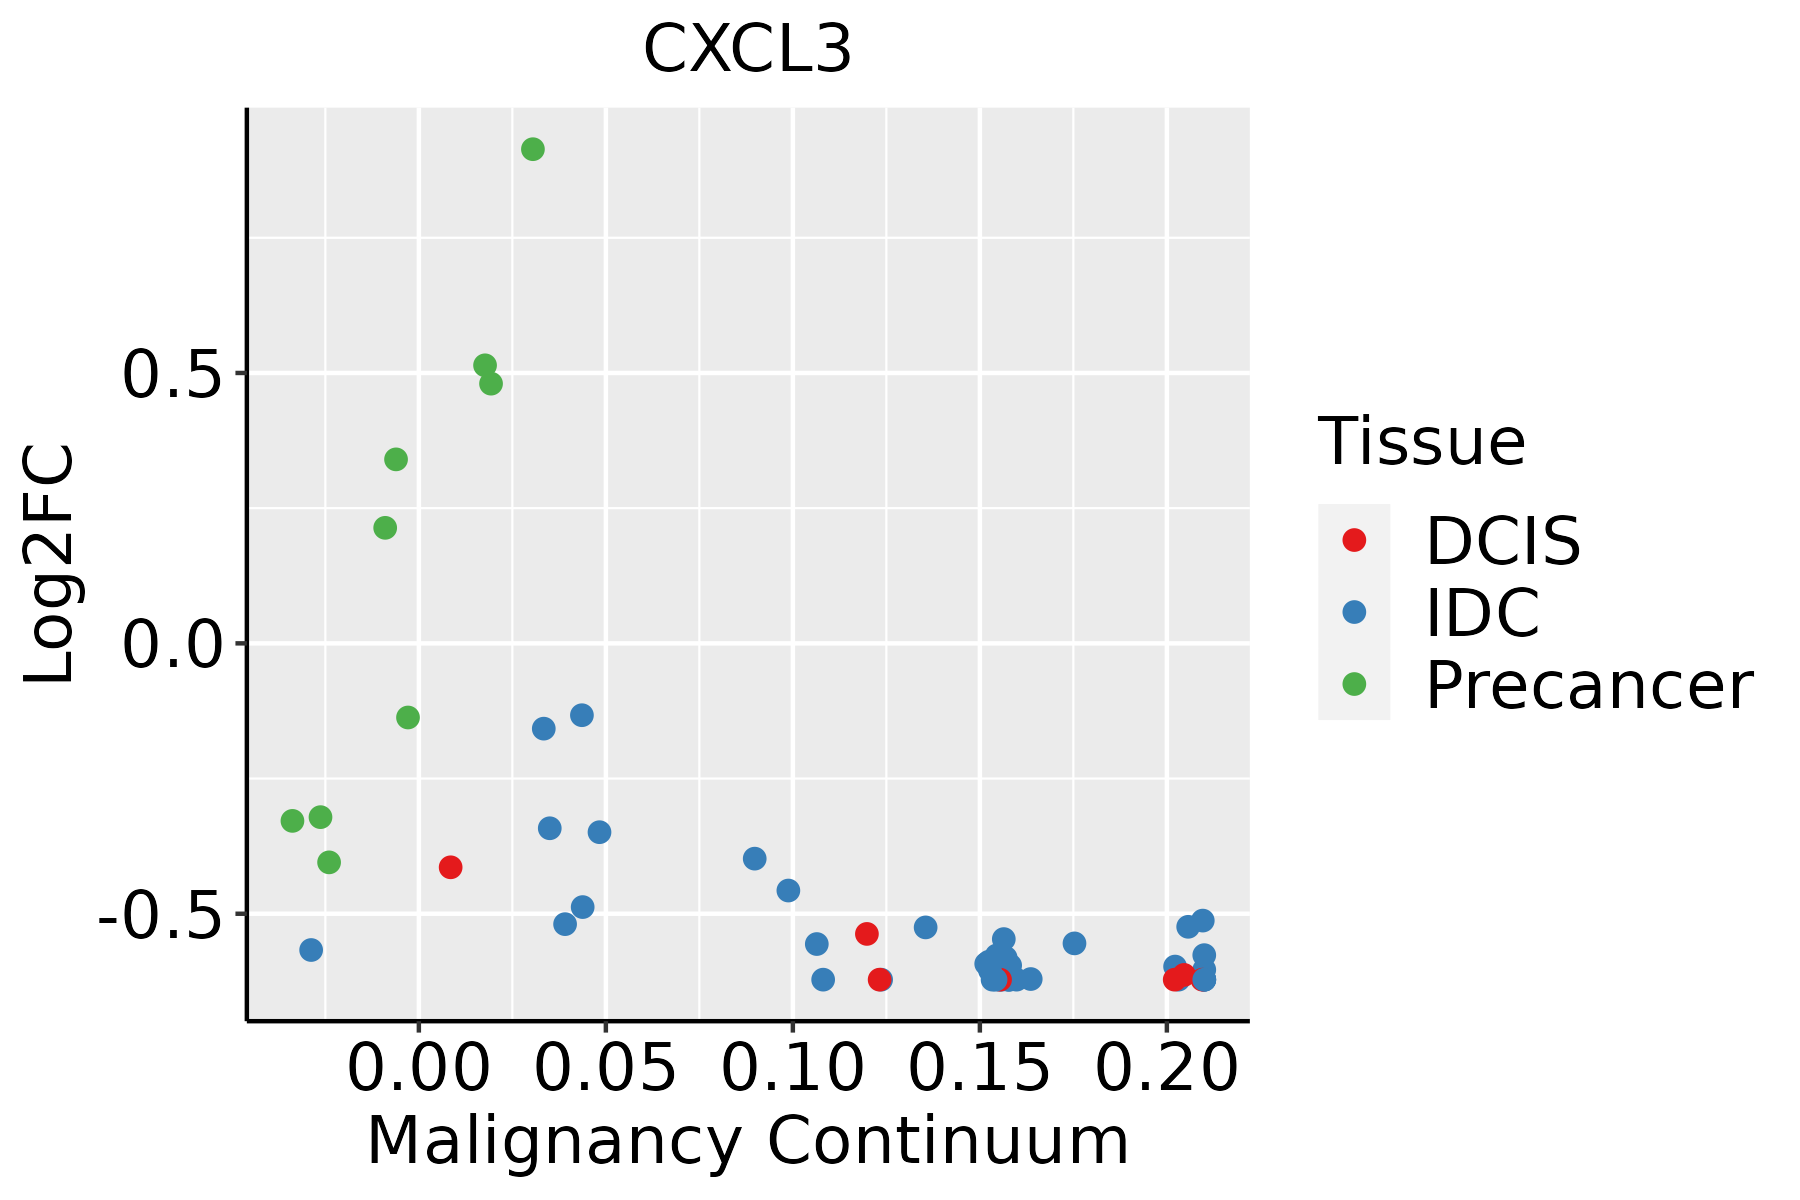 | IDC: Invasive ductal carcinoma |
| DCIS: Ductal carcinoma in situ | ||
| Precancer(BRCA1-mut): Precancerous lesion from BRCA1 mutation carriers | ||
| Cervix |  | CC: Cervix cancer |
| HSIL_HPV: HPV-infected high-grade squamous intraepithelial lesions | ||
| N_HPV: HPV-infected normal cervix | ||
| Colorectum (GSE201348) |  | FAP: Familial adenomatous polyposis |
| CRC: Colorectal cancer | ||
| Colorectum (HTA11) |  | AD: Adenomas |
| SER: Sessile serrated lesions | ||
| MSI-H: Microsatellite-high colorectal cancer | ||
| MSS: Microsatellite stable colorectal cancer | ||
| Endometrium | 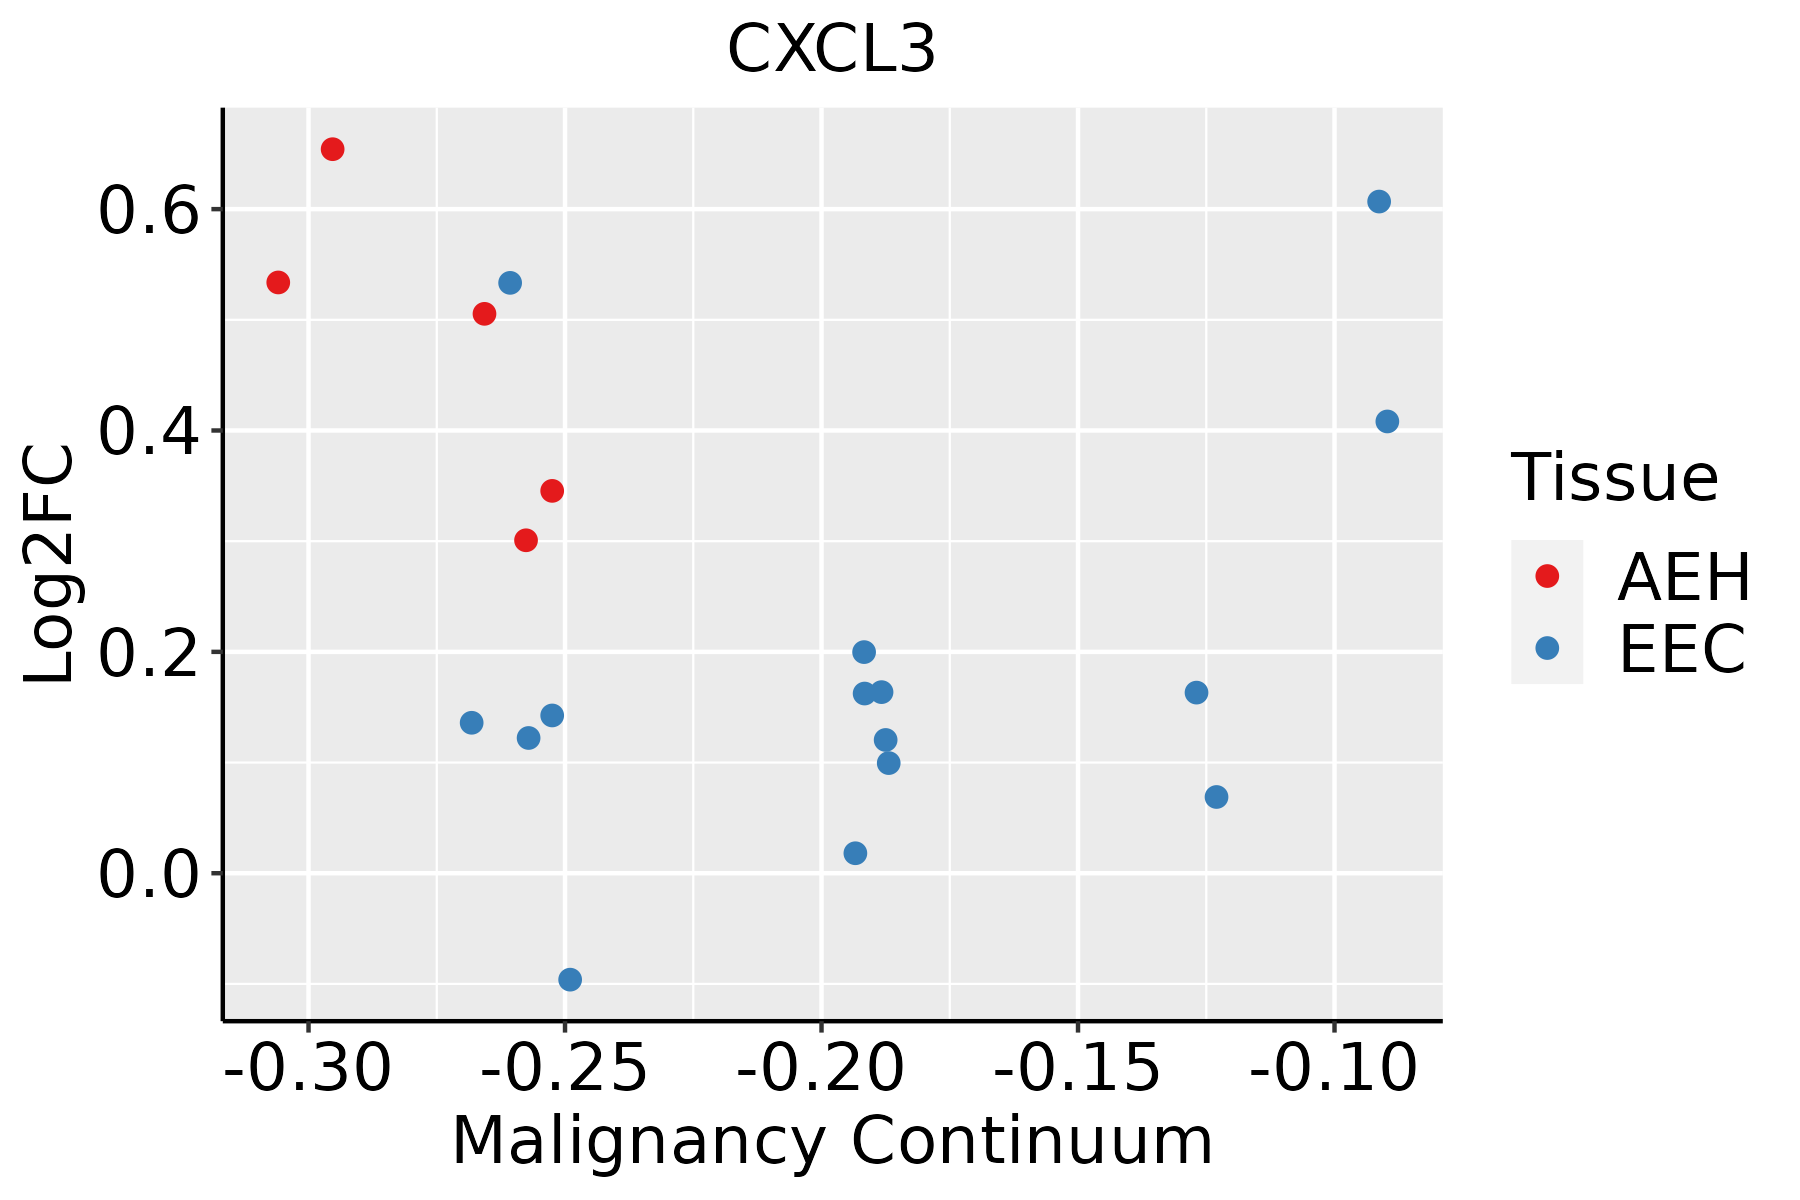 | AEH: Atypical endometrial hyperplasia |
| EEC: Endometrioid Cancer | ||
| Esophagus |  | ESCC: Esophageal squamous cell carcinoma |
| HGIN: High-grade intraepithelial neoplasias | ||
| LGIN: Low-grade intraepithelial neoplasias | ||
| GC | 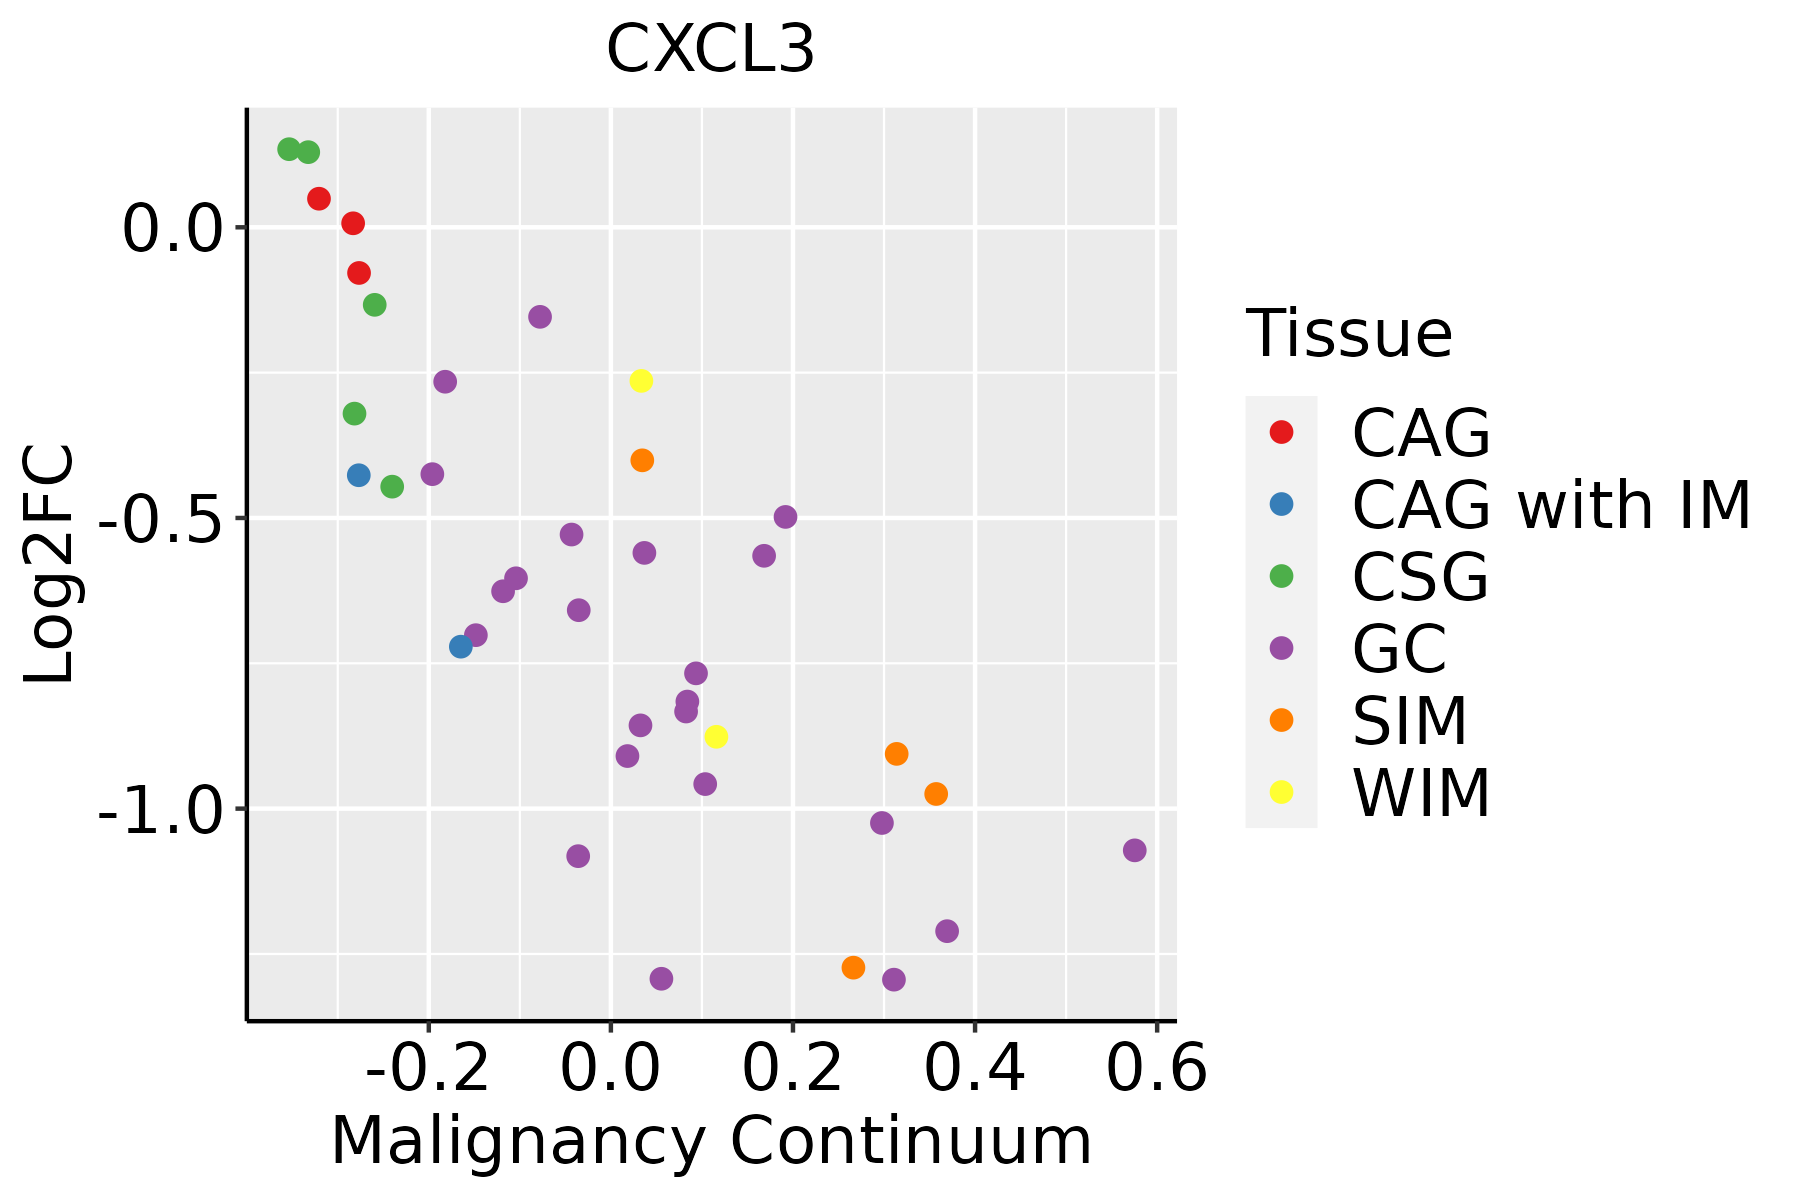 | CAG: Chronic atrophic gastritis |
| CAG with IM: Chronic atrophic gastritis with intestinal metaplasia | ||
| CSG: Chronic superficial gastritis | ||
| GC: Gastric cancer | ||
| SIM: Severe intestinal metaplasia | ||
| WIM: Wild intestinal metaplasia | ||
| Liver | 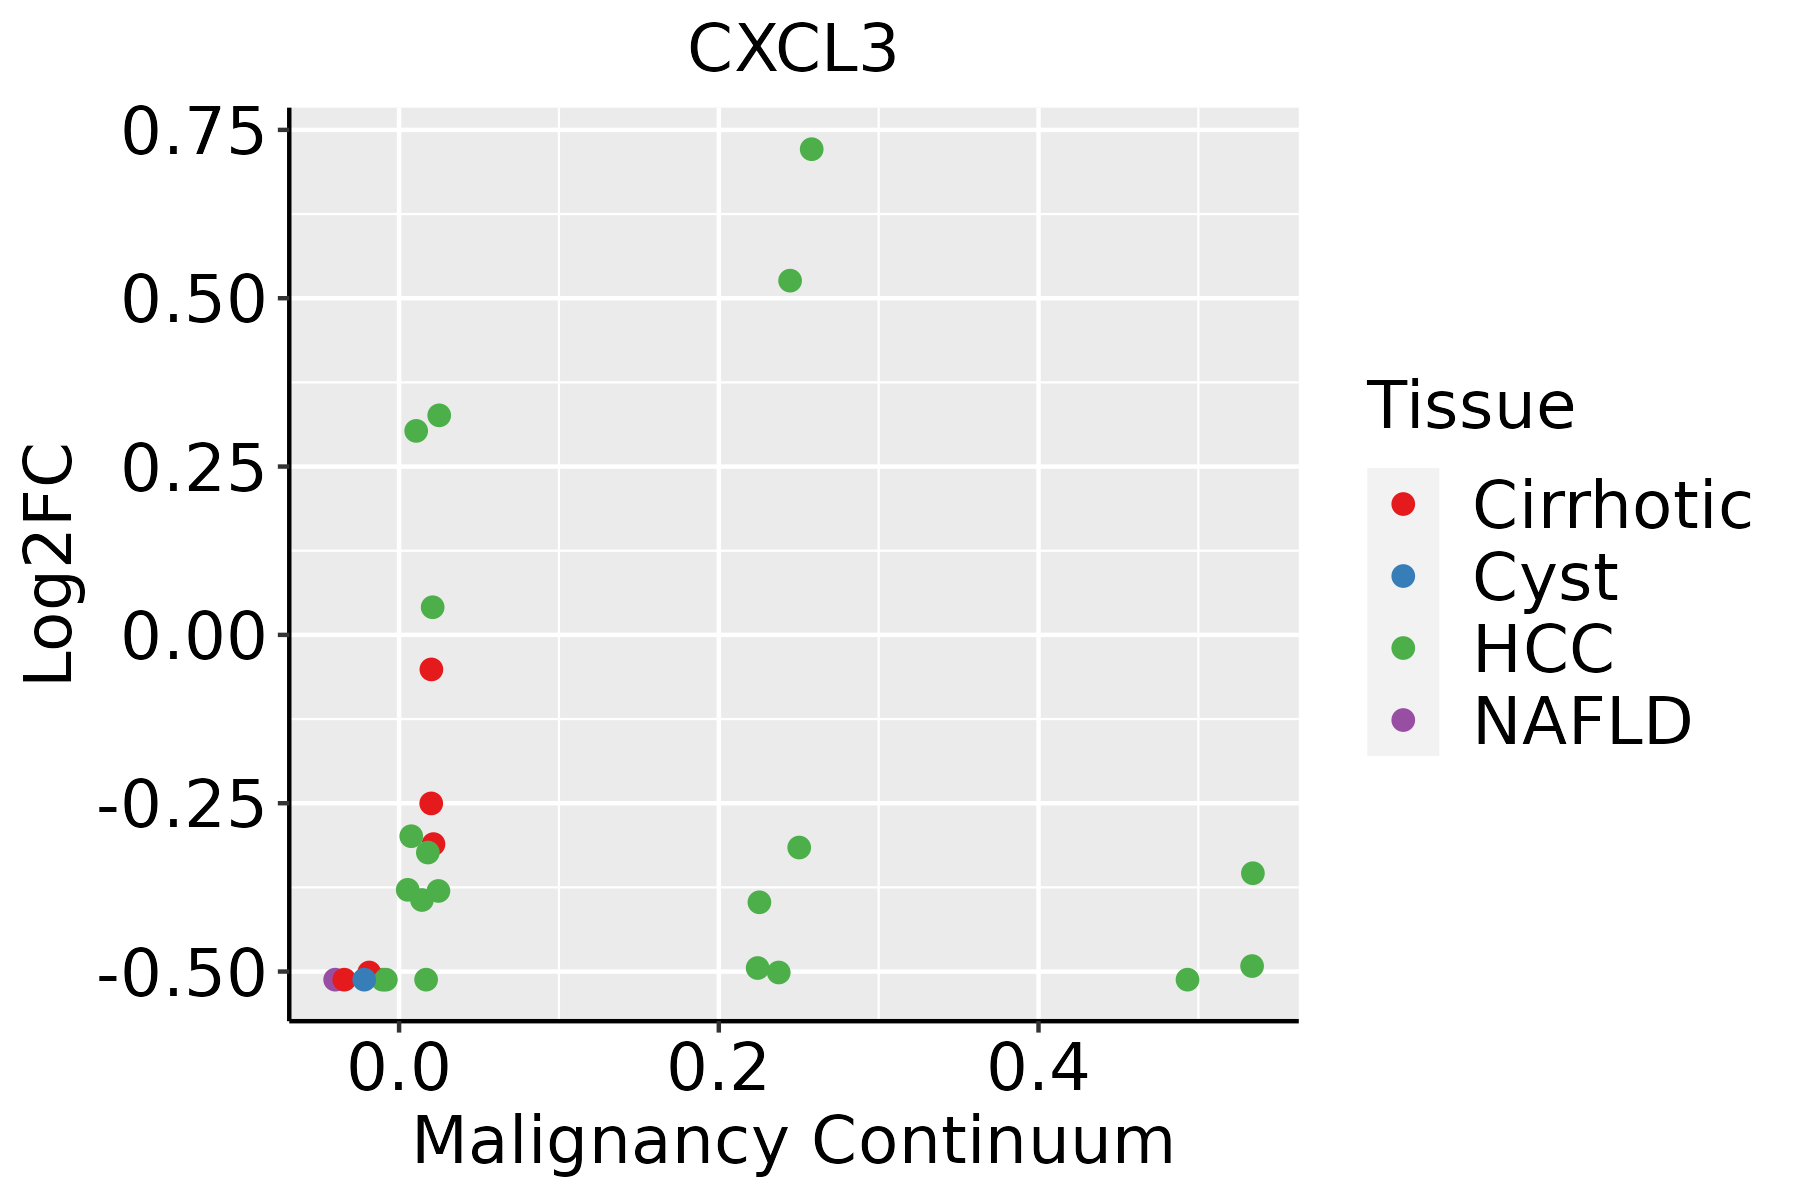 | HCC: Hepatocellular carcinoma |
| NAFLD: Non-alcoholic fatty liver disease | ||
| Lung | 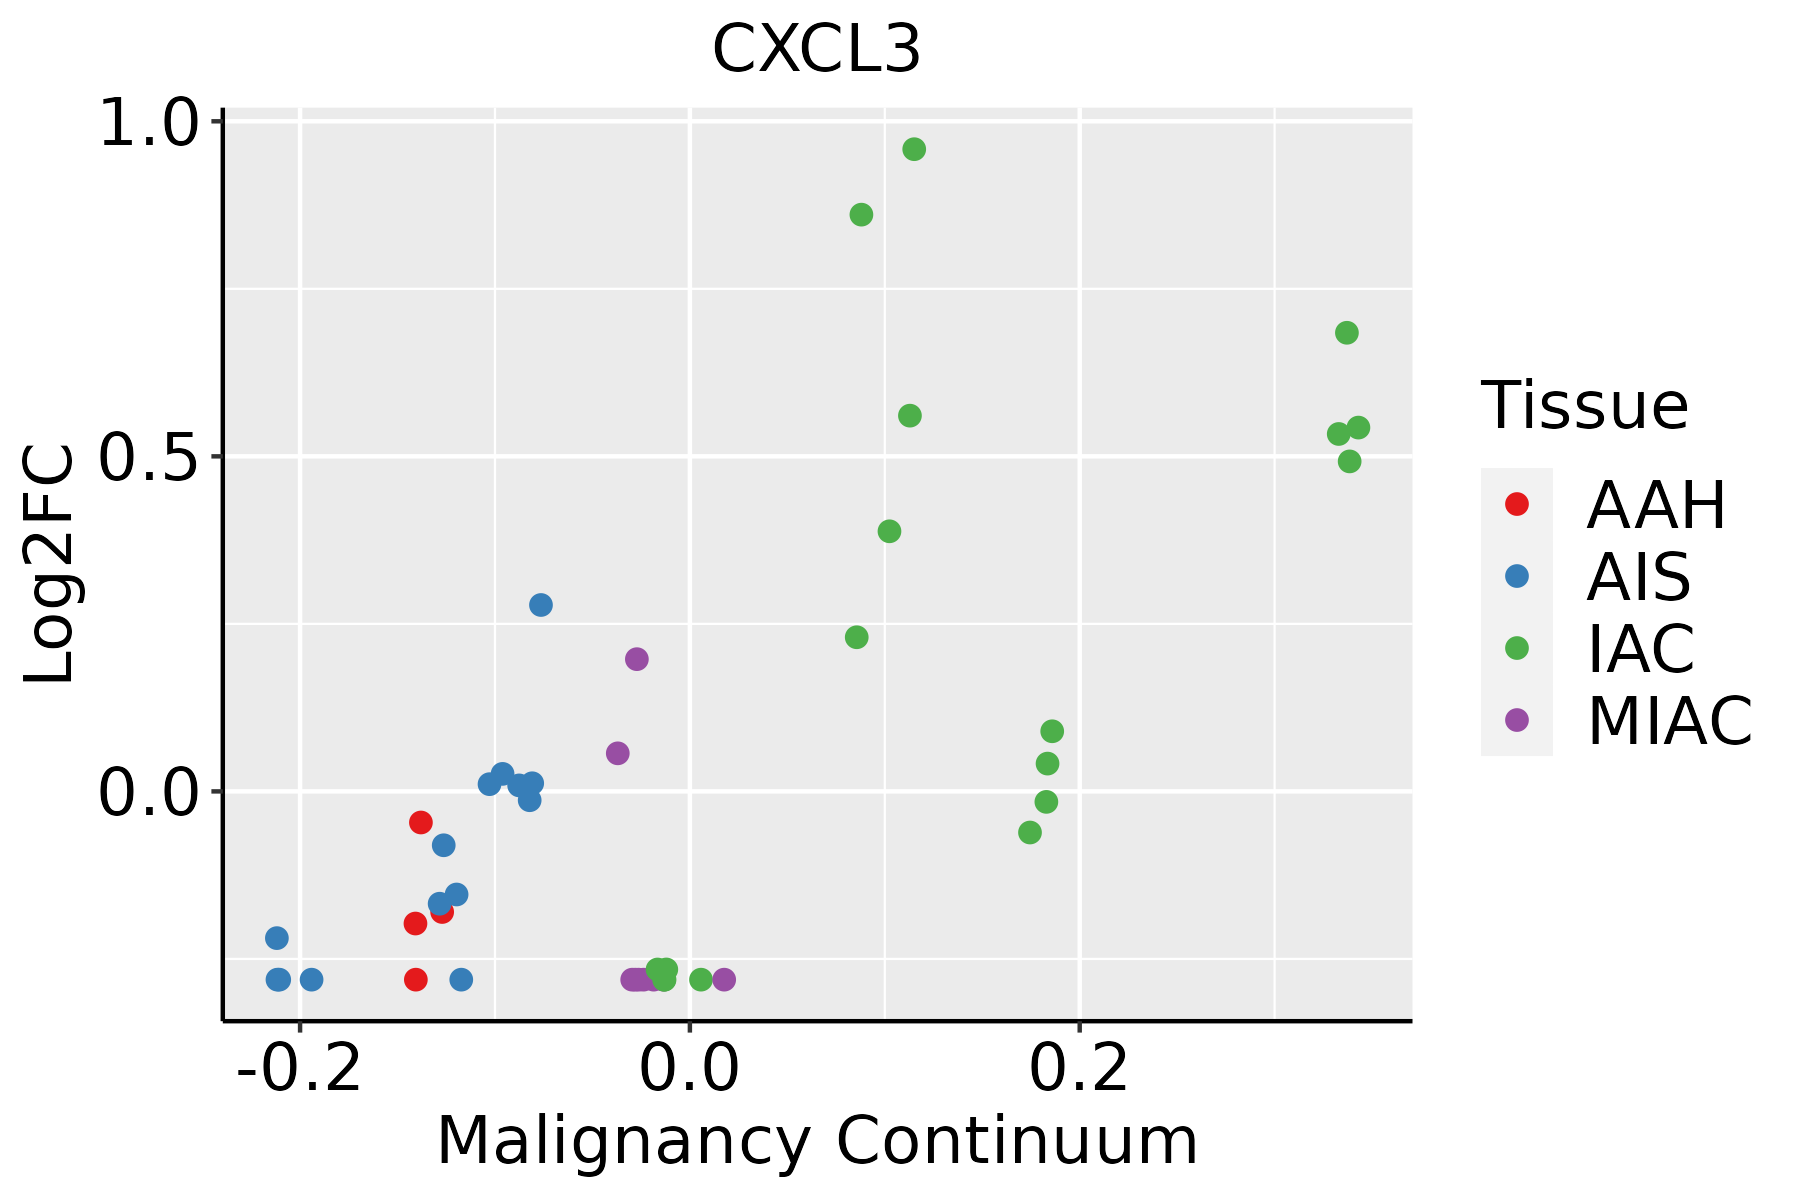 | AAH: Atypical adenomatous hyperplasia |
| AIS: Adenocarcinoma in situ | ||
| IAC: Invasive lung adenocarcinoma | ||
| MIA: Minimally invasive adenocarcinoma | ||
| Oral Cavity | 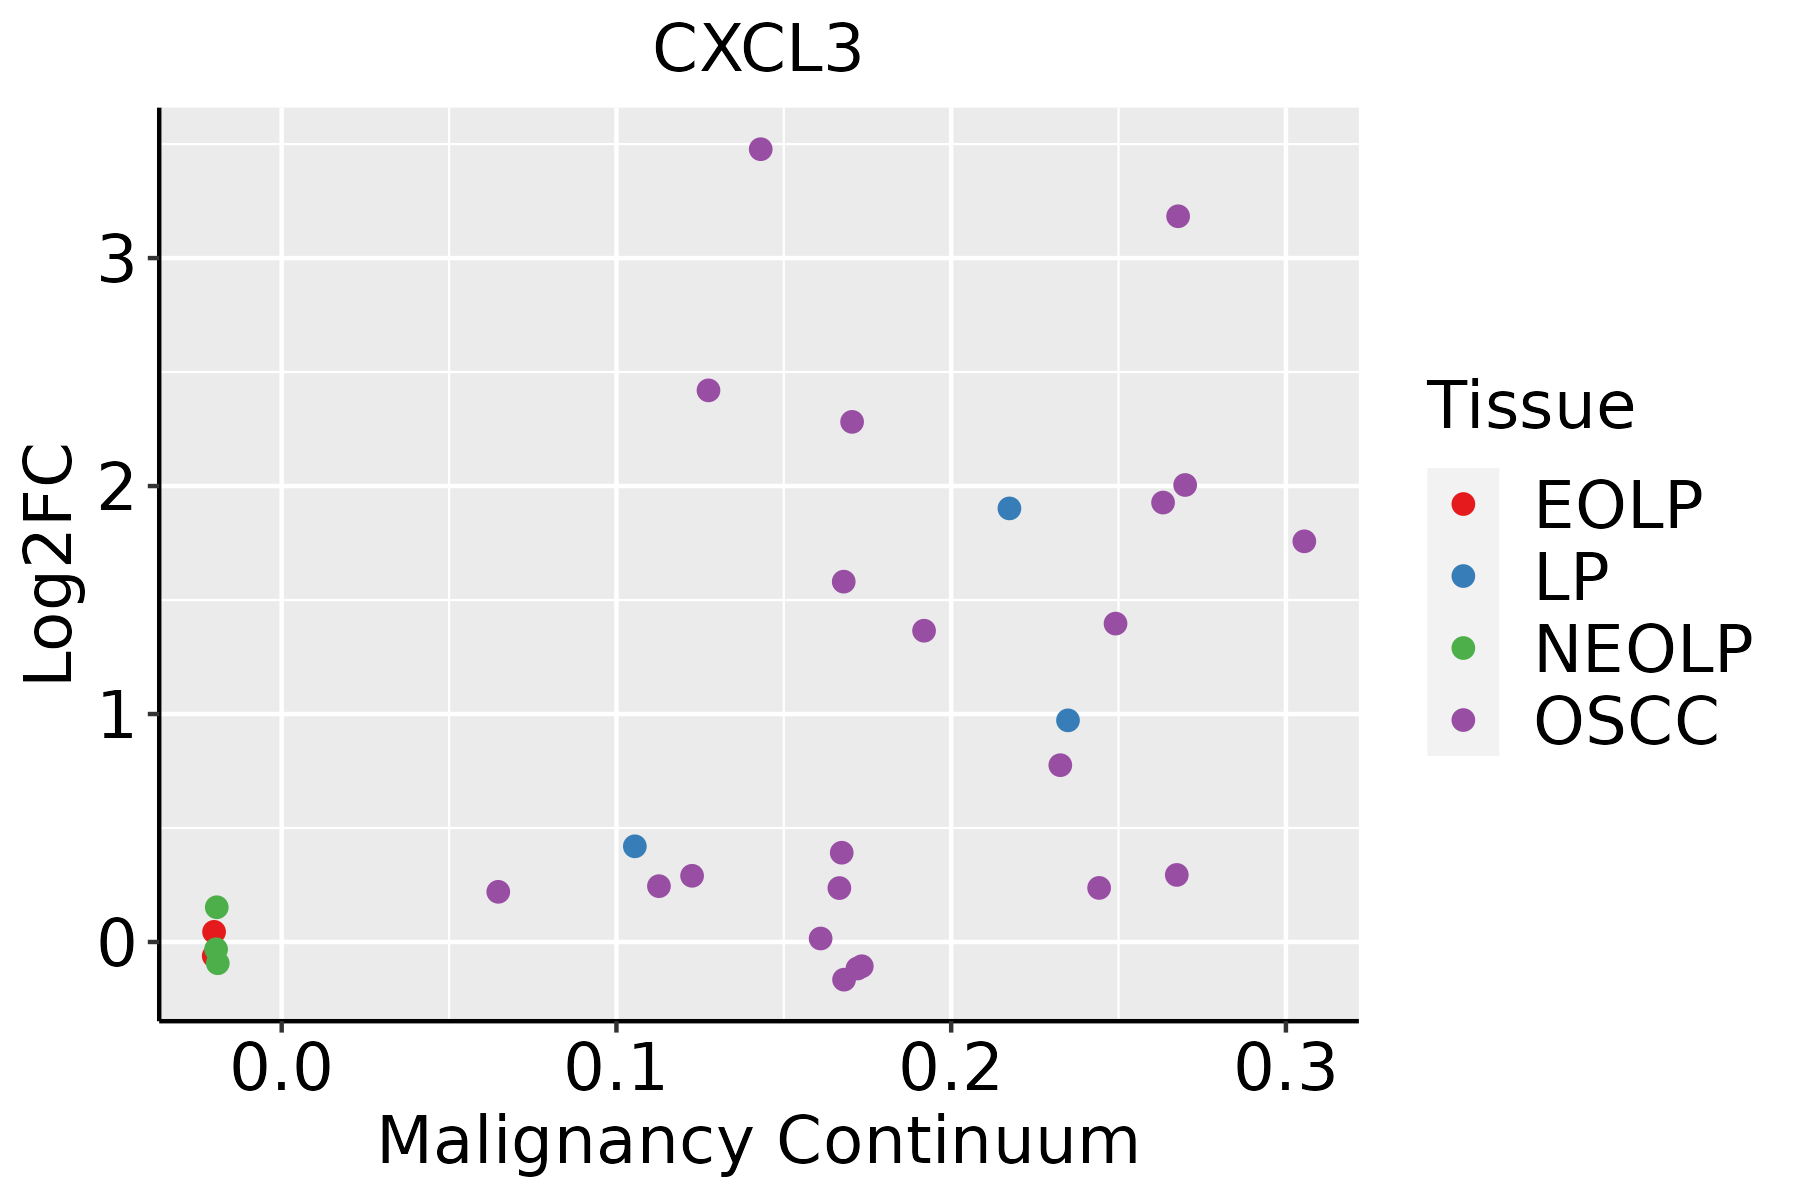 | EOLP: Erosive Oral lichen planus |
| LP: leukoplakia | ||
| NEOLP: Non-erosive oral lichen planus | ||
| OSCC: Oral squamous cell carcinoma | ||
| Prostate |  | BPH: Benign Prostatic Hyperplasia |
| Skin | 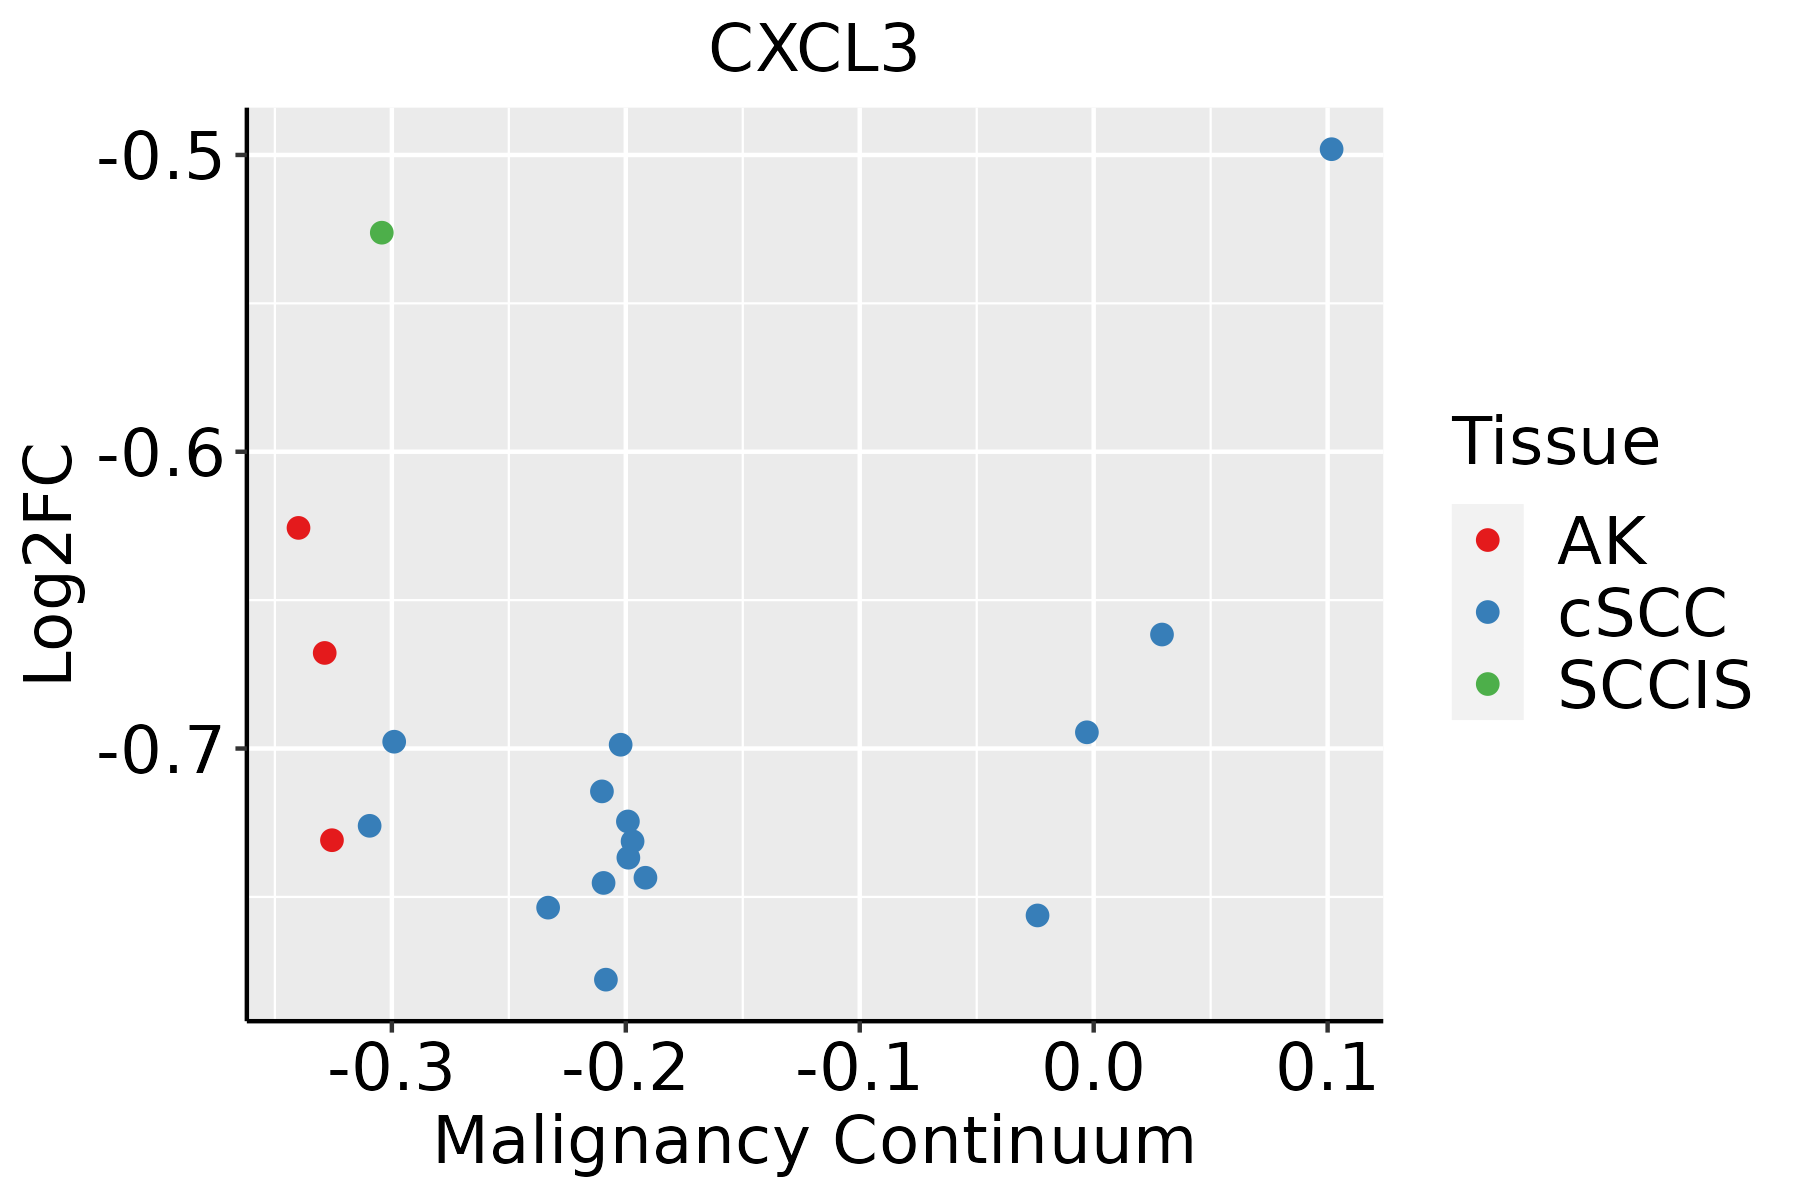 | AK: Actinic keratosis |
| cSCC: Cutaneous squamous cell carcinoma | ||
| SCCIS:squamous cell carcinoma in situ | ||
| Thyroid |  | ATC: Anaplastic thyroid cancer |
| HT: Hashimoto's thyroiditis | ||
| PTC: Papillary thyroid cancer |
| ∗log2FC in expression of this searched gene in stem-like cells from each diseased tissue sample relative to stem-like cells in normal samples in each tissue plotted against the malignancy continuum. Samples are colored based on if they are from different disease stage. |
Top |
Malignant transformation related pathway analysis |
| Find out the enriched GO biological processes and KEGG pathways involved in transition from healthy to precancer to cancer |
| Tissue | Disease Stage | Enriched GO biological Processes |
| Colorectum | AD |  |
| Colorectum | SER |  |
| Colorectum | MSS |  |
| Colorectum | MSI-H |  |
| Colorectum | FAP |  |
| ∗Top 15 enriched GO BP terms are showed in the bar plot of each disease state in each tissue. Each row represents a significant GO biological process which is colored according to the -log10(p.adjust). |
| Page: 1 2 3 4 5 6 7 8 9 |
| GO ID | Tissue | Disease Stage | Description | Gene Ratio | Bg Ratio | pvalue | p.adjust | Count |
| GO:00975297 | Breast | Precancer | myeloid leukocyte migration | 34/1080 | 220/18723 | 1.42e-07 | 7.82e-06 | 34 |
| GO:00509006 | Breast | Precancer | leukocyte migration | 47/1080 | 369/18723 | 2.82e-07 | 1.39e-05 | 47 |
| GO:00305956 | Breast | Precancer | leukocyte chemotaxis | 34/1080 | 230/18723 | 4.16e-07 | 1.89e-05 | 34 |
| GO:00603266 | Breast | Precancer | cell chemotaxis | 41/1080 | 310/18723 | 5.99e-07 | 2.55e-05 | 41 |
| GO:00716217 | Breast | Precancer | granulocyte chemotaxis | 23/1080 | 125/18723 | 6.73e-07 | 2.77e-05 | 23 |
| GO:00975307 | Breast | Precancer | granulocyte migration | 24/1080 | 148/18723 | 4.04e-06 | 1.26e-04 | 24 |
| GO:00305937 | Breast | Precancer | neutrophil chemotaxis | 19/1080 | 103/18723 | 5.94e-06 | 1.71e-04 | 19 |
| GO:00022378 | Breast | Precancer | response to molecule of bacterial origin | 43/1080 | 363/18723 | 6.05e-06 | 1.72e-04 | 43 |
| GO:00324968 | Breast | Precancer | response to lipopolysaccharide | 41/1080 | 343/18723 | 7.94e-06 | 2.17e-04 | 41 |
| GO:19902665 | Breast | Precancer | neutrophil migration | 20/1080 | 122/18723 | 2.13e-05 | 4.99e-04 | 20 |
| GO:00197307 | Breast | Precancer | antimicrobial humoral response | 19/1080 | 122/18723 | 7.02e-05 | 1.40e-03 | 19 |
| GO:00618446 | Breast | Precancer | antimicrobial humoral immune response mediated by antimicrobial peptide | 14/1080 | 79/18723 | 1.53e-04 | 2.61e-03 | 14 |
| GO:00712227 | Breast | Precancer | cellular response to lipopolysaccharide | 25/1080 | 209/18723 | 4.41e-04 | 5.85e-03 | 25 |
| GO:00712167 | Breast | Precancer | cellular response to biotic stimulus | 28/1080 | 246/18723 | 4.67e-04 | 6.14e-03 | 28 |
| GO:00712197 | Breast | Precancer | cellular response to molecule of bacterial origin | 25/1080 | 221/18723 | 1.00e-03 | 1.12e-02 | 25 |
| GO:007162111 | Breast | IDC | granulocyte chemotaxis | 26/1434 | 125/18723 | 2.36e-06 | 9.30e-05 | 26 |
| GO:005090011 | Breast | IDC | leukocyte migration | 54/1434 | 369/18723 | 3.10e-06 | 1.15e-04 | 54 |
| GO:009752911 | Breast | IDC | myeloid leukocyte migration | 37/1434 | 220/18723 | 4.65e-06 | 1.62e-04 | 37 |
| GO:003059511 | Breast | IDC | leukocyte chemotaxis | 38/1434 | 230/18723 | 5.36e-06 | 1.76e-04 | 38 |
| GO:003059311 | Breast | IDC | neutrophil chemotaxis | 22/1434 | 103/18723 | 8.82e-06 | 2.50e-04 | 22 |
| Page: 1 2 3 4 5 6 7 8 9 10 11 12 13 |
| Pathway ID | Tissue | Disease Stage | Description | Gene Ratio | Bg Ratio | pvalue | p.adjust | qvalue | Count |
| hsa0513414 | Breast | Precancer | Legionellosis | 19/684 | 57/8465 | 4.62e-08 | 9.12e-07 | 6.98e-07 | 19 |
| hsa0516718 | Breast | Precancer | Kaposi sarcoma-associated herpesvirus infection | 36/684 | 194/8465 | 1.68e-06 | 2.53e-05 | 1.94e-05 | 36 |
| hsa0541718 | Breast | Precancer | Lipid and atherosclerosis | 37/684 | 215/8465 | 7.64e-06 | 9.29e-05 | 7.12e-05 | 37 |
| hsa0465716 | Breast | Precancer | IL-17 signaling pathway | 20/684 | 94/8465 | 4.74e-05 | 4.54e-04 | 3.48e-04 | 20 |
| hsa0532312 | Breast | Precancer | Rheumatoid arthritis | 19/684 | 93/8465 | 1.30e-04 | 1.14e-03 | 8.73e-04 | 19 |
| hsa051206 | Breast | Precancer | Epithelial cell signaling in Helicobacter pylori infection | 14/684 | 70/8465 | 1.21e-03 | 7.99e-03 | 6.12e-03 | 14 |
| hsa0513415 | Breast | Precancer | Legionellosis | 19/684 | 57/8465 | 4.62e-08 | 9.12e-07 | 6.98e-07 | 19 |
| hsa0516719 | Breast | Precancer | Kaposi sarcoma-associated herpesvirus infection | 36/684 | 194/8465 | 1.68e-06 | 2.53e-05 | 1.94e-05 | 36 |
| hsa0541719 | Breast | Precancer | Lipid and atherosclerosis | 37/684 | 215/8465 | 7.64e-06 | 9.29e-05 | 7.12e-05 | 37 |
| hsa0465717 | Breast | Precancer | IL-17 signaling pathway | 20/684 | 94/8465 | 4.74e-05 | 4.54e-04 | 3.48e-04 | 20 |
| hsa0532313 | Breast | Precancer | Rheumatoid arthritis | 19/684 | 93/8465 | 1.30e-04 | 1.14e-03 | 8.73e-04 | 19 |
| hsa0512013 | Breast | Precancer | Epithelial cell signaling in Helicobacter pylori infection | 14/684 | 70/8465 | 1.21e-03 | 7.99e-03 | 6.12e-03 | 14 |
| hsa0513422 | Breast | IDC | Legionellosis | 19/867 | 57/8465 | 1.89e-06 | 3.07e-05 | 2.29e-05 | 19 |
| hsa0516723 | Breast | IDC | Kaposi sarcoma-associated herpesvirus infection | 38/867 | 194/8465 | 5.87e-05 | 5.96e-04 | 4.46e-04 | 38 |
| hsa0532321 | Breast | IDC | Rheumatoid arthritis | 21/867 | 93/8465 | 3.69e-04 | 3.15e-03 | 2.36e-03 | 21 |
| hsa0512022 | Breast | IDC | Epithelial cell signaling in Helicobacter pylori infection | 16/867 | 70/8465 | 1.56e-03 | 1.13e-02 | 8.42e-03 | 16 |
| hsa0541724 | Breast | IDC | Lipid and atherosclerosis | 35/867 | 215/8465 | 3.67e-03 | 2.29e-02 | 1.71e-02 | 35 |
| hsa0465721 | Breast | IDC | IL-17 signaling pathway | 18/867 | 94/8465 | 6.39e-03 | 3.30e-02 | 2.47e-02 | 18 |
| hsa0513432 | Breast | IDC | Legionellosis | 19/867 | 57/8465 | 1.89e-06 | 3.07e-05 | 2.29e-05 | 19 |
| hsa0516733 | Breast | IDC | Kaposi sarcoma-associated herpesvirus infection | 38/867 | 194/8465 | 5.87e-05 | 5.96e-04 | 4.46e-04 | 38 |
| Page: 1 2 3 4 5 6 7 8 9 10 11 12 13 |
Top |
Cell-cell communication analysis |
| Identification of potential cell-cell interactions between two cell types and their ligand-receptor pairs for different disease states |
| Ligand | Receptor | LRpair | Pathway | Tissue | Disease Stage |
| CXCL3 | ACKR1 | CXCL3_ACKR1 | CXCL | Breast | DCIS |
| CXCL3 | ACKR1 | CXCL3_ACKR1 | CXCL | Breast | IDC |
| CXCL3 | ACKR1 | CXCL3_ACKR1 | CXCL | Cervix | ADJ |
| CXCL3 | CXCR2 | CXCL3_CXCR2 | CXCL | Cervix | ADJ |
| CXCL3 | ACKR1 | CXCL3_ACKR1 | CXCL | Cervix | CC |
| CXCL3 | CXCR1 | CXCL3_CXCR1 | CXCL | Cervix | CC |
| CXCL3 | CXCR2 | CXCL3_CXCR2 | CXCL | Cervix | CC |
| CXCL3 | CXCR1 | CXCL3_CXCR1 | CXCL | Cervix | Healthy |
| CXCL3 | CXCR2 | CXCL3_CXCR2 | CXCL | Cervix | Healthy |
| CXCL3 | ACKR1 | CXCL3_ACKR1 | CXCL | Cervix | Precancer |
| CXCL3 | CXCR1 | CXCL3_CXCR1 | CXCL | Cervix | Precancer |
| CXCL3 | CXCR2 | CXCL3_CXCR2 | CXCL | Cervix | Precancer |
| CXCL3 | ACKR1 | CXCL3_ACKR1 | CXCL | Endometrium | ADJ |
| CXCL3 | ACKR1 | CXCL3_ACKR1 | CXCL | Endometrium | AEH |
| CXCL3 | ACKR1 | CXCL3_ACKR1 | CXCL | Endometrium | EEC |
| CXCL3 | CXCR2 | CXCL3_CXCR2 | CXCL | Endometrium | EEC |
| CXCL3 | ACKR1 | CXCL3_ACKR1 | CXCL | Endometrium | Healthy |
| CXCL3 | ACKR1 | CXCL3_ACKR1 | CXCL | Esophagus | ESCC |
| CXCL3 | ACKR1 | CXCL3_ACKR1 | CXCL | Esophagus | Healthy |
| CXCL3 | ACKR1 | CXCL3_ACKR1 | CXCL | GC | ADJ |
| Page: 1 2 3 |
Top |
Single-cell gene regulatory network inference analysis |
| Find out the significant the regulons (TFs) and the target genes of each regulon across cell types for different disease states |
| TF | Cell Type | Tissue | Disease Stage | Target Gene | RSS | Regulon Activity |
| ∗The dot plots of a searched regulon are shown for all cell subpopulations in each disease state of each tissue based on the regulon specific score inferred using pySCENIC and by calculating the average expression. |
| Page: 1 |
Top |
Somatic mutation of malignant transformation related genes |
| Annotation of somatic variants for genes involved in malignant transformation |
| Hugo Symbol | Variant Class | Variant Classification | dbSNP RS | HGVSc | HGVSp | HGVSp Short | SWISSPROT | BIOTYPE | SIFT | PolyPhen | Tumor Sample Barcode | Tissue | Histology | Sex | Age | Stage | Therapy Types | Drugs | Outcome |
| CXCL3 | SNV | Missense_Mutation | novel | c.92G>A | p.Arg31His | p.R31H | P19876 | protein_coding | tolerated(0.21) | probably_damaging(0.987) | TCGA-AJ-A8CW-01 | Endometrium | uterine corpus endometrioid carcinoma | Female | <65 | I/II | Unknown | Unknown | SD |
| CXCL3 | SNV | Missense_Mutation | c.141N>T | p.Gln47His | p.Q47H | P19876 | protein_coding | deleterious(0.01) | probably_damaging(0.979) | TCGA-AP-A1DV-01 | Endometrium | uterine corpus endometrioid carcinoma | Female | <65 | I/II | Unknown | Unknown | SD | |
| CXCL3 | SNV | Missense_Mutation | novel | c.314G>T | p.Ser105Ile | p.S105I | P19876 | protein_coding | tolerated(0.11) | benign(0.07) | TCGA-AP-A1E0-01 | Endometrium | uterine corpus endometrioid carcinoma | Female | <65 | III/IV | Chemotherapy | paclitaxel | SD |
| CXCL3 | SNV | Missense_Mutation | novel | c.283A>C | p.Lys95Gln | p.K95Q | P19876 | protein_coding | deleterious(0) | probably_damaging(0.983) | TCGA-B5-A1MR-01 | Endometrium | uterine corpus endometrioid carcinoma | Female | >=65 | III/IV | Unknown | Unknown | SD |
| CXCL3 | SNV | Missense_Mutation | rs759175981 | c.265N>A | p.Ala89Thr | p.A89T | P19876 | protein_coding | tolerated(0.18) | benign(0.021) | TCGA-BG-A0M4-01 | Endometrium | uterine corpus endometrioid carcinoma | Female | <65 | I/II | Chemotherapy | carboplatin | SD |
| CXCL3 | SNV | Missense_Mutation | novel | c.103G>A | p.Ala35Thr | p.A35T | P19876 | protein_coding | deleterious(0.05) | probably_damaging(0.996) | TCGA-E6-A1LX-01 | Endometrium | uterine corpus endometrioid carcinoma | Female | <65 | I/II | Unknown | Unknown | SD |
| CXCL3 | SNV | Missense_Mutation | novel | c.152N>T | p.Gly51Val | p.G51V | P19876 | protein_coding | deleterious(0) | probably_damaging(0.999) | TCGA-EO-A22R-01 | Endometrium | uterine corpus endometrioid carcinoma | Female | <65 | I/II | Unknown | Unknown | SD |
| CXCL3 | SNV | Missense_Mutation | novel | c.157N>T | p.His53Tyr | p.H53Y | P19876 | protein_coding | deleterious(0) | probably_damaging(0.968) | TCGA-CV-7427-01 | Oral cavity | head & neck squamous cell carcinoma | Female | >=65 | I/II | Unknown | Unknown | PD |
| Page: 1 |
Top |
Related drugs of malignant transformation related genes |
| Identification of chemicals and drugs interact with genes involved in malignant transfromation |
| (DGIdb 4.0) |
| Entrez ID | Symbol | Category | Interaction Types | Drug Claim Name | Drug Name | PMIDs |
| Page: 1 |

Copyright 2023-Present -The University of Texas Health Science Center at Houston |