| Tissue | Expression Dynamics | Abbreviation |
| Breast |  | IDC: Invasive ductal carcinoma |
| DCIS: Ductal carcinoma in situ |
| Precancer(BRCA1-mut): Precancerous lesion from BRCA1 mutation carriers |
| Cervix | 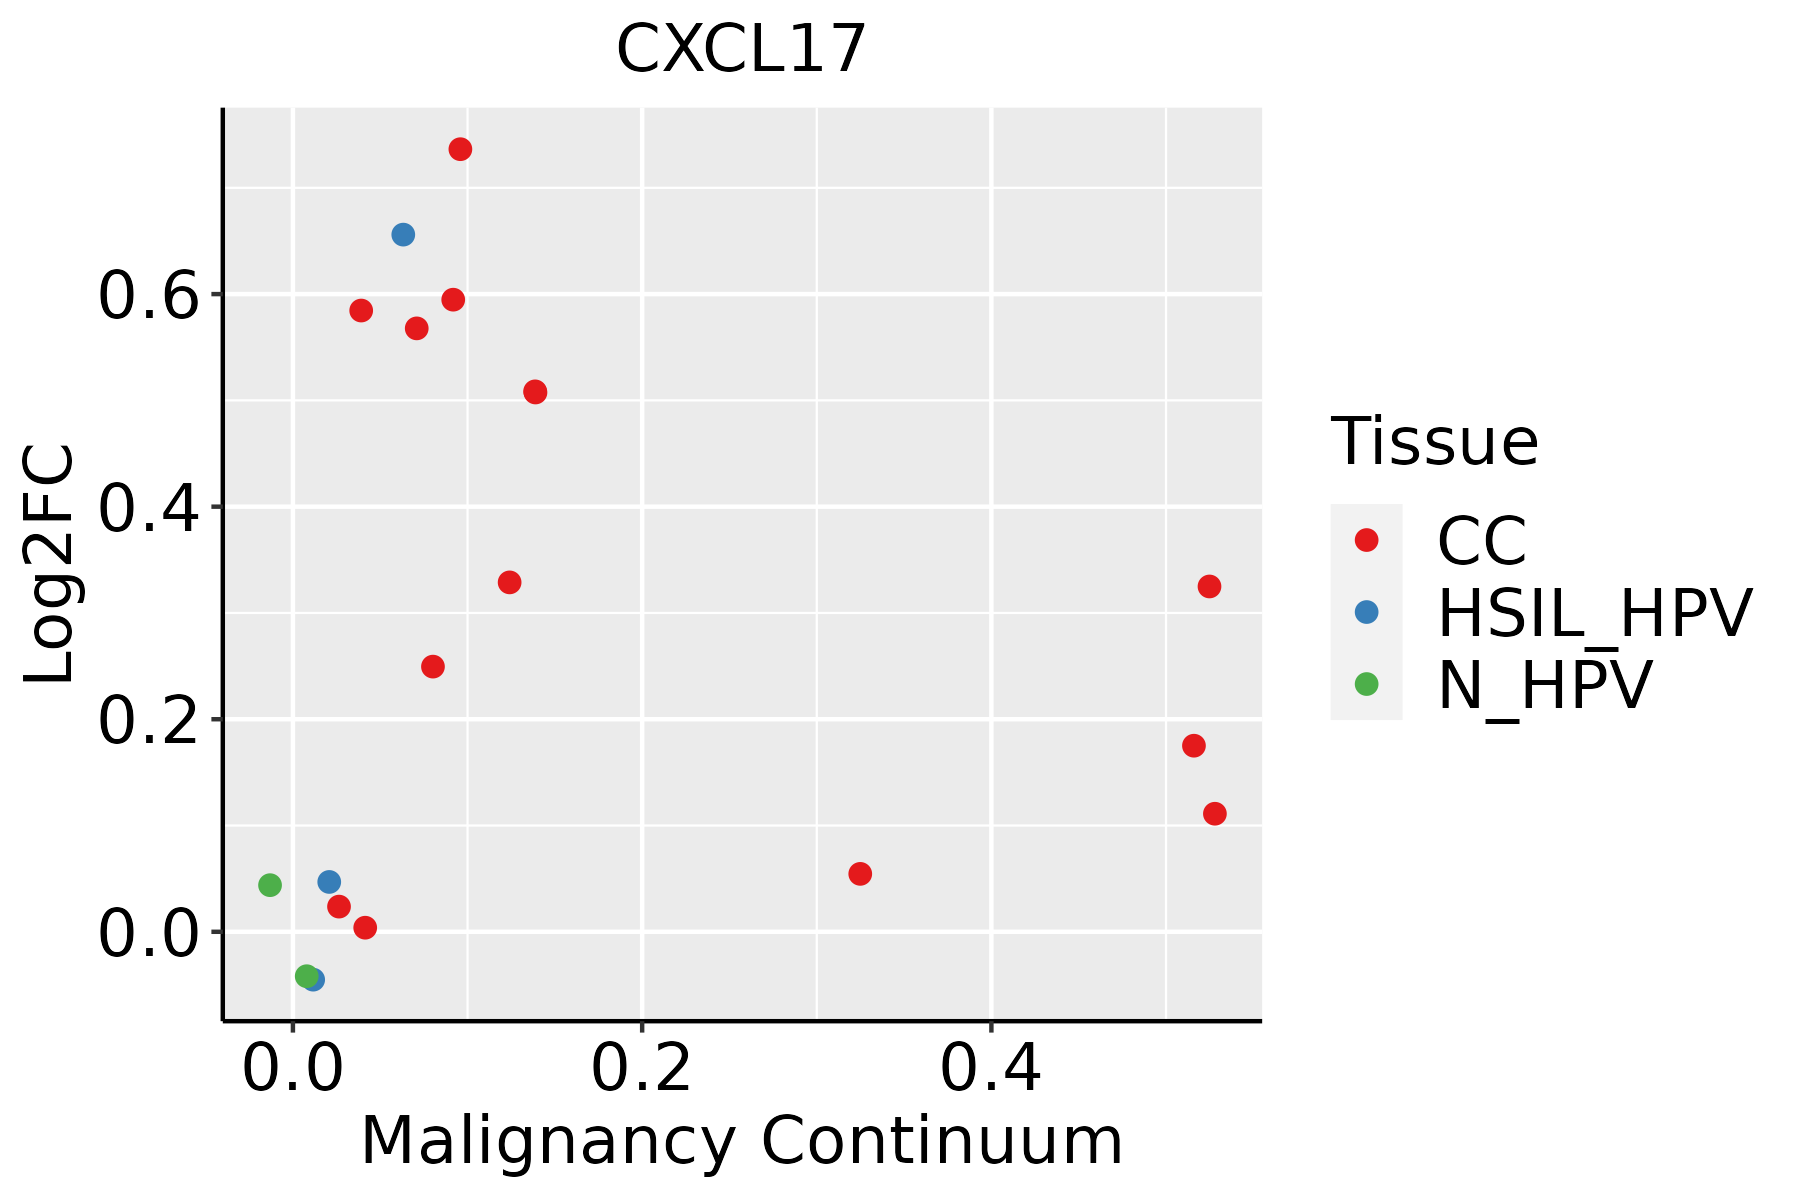 | CC: Cervix cancer |
| HSIL_HPV: HPV-infected high-grade squamous intraepithelial lesions |
| N_HPV: HPV-infected normal cervix |
| Esophagus |  | ESCC: Esophageal squamous cell carcinoma |
| HGIN: High-grade intraepithelial neoplasias |
| LGIN: Low-grade intraepithelial neoplasias |
| GC |  | CAG: Chronic atrophic gastritis |
| CAG with IM: Chronic atrophic gastritis with intestinal metaplasia |
| CSG: Chronic superficial gastritis |
| GC: Gastric cancer |
| SIM: Severe intestinal metaplasia |
| WIM: Wild intestinal metaplasia |
| Liver | 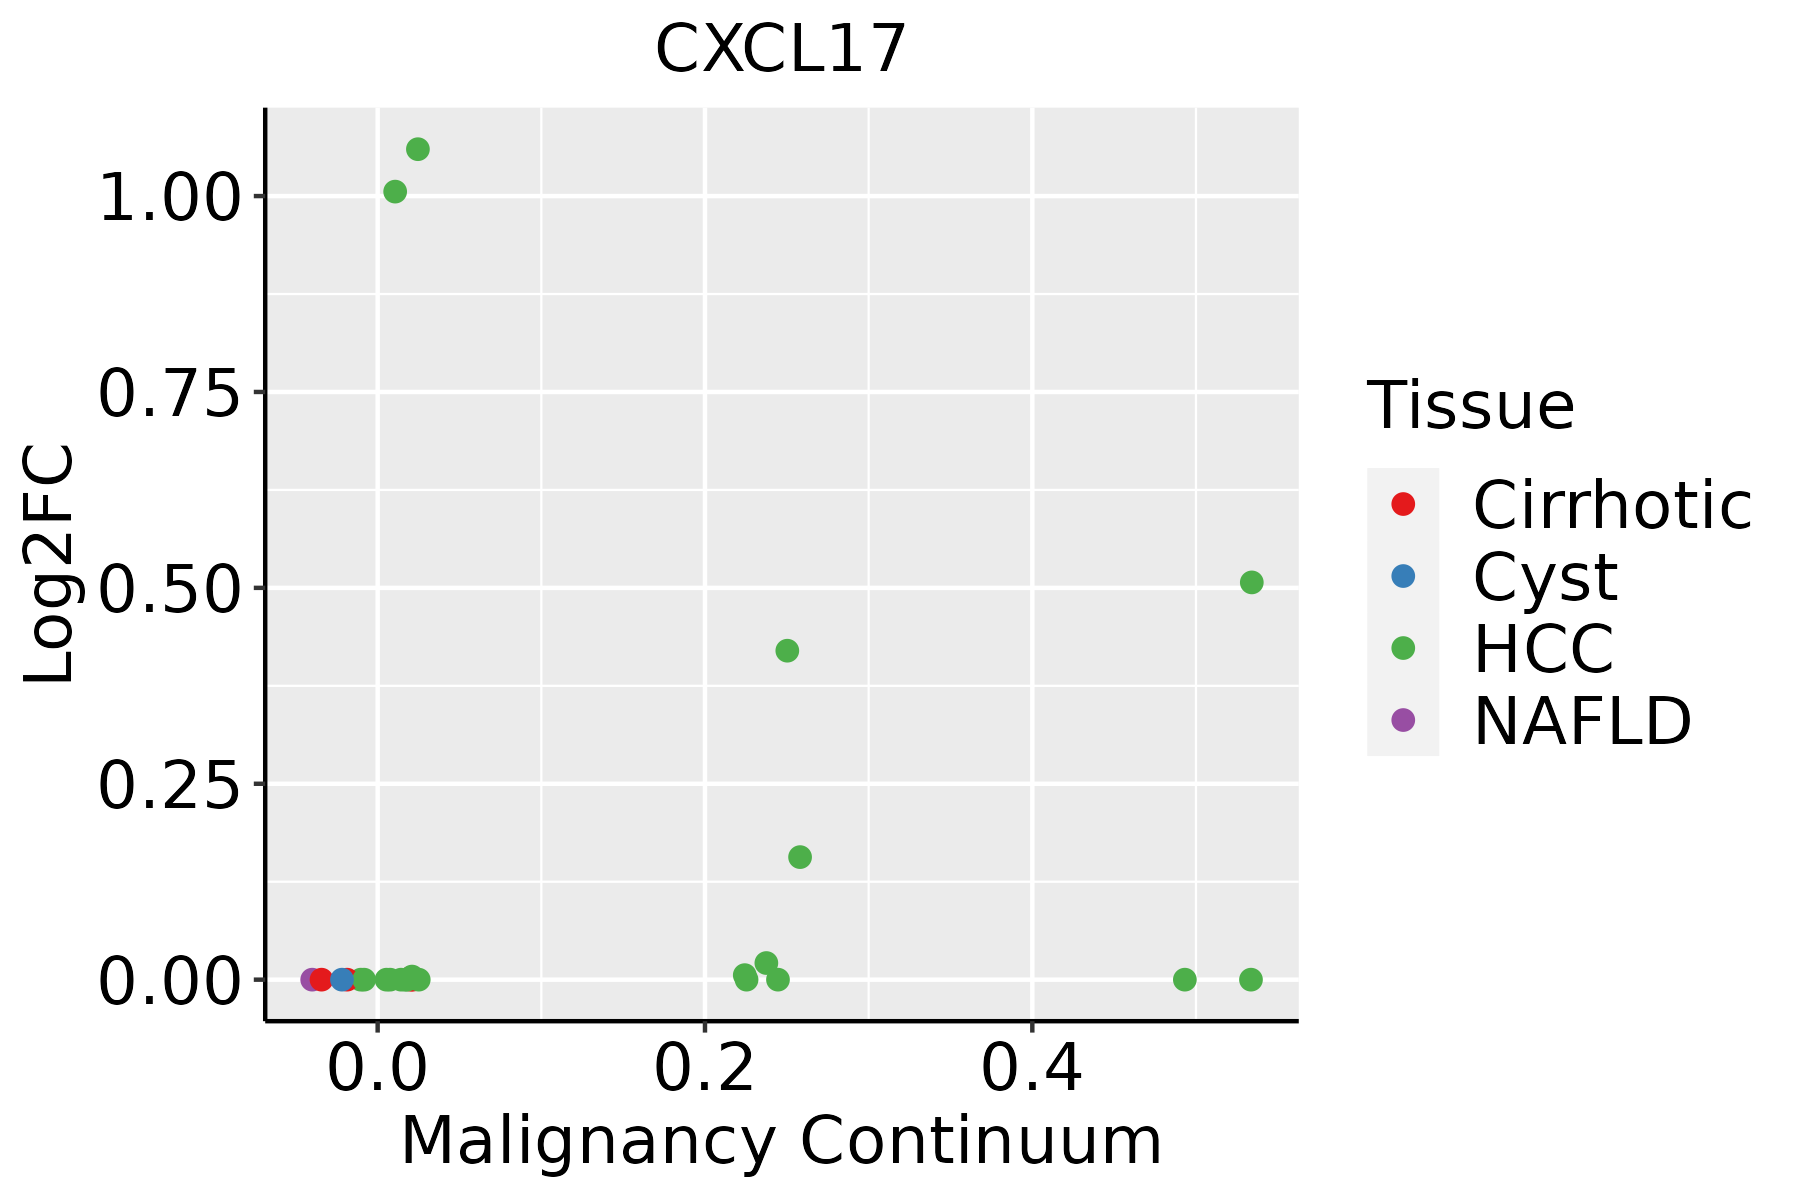 | HCC: Hepatocellular carcinoma |
| NAFLD: Non-alcoholic fatty liver disease |
| Lung |  | AAH: Atypical adenomatous hyperplasia |
| AIS: Adenocarcinoma in situ |
| IAC: Invasive lung adenocarcinoma |
| MIA: Minimally invasive adenocarcinoma |
| Oral Cavity | 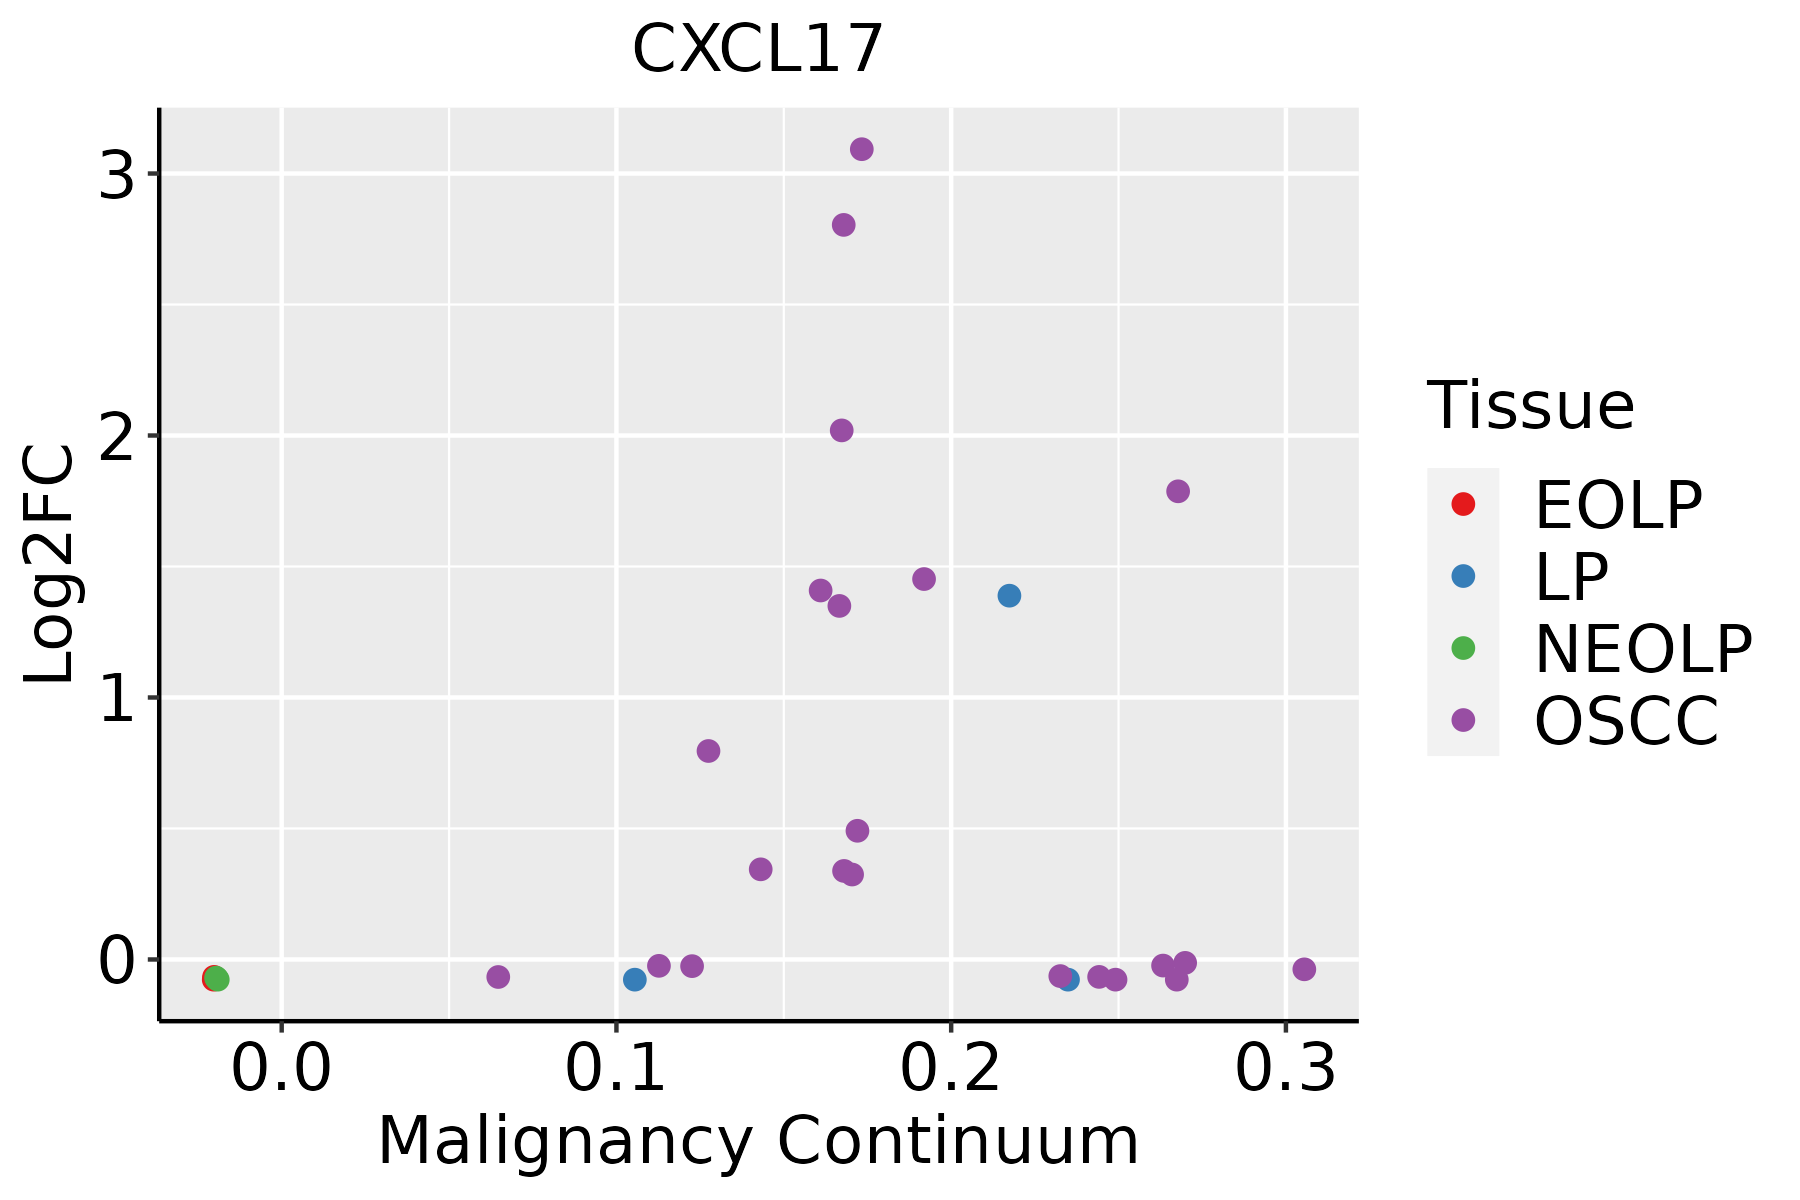 | EOLP: Erosive Oral lichen planus |
| LP: leukoplakia |
| NEOLP: Non-erosive oral lichen planus |
| OSCC: Oral squamous cell carcinoma |
| GO ID | Tissue | Disease Stage | Description | Gene Ratio | Bg Ratio | pvalue | p.adjust | Count |
| GO:00975297 | Breast | Precancer | myeloid leukocyte migration | 34/1080 | 220/18723 | 1.42e-07 | 7.82e-06 | 34 |
| GO:00509006 | Breast | Precancer | leukocyte migration | 47/1080 | 369/18723 | 2.82e-07 | 1.39e-05 | 47 |
| GO:00305956 | Breast | Precancer | leukocyte chemotaxis | 34/1080 | 230/18723 | 4.16e-07 | 1.89e-05 | 34 |
| GO:00603266 | Breast | Precancer | cell chemotaxis | 41/1080 | 310/18723 | 5.99e-07 | 2.55e-05 | 41 |
| GO:00716217 | Breast | Precancer | granulocyte chemotaxis | 23/1080 | 125/18723 | 6.73e-07 | 2.77e-05 | 23 |
| GO:00975307 | Breast | Precancer | granulocyte migration | 24/1080 | 148/18723 | 4.04e-06 | 1.26e-04 | 24 |
| GO:00018196 | Breast | Precancer | positive regulation of cytokine production | 52/1080 | 467/18723 | 4.18e-06 | 1.29e-04 | 52 |
| GO:0050727 | Breast | Precancer | regulation of inflammatory response | 44/1080 | 386/18723 | 1.26e-05 | 3.22e-04 | 44 |
| GO:00321034 | Breast | Precancer | positive regulation of response to external stimulus | 46/1080 | 427/18723 | 3.41e-05 | 7.40e-04 | 46 |
| GO:00026856 | Breast | Precancer | regulation of leukocyte migration | 27/1080 | 210/18723 | 7.93e-05 | 1.54e-03 | 27 |
| GO:00482463 | Breast | Precancer | macrophage chemotaxis | 9/1080 | 38/18723 | 2.44e-04 | 3.66e-03 | 9 |
| GO:19055173 | Breast | Precancer | macrophage migration | 11/1080 | 55/18723 | 2.57e-04 | 3.83e-03 | 11 |
| GO:00716744 | Breast | Precancer | mononuclear cell migration | 24/1080 | 196/18723 | 4.03e-04 | 5.44e-03 | 24 |
| GO:00026887 | Breast | Precancer | regulation of leukocyte chemotaxis | 17/1080 | 122/18723 | 6.34e-04 | 7.86e-03 | 17 |
| GO:00026877 | Breast | Precancer | positive regulation of leukocyte migration | 18/1080 | 135/18723 | 7.60e-04 | 9.04e-03 | 18 |
| GO:00716774 | Breast | Precancer | positive regulation of mononuclear cell migration | 11/1080 | 65/18723 | 1.13e-03 | 1.25e-02 | 11 |
| GO:00025483 | Breast | Precancer | monocyte chemotaxis | 11/1080 | 70/18723 | 2.11e-03 | 2.00e-02 | 11 |
| GO:00026905 | Breast | Precancer | positive regulation of leukocyte chemotaxis | 13/1080 | 94/18723 | 2.83e-03 | 2.49e-02 | 13 |
| GO:00509212 | Breast | Precancer | positive regulation of chemotaxis | 17/1080 | 141/18723 | 3.15e-03 | 2.65e-02 | 17 |
| GO:00509201 | Breast | Precancer | regulation of chemotaxis | 23/1080 | 223/18723 | 5.05e-03 | 3.80e-02 | 23 |
| Hugo Symbol | Variant Class | Variant Classification | dbSNP RS | HGVSc | HGVSp | HGVSp Short | SWISSPROT | BIOTYPE | SIFT | PolyPhen | Tumor Sample Barcode | Tissue | Histology | Sex | Age | Stage | Therapy Types | Drugs | Outcome |
| CXCL17 | SNV | Missense_Mutation | novel | c.281N>A | p.Arg94Lys | p.R94K | Q6UXB2 | protein_coding | tolerated(0.22) | benign(0.011) | TCGA-PE-A5DE-01 | Breast | breast invasive carcinoma | Female | <65 | I/II | Chemotherapy | taxotere | CR |
| CXCL17 | insertion | Frame_Shift_Ins | novel | c.3_4insTCTACTA | p.Lys2SerfsTer23 | p.K2Sfs*23 | Q6UXB2 | protein_coding | | | TCGA-BH-A0B4-01 | Breast | breast invasive carcinoma | Male | >=65 | III/IV | Hormone Therapy | tamoxiphen | SD |
| CXCL17 | SNV | Missense_Mutation | | c.115N>A | p.Ser39Thr | p.S39T | Q6UXB2 | protein_coding | deleterious(0.03) | benign(0.157) | TCGA-AA-3930-01 | Colorectum | colon adenocarcinoma | Male | >=65 | III/IV | Chemotherapy | capecitabine | PD |
| CXCL17 | SNV | Missense_Mutation | novel | c.22N>A | p.Leu8Ile | p.L8I | Q6UXB2 | protein_coding | tolerated_low_confidence(0.1) | benign(0.199) | TCGA-AP-A1DV-01 | Endometrium | uterine corpus endometrioid carcinoma | Female | <65 | I/II | Unknown | Unknown | SD |
| CXCL17 | SNV | Missense_Mutation | novel | c.25C>A | p.Leu9Ile | p.L9I | Q6UXB2 | protein_coding | tolerated_low_confidence(0.1) | probably_damaging(0.992) | TCGA-B5-A3FA-01 | Endometrium | uterine corpus endometrioid carcinoma | Female | >=65 | I/II | Unknown | Unknown | SD |
| CXCL17 | SNV | Missense_Mutation | novel | c.65G>A | p.Ser22Asn | p.S22N | Q6UXB2 | protein_coding | tolerated_low_confidence(0.06) | probably_damaging(0.994) | TCGA-63-A5MM-01 | Lung | lung squamous cell carcinoma | Female | >=65 | I/II | Chemotherapy | cisplatin | PD |
| CXCL17 | SNV | Missense_Mutation | novel | c.98N>A | p.Arg33Lys | p.R33K | Q6UXB2 | protein_coding | tolerated(0.43) | benign(0.011) | TCGA-90-A4ED-01 | Lung | lung squamous cell carcinoma | Male | >=65 | I/II | Unknown | Unknown | SD |
| CXCL17 | SNV | Missense_Mutation | novel | c.277C>A | p.His93Asn | p.H93N | Q6UXB2 | protein_coding | deleterious(0.01) | benign(0.372) | TCGA-HU-A4GN-01 | Stomach | stomach adenocarcinoma | Male | <65 | I/II | Chemotherapy | mitomycin | PD |


