
|
|||||
|
 | |
| |
| |
| |
| |
| |
|
Gene: CXCL16 |
Gene summary for CXCL16 |
| Gene information | Species | Human | Gene symbol | CXCL16 | Gene ID | 58191 |
| Gene name | C-X-C motif chemokine ligand 16 | |
| Gene Alias | CXCLG16 | |
| Cytomap | 17p13.2 | |
| Gene Type | protein-coding | GO ID | GO:0001558 | UniProtAcc | Q9H2A7 |
Top |
Malignant transformation analysis |
| Identification of the aberrant gene expression in precancerous and cancerous lesions by comparing the gene expression of stem-like cells in diseased tissues with normal stem cells |
| Entrez ID | Symbol | Replicates | Species | Organ | Tissue | Adj P-value | Log2FC | Malignancy |
| 58191 | CXCL16 | HTA11_3410_2000001011 | Human | Colorectum | AD | 1.91e-08 | 2.26e-01 | 0.0155 |
| 58191 | CXCL16 | HTA11_2487_2000001011 | Human | Colorectum | SER | 2.76e-06 | 3.24e-01 | -0.1808 |
| 58191 | CXCL16 | HTA11_1938_2000001011 | Human | Colorectum | AD | 3.09e-14 | 5.65e-01 | -0.0811 |
| 58191 | CXCL16 | HTA11_78_2000001011 | Human | Colorectum | AD | 3.82e-08 | 2.82e-01 | -0.1088 |
| 58191 | CXCL16 | HTA11_347_2000001011 | Human | Colorectum | AD | 3.78e-03 | 1.07e-01 | -0.1954 |
| 58191 | CXCL16 | HTA11_411_2000001011 | Human | Colorectum | SER | 3.51e-11 | 9.13e-01 | -0.2602 |
| 58191 | CXCL16 | HTA11_1391_2000001011 | Human | Colorectum | AD | 1.63e-11 | 4.26e-01 | -0.059 |
| 58191 | CXCL16 | HTA11_2992_2000001011 | Human | Colorectum | SER | 5.97e-06 | 3.41e-01 | -0.1706 |
| 58191 | CXCL16 | HTA11_866_3004761011 | Human | Colorectum | AD | 1.90e-09 | 3.25e-01 | 0.096 |
| 58191 | CXCL16 | HTA11_8622_2000001021 | Human | Colorectum | SER | 4.01e-04 | 2.10e-01 | 0.0528 |
| 58191 | CXCL16 | HTA11_10711_2000001011 | Human | Colorectum | AD | 4.42e-02 | 1.48e-01 | 0.0338 |
| 58191 | CXCL16 | HTA11_7696_3000711011 | Human | Colorectum | AD | 1.61e-18 | 4.14e-01 | 0.0674 |
| 58191 | CXCL16 | HTA11_6818_2000001011 | Human | Colorectum | AD | 1.21e-02 | 2.22e-01 | 0.0112 |
| 58191 | CXCL16 | HTA11_99999970781_79442 | Human | Colorectum | MSS | 6.79e-13 | 4.06e-01 | 0.294 |
| 58191 | CXCL16 | HTA11_99999965062_69753 | Human | Colorectum | MSI-H | 7.56e-03 | 6.63e-01 | 0.3487 |
| 58191 | CXCL16 | HTA11_99999965104_69814 | Human | Colorectum | MSS | 3.64e-12 | 2.62e-01 | 0.281 |
| 58191 | CXCL16 | HTA11_99999971662_82457 | Human | Colorectum | MSS | 3.00e-14 | 4.12e-01 | 0.3859 |
| 58191 | CXCL16 | HTA11_99999973899_84307 | Human | Colorectum | MSS | 1.84e-06 | 4.44e-01 | 0.2585 |
| 58191 | CXCL16 | HTA11_99999974143_84620 | Human | Colorectum | MSS | 1.98e-04 | 1.46e-01 | 0.3005 |
| 58191 | CXCL16 | LZE4T | Human | Esophagus | ESCC | 9.56e-04 | 6.32e-02 | 0.0811 |
| Page: 1 2 3 4 5 6 |
| Tissue | Expression Dynamics | Abbreviation |
| Colorectum (GSE201348) |  | FAP: Familial adenomatous polyposis |
| CRC: Colorectal cancer | ||
| Colorectum (HTA11) | 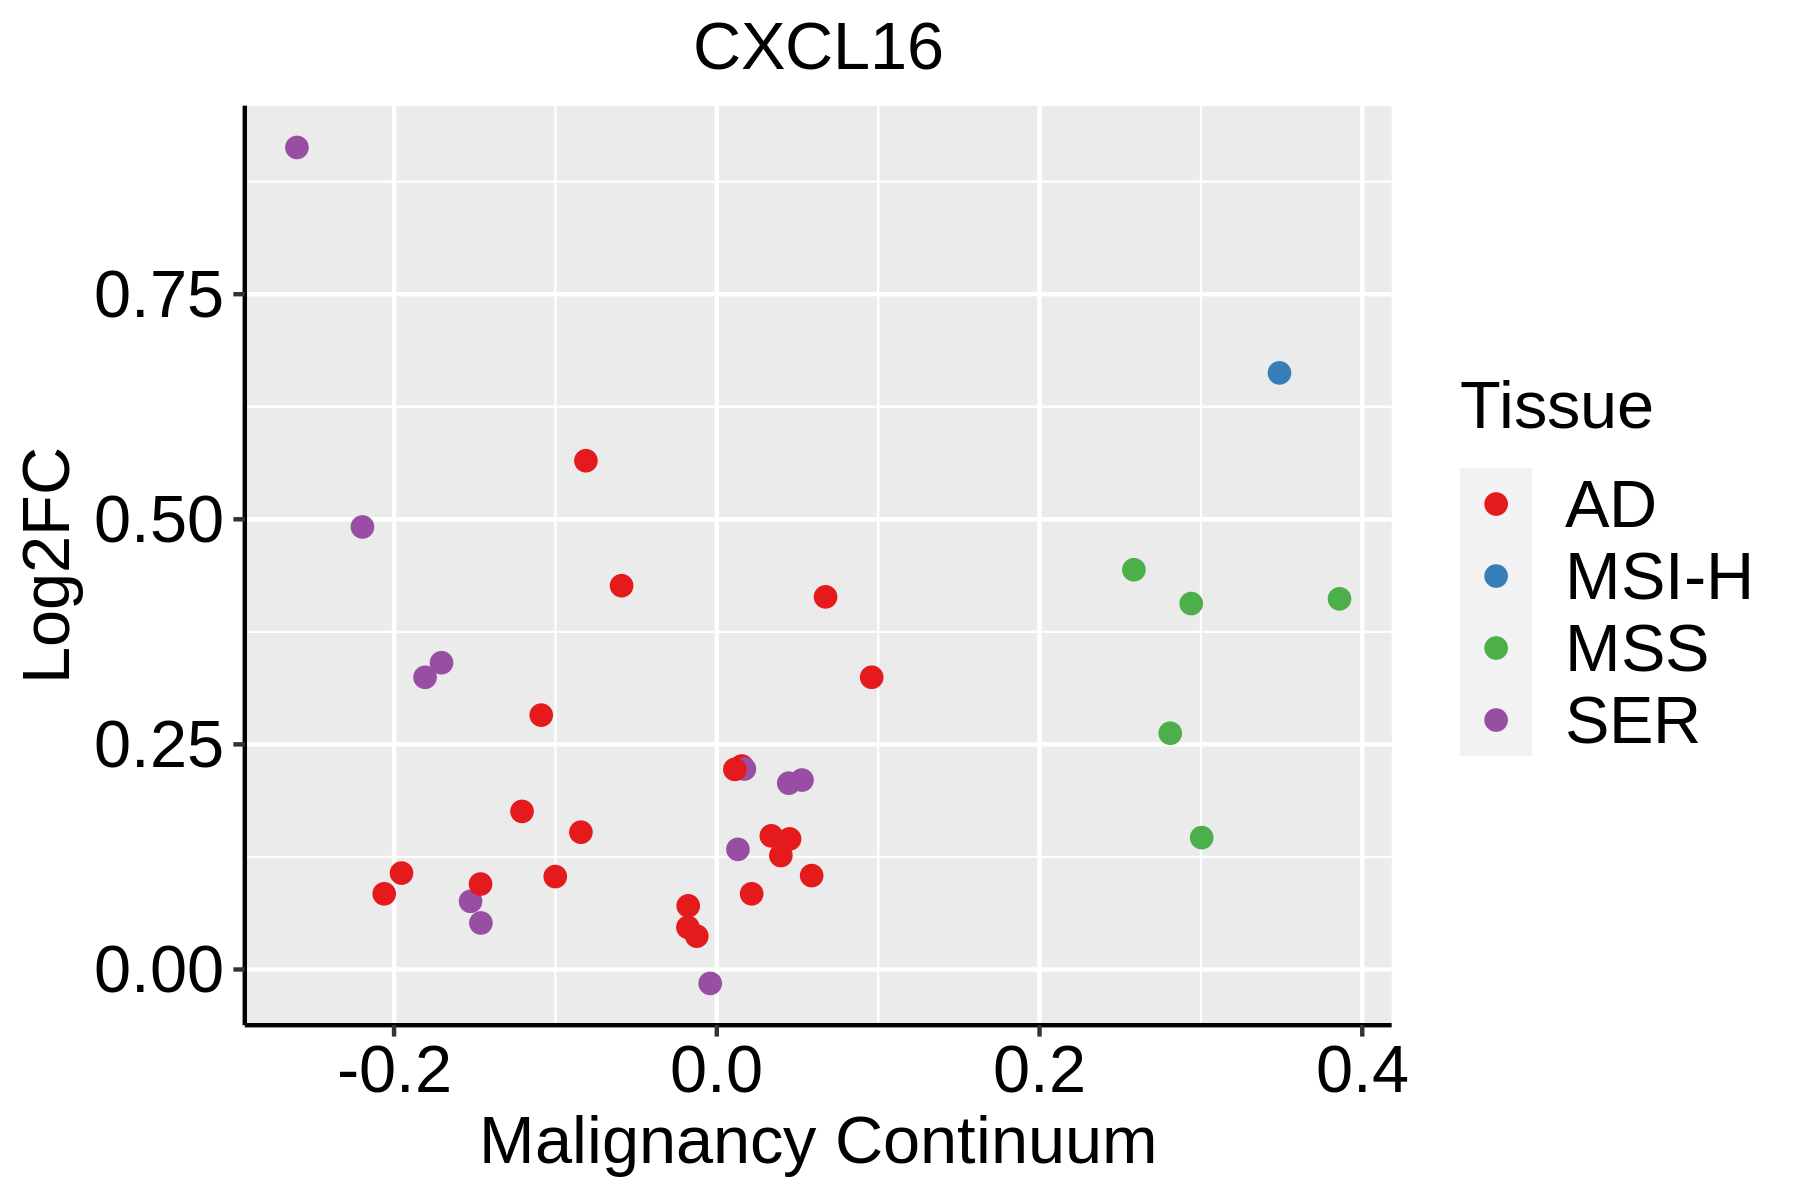 | AD: Adenomas |
| SER: Sessile serrated lesions | ||
| MSI-H: Microsatellite-high colorectal cancer | ||
| MSS: Microsatellite stable colorectal cancer | ||
| Esophagus | 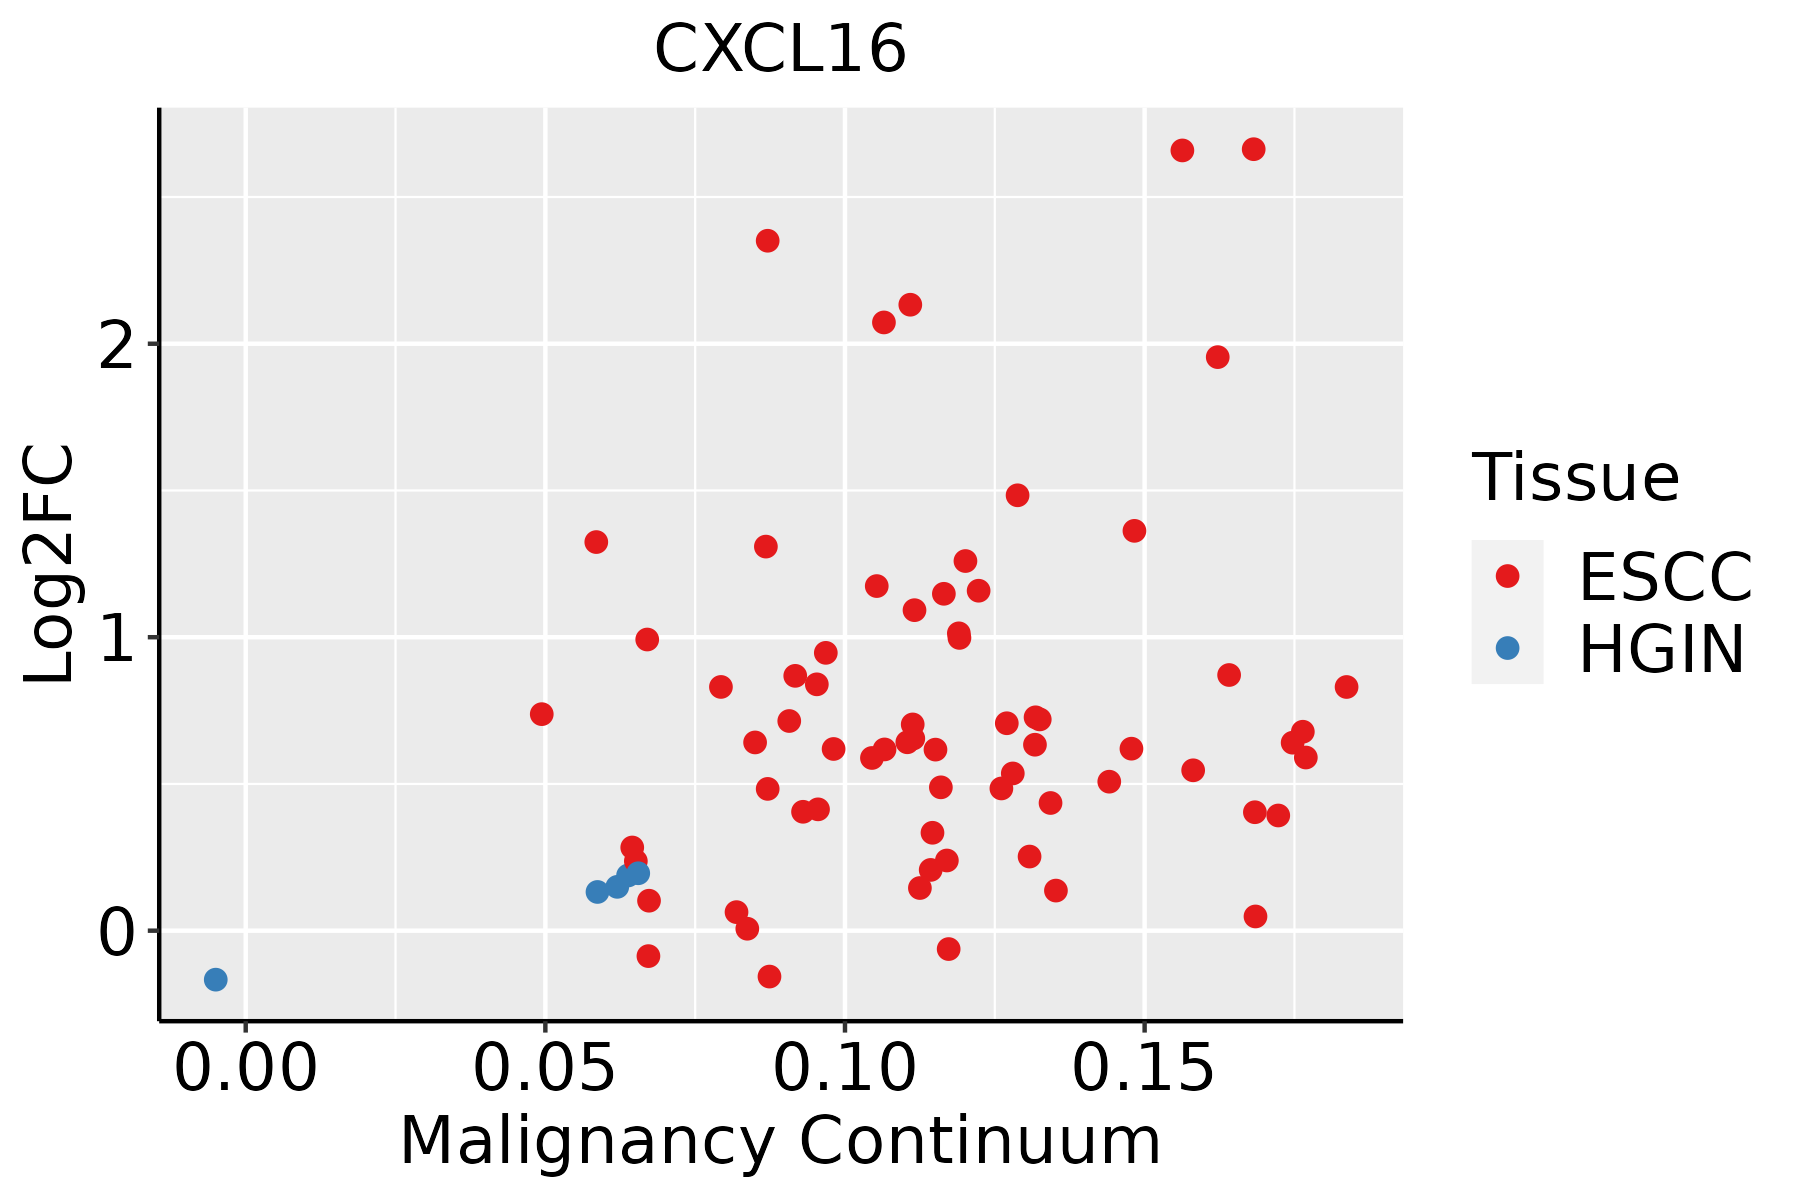 | ESCC: Esophageal squamous cell carcinoma |
| HGIN: High-grade intraepithelial neoplasias | ||
| LGIN: Low-grade intraepithelial neoplasias | ||
| Liver | 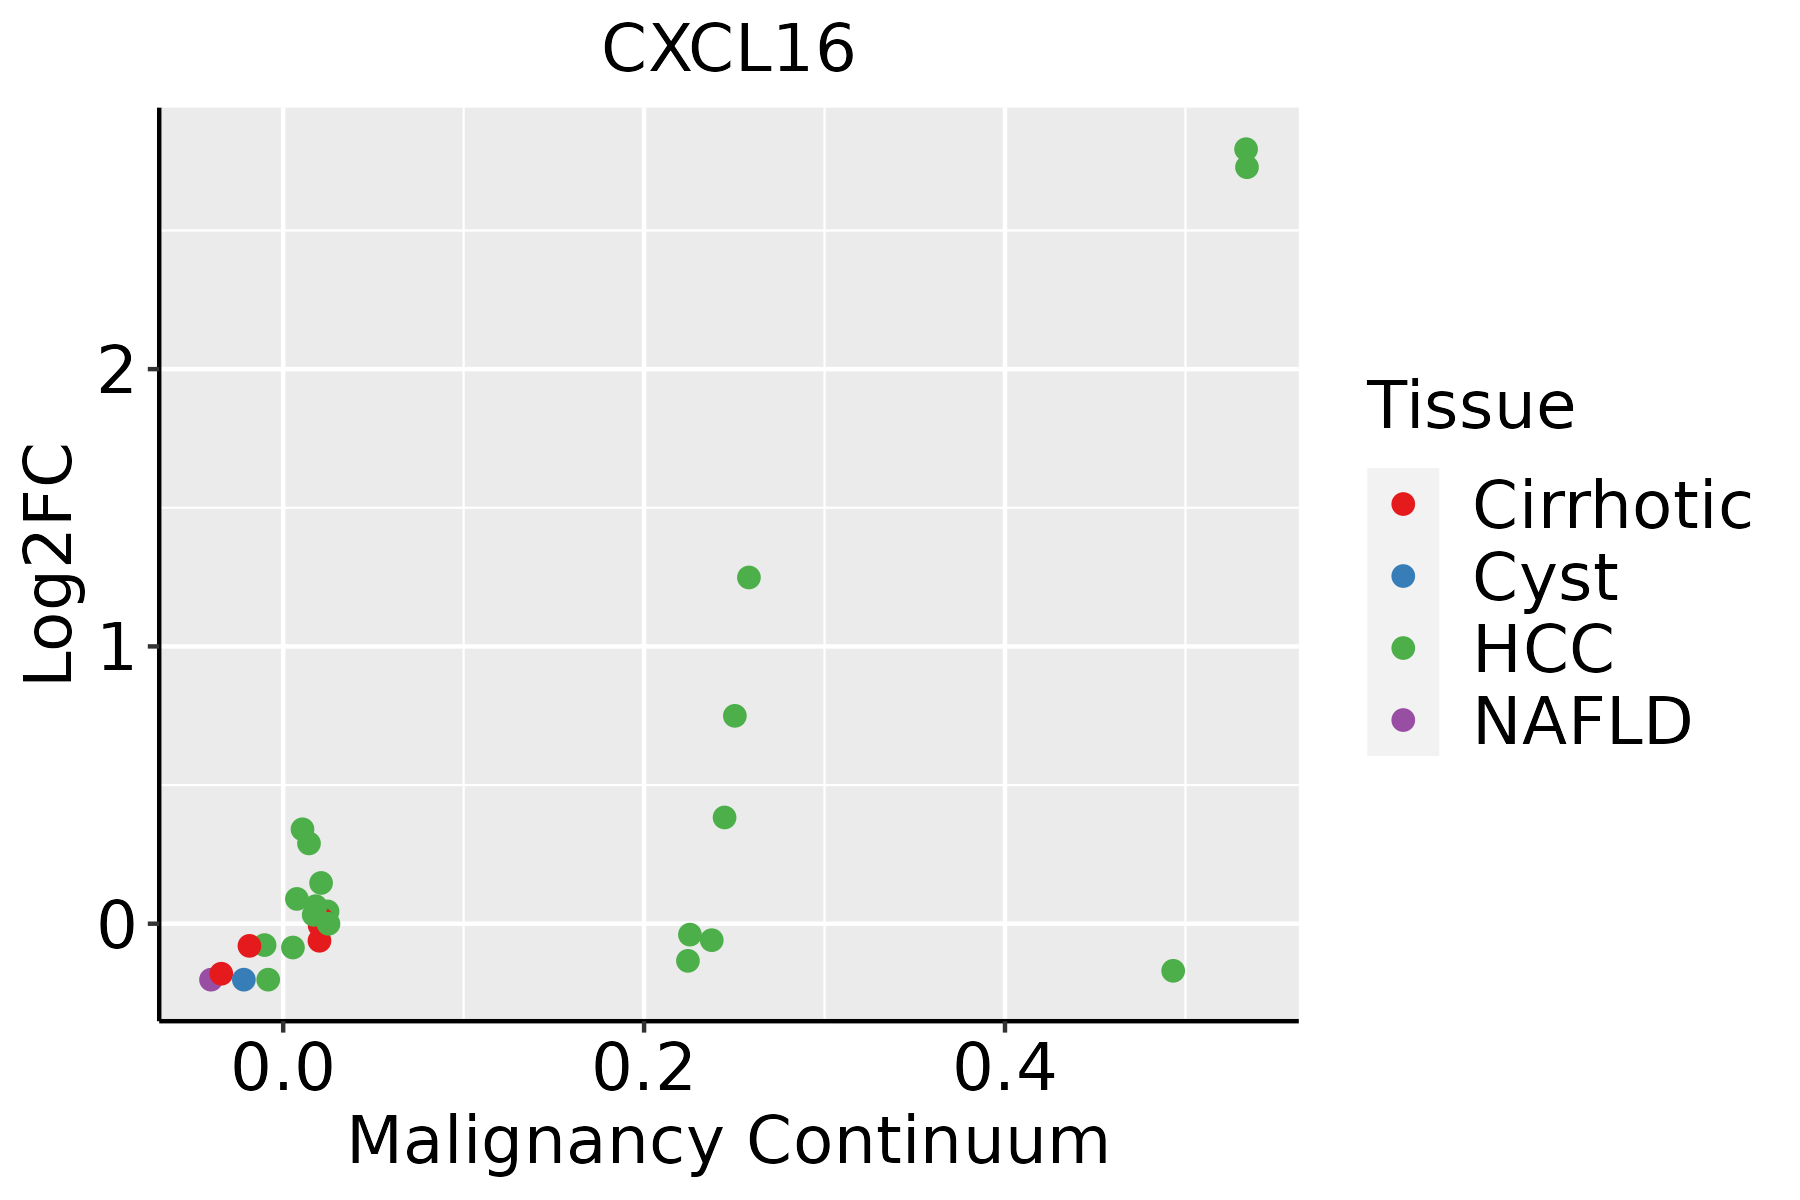 | HCC: Hepatocellular carcinoma |
| NAFLD: Non-alcoholic fatty liver disease | ||
| Oral Cavity | 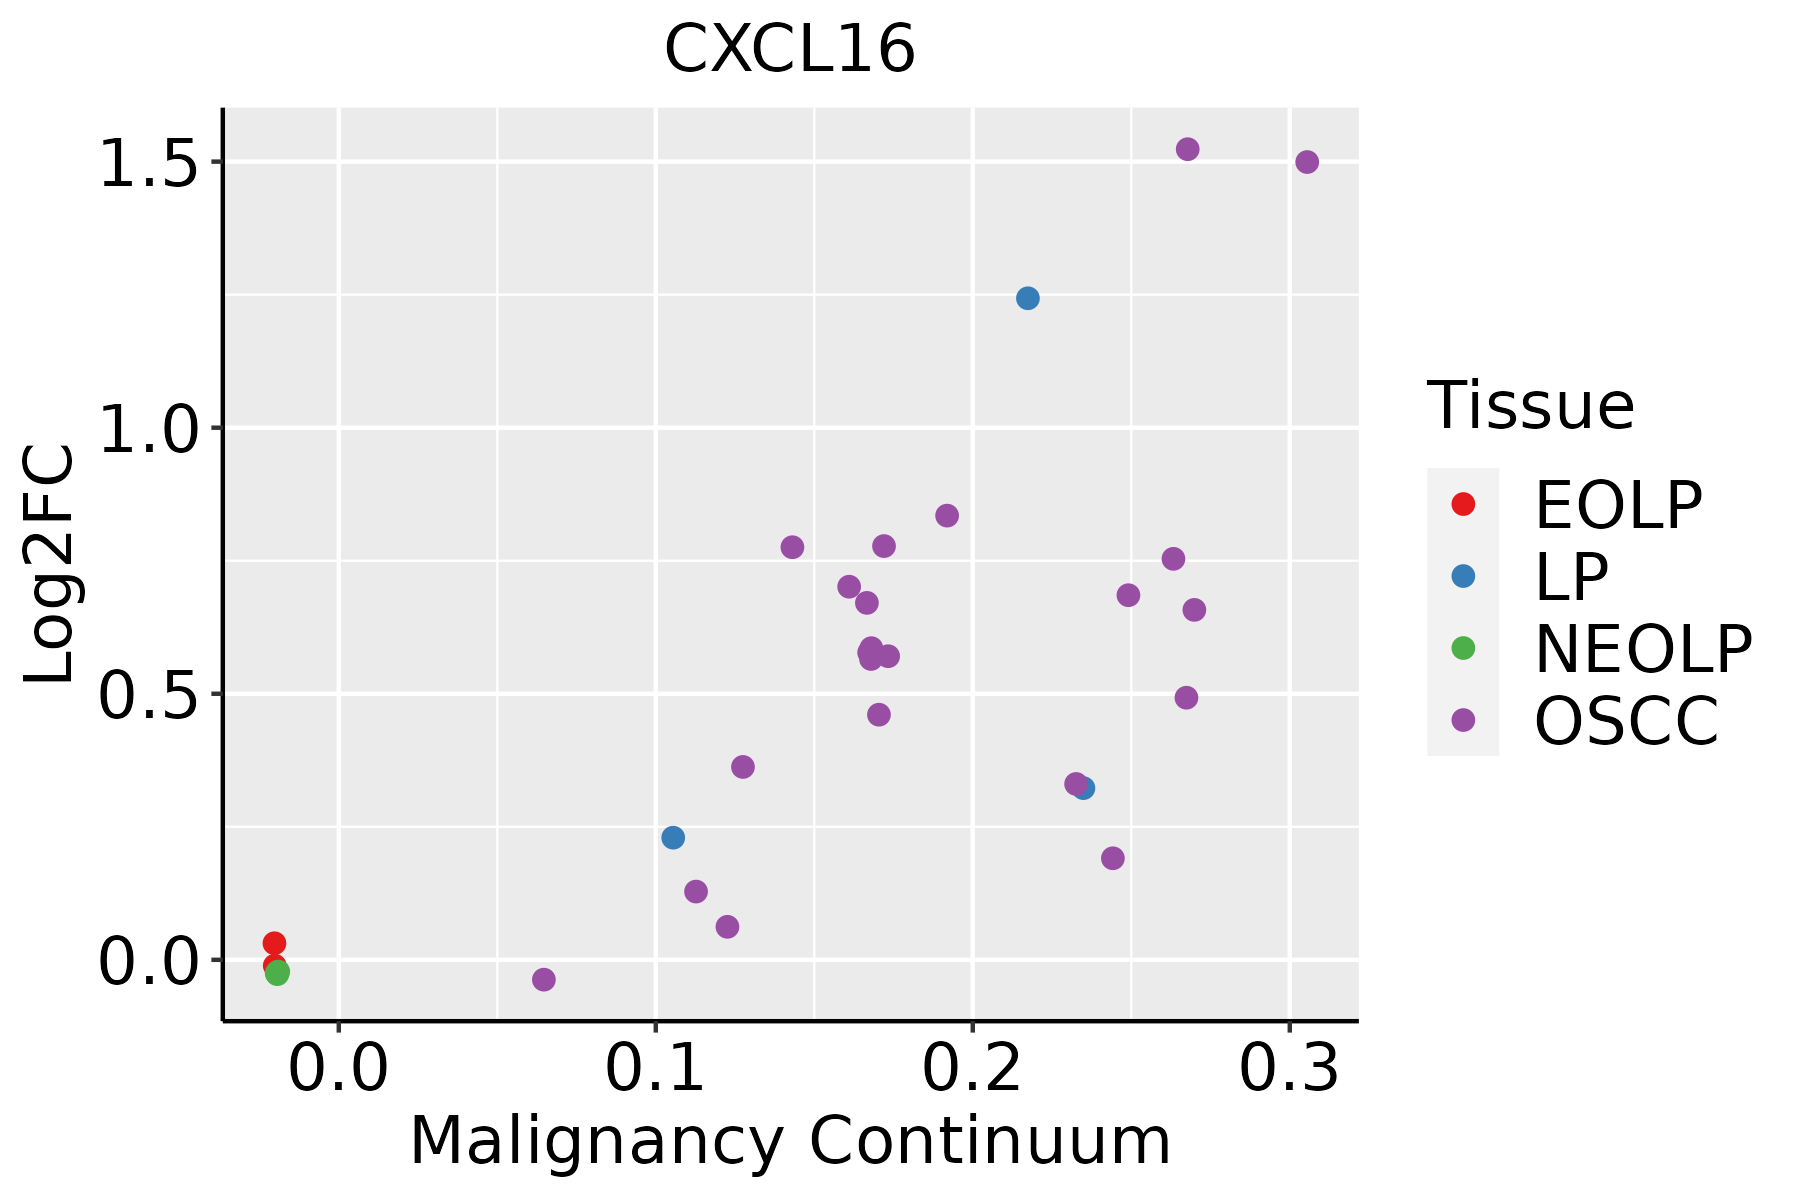 | EOLP: Erosive Oral lichen planus |
| LP: leukoplakia | ||
| NEOLP: Non-erosive oral lichen planus | ||
| OSCC: Oral squamous cell carcinoma | ||
| Prostate | 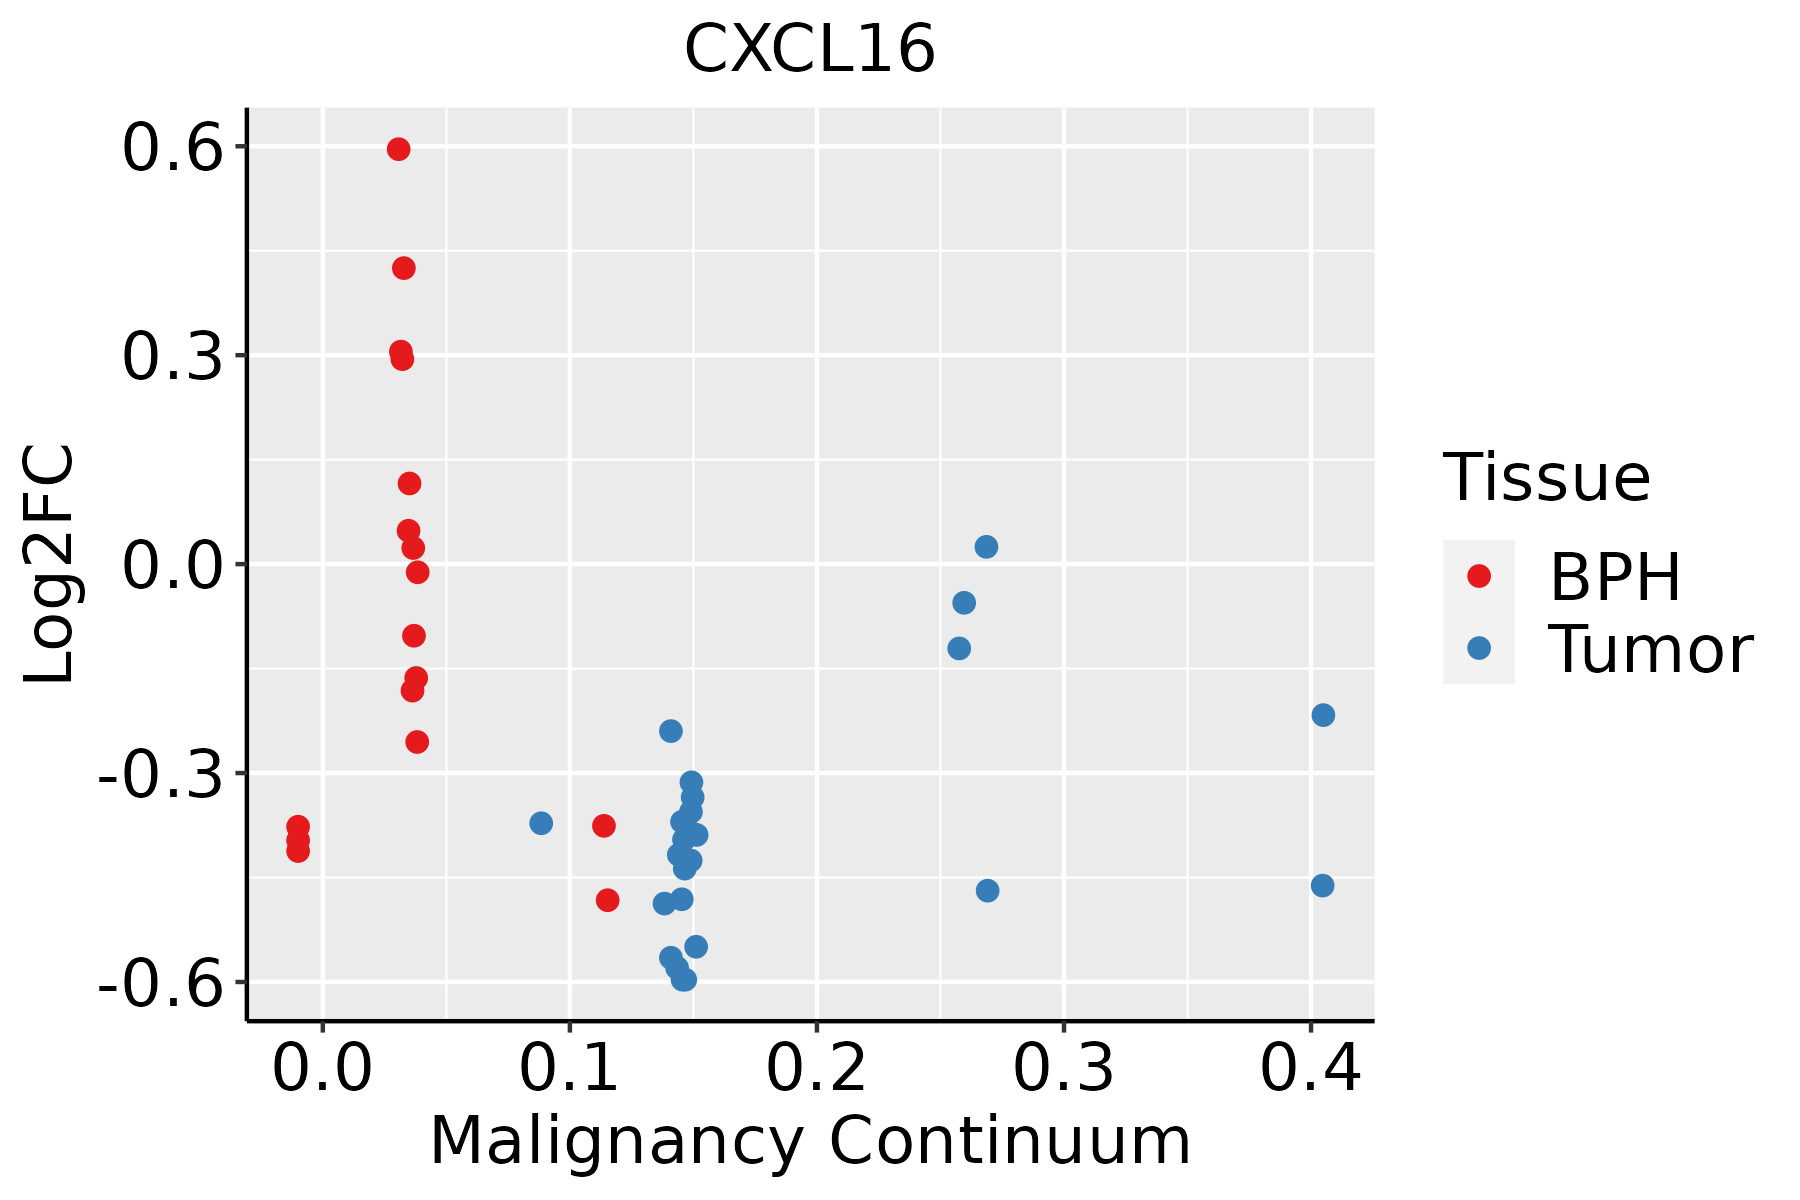 | BPH: Benign Prostatic Hyperplasia |
| ∗log2FC in expression of this searched gene in stem-like cells from each diseased tissue sample relative to stem-like cells in normal samples in each tissue plotted against the malignancy continuum. Samples are colored based on if they are from different disease stage. |
Top |
Malignant transformation related pathway analysis |
| Find out the enriched GO biological processes and KEGG pathways involved in transition from healthy to precancer to cancer |
| Tissue | Disease Stage | Enriched GO biological Processes |
| Colorectum | AD |  |
| Colorectum | SER |  |
| Colorectum | MSS |  |
| Colorectum | MSI-H |  |
| Colorectum | FAP |  |
| ∗Top 15 enriched GO BP terms are showed in the bar plot of each disease state in each tissue. Each row represents a significant GO biological process which is colored according to the -log10(p.adjust). |
| Page: 1 2 3 4 5 6 7 8 9 |
| GO ID | Tissue | Disease Stage | Description | Gene Ratio | Bg Ratio | pvalue | p.adjust | Count |
| GO:0016049 | Colorectum | AD | cell growth | 143/3918 | 482/18723 | 2.83e-06 | 8.09e-05 | 143 |
| GO:0001558 | Colorectum | AD | regulation of cell growth | 124/3918 | 414/18723 | 7.67e-06 | 1.86e-04 | 124 |
| GO:0006898 | Colorectum | AD | receptor-mediated endocytosis | 76/3918 | 244/18723 | 1.07e-04 | 1.59e-03 | 76 |
| GO:0030307 | Colorectum | AD | positive regulation of cell growth | 54/3918 | 166/18723 | 3.08e-04 | 3.69e-03 | 54 |
| GO:0045927 | Colorectum | AD | positive regulation of growth | 77/3918 | 259/18723 | 4.82e-04 | 5.27e-03 | 77 |
| GO:00015581 | Colorectum | SER | regulation of cell growth | 90/2897 | 414/18723 | 4.00e-04 | 6.02e-03 | 90 |
| GO:00160491 | Colorectum | SER | cell growth | 100/2897 | 482/18723 | 1.07e-03 | 1.24e-02 | 100 |
| GO:00303071 | Colorectum | SER | positive regulation of cell growth | 39/2897 | 166/18723 | 4.25e-03 | 3.45e-02 | 39 |
| GO:00459271 | Colorectum | SER | positive regulation of growth | 56/2897 | 259/18723 | 5.10e-03 | 3.91e-02 | 56 |
| GO:00160492 | Colorectum | MSS | cell growth | 123/3467 | 482/18723 | 7.15e-05 | 1.21e-03 | 123 |
| GO:00068981 | Colorectum | MSS | receptor-mediated endocytosis | 69/3467 | 244/18723 | 1.18e-04 | 1.82e-03 | 69 |
| GO:00015582 | Colorectum | MSS | regulation of cell growth | 105/3467 | 414/18723 | 2.97e-04 | 3.90e-03 | 105 |
| GO:00459272 | Colorectum | MSS | positive regulation of growth | 68/3467 | 259/18723 | 1.24e-03 | 1.19e-02 | 68 |
| GO:00303072 | Colorectum | MSS | positive regulation of cell growth | 47/3467 | 166/18723 | 1.29e-03 | 1.23e-02 | 47 |
| GO:0034341 | Colorectum | MSI-H | response to interferon-gamma | 21/1319 | 141/18723 | 8.78e-04 | 1.57e-02 | 21 |
| GO:0016049110 | Esophagus | ESCC | cell growth | 289/8552 | 482/18723 | 1.29e-10 | 3.77e-09 | 289 |
| GO:000155819 | Esophagus | ESCC | regulation of cell growth | 248/8552 | 414/18723 | 2.97e-09 | 6.45e-08 | 248 |
| GO:003461220 | Esophagus | ESCC | response to tumor necrosis factor | 149/8552 | 253/18723 | 1.47e-05 | 1.33e-04 | 149 |
| GO:000689818 | Esophagus | ESCC | receptor-mediated endocytosis | 142/8552 | 244/18723 | 5.22e-05 | 4.05e-04 | 142 |
| GO:003030710 | Esophagus | ESCC | positive regulation of cell growth | 100/8552 | 166/18723 | 1.07e-04 | 7.55e-04 | 100 |
| Page: 1 2 3 |
| Pathway ID | Tissue | Disease Stage | Description | Gene Ratio | Bg Ratio | pvalue | p.adjust | qvalue | Count |
| Page: 1 |
Top |
Cell-cell communication analysis |
| Identification of potential cell-cell interactions between two cell types and their ligand-receptor pairs for different disease states |
| Ligand | Receptor | LRpair | Pathway | Tissue | Disease Stage |
| CXCL16 | CXCR6 | CXCL16_CXCR6 | CXCL | Breast | ADJ |
| CXCL16 | CXCR6 | CXCL16_CXCR6 | CXCL | Breast | DCIS |
| CXCL16 | CXCR6 | CXCL16_CXCR6 | CXCL | Breast | Healthy |
| CXCL16 | CXCR6 | CXCL16_CXCR6 | CXCL | Breast | IDC |
| CXCL16 | CXCR6 | CXCL16_CXCR6 | CXCL | Breast | Precancer |
| CXCL16 | CXCR6 | CXCL16_CXCR6 | CXCL | Cervix | ADJ |
| CXCL16 | CXCR6 | CXCL16_CXCR6 | CXCL | Cervix | CC |
| CXCL16 | CXCR6 | CXCL16_CXCR6 | CXCL | Cervix | Precancer |
| CXCL16 | CXCR6 | CXCL16_CXCR6 | CXCL | CRC | MSI-H |
| CXCL16 | CXCR6 | CXCL16_CXCR6 | CXCL | CRC | SER |
| CXCL16 | CXCR6 | CXCL16_CXCR6 | CXCL | Endometrium | ADJ |
| CXCL16 | CXCR6 | CXCL16_CXCR6 | CXCL | Endometrium | AEH |
| CXCL16 | CXCR6 | CXCL16_CXCR6 | CXCL | Endometrium | EEC |
| CXCL16 | CXCR6 | CXCL16_CXCR6 | CXCL | GC | ADJ |
| CXCL16 | CXCR6 | CXCL16_CXCR6 | CXCL | GC | GC |
| CXCL16 | CXCR6 | CXCL16_CXCR6 | CXCL | HNSCC | ADJ |
| CXCL16 | CXCR6 | CXCL16_CXCR6 | CXCL | HNSCC | OSCC |
| CXCL16 | CXCR6 | CXCL16_CXCR6 | CXCL | HNSCC | Precancer |
| CXCL16 | CXCR6 | CXCL16_CXCR6 | CXCL | Liver | HCC |
| CXCL16 | CXCR6 | CXCL16_CXCR6 | CXCL | Liver | Healthy |
| Page: 1 2 |
Top |
Single-cell gene regulatory network inference analysis |
| Find out the significant the regulons (TFs) and the target genes of each regulon across cell types for different disease states |
| TF | Cell Type | Tissue | Disease Stage | Target Gene | RSS | Regulon Activity |
| ∗The dot plots of a searched regulon are shown for all cell subpopulations in each disease state of each tissue based on the regulon specific score inferred using pySCENIC and by calculating the average expression. |
| Page: 1 |
Top |
Somatic mutation of malignant transformation related genes |
| Annotation of somatic variants for genes involved in malignant transformation |
| Hugo Symbol | Variant Class | Variant Classification | dbSNP RS | HGVSc | HGVSp | HGVSp Short | SWISSPROT | BIOTYPE | SIFT | PolyPhen | Tumor Sample Barcode | Tissue | Histology | Sex | Age | Stage | Therapy Types | Drugs | Outcome |
| CXCL16 | SNV | Missense_Mutation | c.706A>C | p.Ile236Leu | p.I236L | Q9H2A7 | protein_coding | tolerated(0.53) | benign(0.069) | TCGA-A1-A0SG-01 | Breast | breast invasive carcinoma | Female | <65 | I/II | Chemotherapy | SD | ||
| CXCL16 | SNV | Missense_Mutation | c.461A>G | p.His154Arg | p.H154R | Q9H2A7 | protein_coding | tolerated(0.5) | benign(0) | TCGA-DS-A1OC-01 | Cervix | cervical & endocervical cancer | Female | <65 | I/II | Chemotherapy | gemcitabine | SD | |
| CXCL16 | SNV | Missense_Mutation | c.5C>G | p.Ser2Cys | p.S2C | Q9H2A7 | protein_coding | tolerated_low_confidence(0.21) | benign(0.073) | TCGA-IR-A3LH-01 | Cervix | cervical & endocervical cancer | Female | <65 | I/II | Chemotherapy | cisplatin | CR | |
| CXCL16 | SNV | Missense_Mutation | rs754219984 | c.761N>T | p.Pro254Leu | p.P254L | Q9H2A7 | protein_coding | tolerated(0.18) | benign(0.003) | TCGA-VS-A9UB-01 | Cervix | cervical & endocervical cancer | Female | <65 | I/II | Chemotherapy | cisplatin | CR |
| CXCL16 | deletion | In_Frame_Del | novel | c.370_402delGCTTACTCGGGGATTGTGGCCCACCAGAAGCAT | p.Ala124_His134del | p.A124_H134del | Q9H2A7 | protein_coding | TCGA-LP-A4AW-01 | Cervix | cervical & endocervical cancer | Female | <65 | I/II | Unknown | Unknown | SD | ||
| CXCL16 | SNV | Missense_Mutation | novel | c.214N>A | p.Gln72Lys | p.Q72K | Q9H2A7 | protein_coding | tolerated(0.38) | benign(0.048) | TCGA-AZ-4681-01 | Colorectum | colon adenocarcinoma | Female | >=65 | I/II | Unknown | Unknown | SD |
| CXCL16 | SNV | Missense_Mutation | c.428N>A | p.Ser143Tyr | p.S143Y | Q9H2A7 | protein_coding | deleterious(0) | possibly_damaging(0.808) | TCGA-CA-6717-01 | Colorectum | colon adenocarcinoma | Male | <65 | I/II | Chemotherapy | oxaliplatin | CR | |
| CXCL16 | SNV | Missense_Mutation | rs756648834 | c.185G>T | p.Arg62Ile | p.R62I | Q9H2A7 | protein_coding | tolerated(0.52) | benign(0) | TCGA-CA-6718-01 | Colorectum | colon adenocarcinoma | Male | <65 | I/II | Unknown | Unknown | PD |
| CXCL16 | insertion | Frame_Shift_Ins | novel | c.214_215insG | p.Gln72ArgfsTer46 | p.Q72Rfs*46 | Q9H2A7 | protein_coding | TCGA-AZ-4681-01 | Colorectum | colon adenocarcinoma | Female | >=65 | I/II | Unknown | Unknown | SD | ||
| CXCL16 | deletion | Frame_Shift_Del | c.445delG | p.Ala149HisfsTer26 | p.A149Hfs*26 | Q9H2A7 | protein_coding | TCGA-D5-6930-01 | Colorectum | colon adenocarcinoma | Male | >=65 | I/II | Unknown | Unknown | SD |
| Page: 1 2 3 |
Top |
Related drugs of malignant transformation related genes |
| Identification of chemicals and drugs interact with genes involved in malignant transfromation |
| (DGIdb 4.0) |
| Entrez ID | Symbol | Category | Interaction Types | Drug Claim Name | Drug Name | PMIDs |
| Page: 1 |

Copyright 2023-Present -The University of Texas Health Science Center at Houston |