| Tissue | Expression Dynamics | Abbreviation |
| Breast | 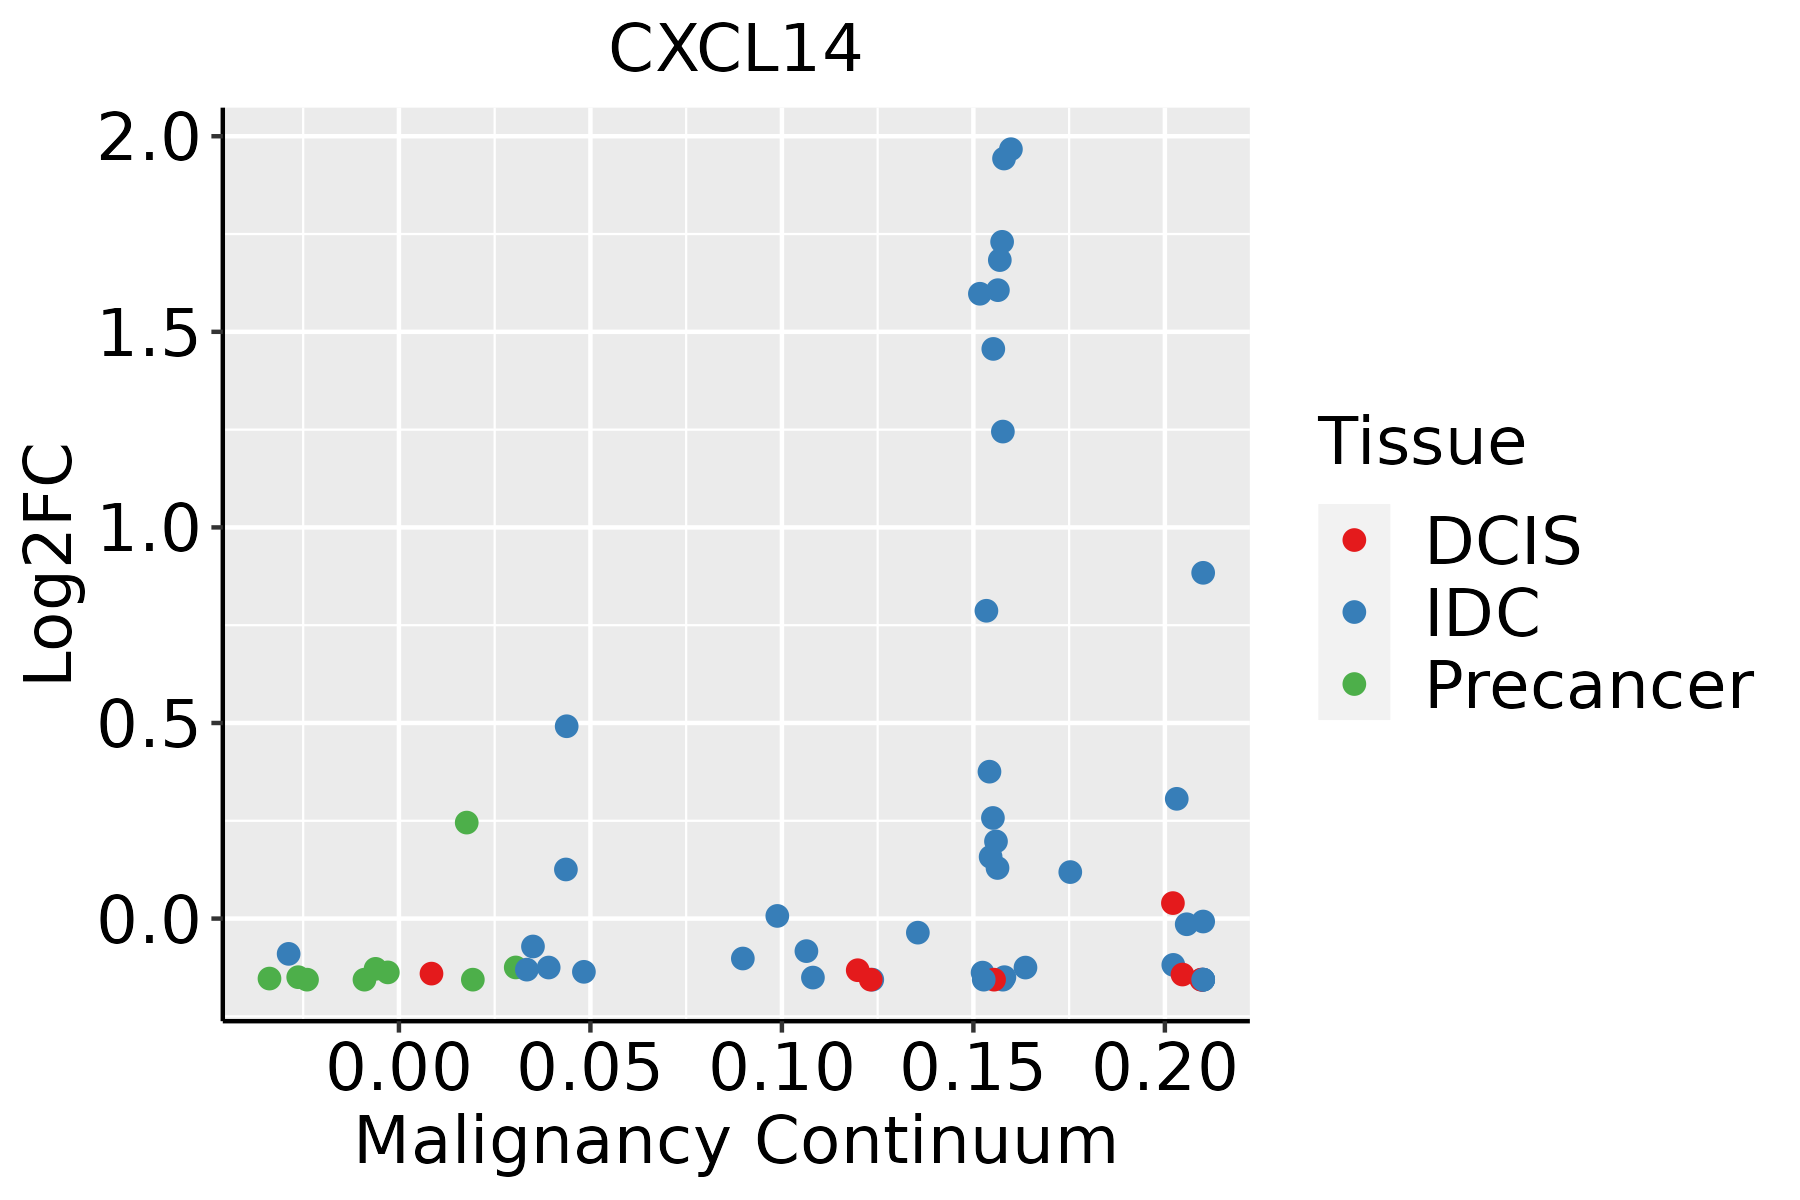 | IDC: Invasive ductal carcinoma |
| DCIS: Ductal carcinoma in situ |
| Precancer(BRCA1-mut): Precancerous lesion from BRCA1 mutation carriers |
| Cervix | 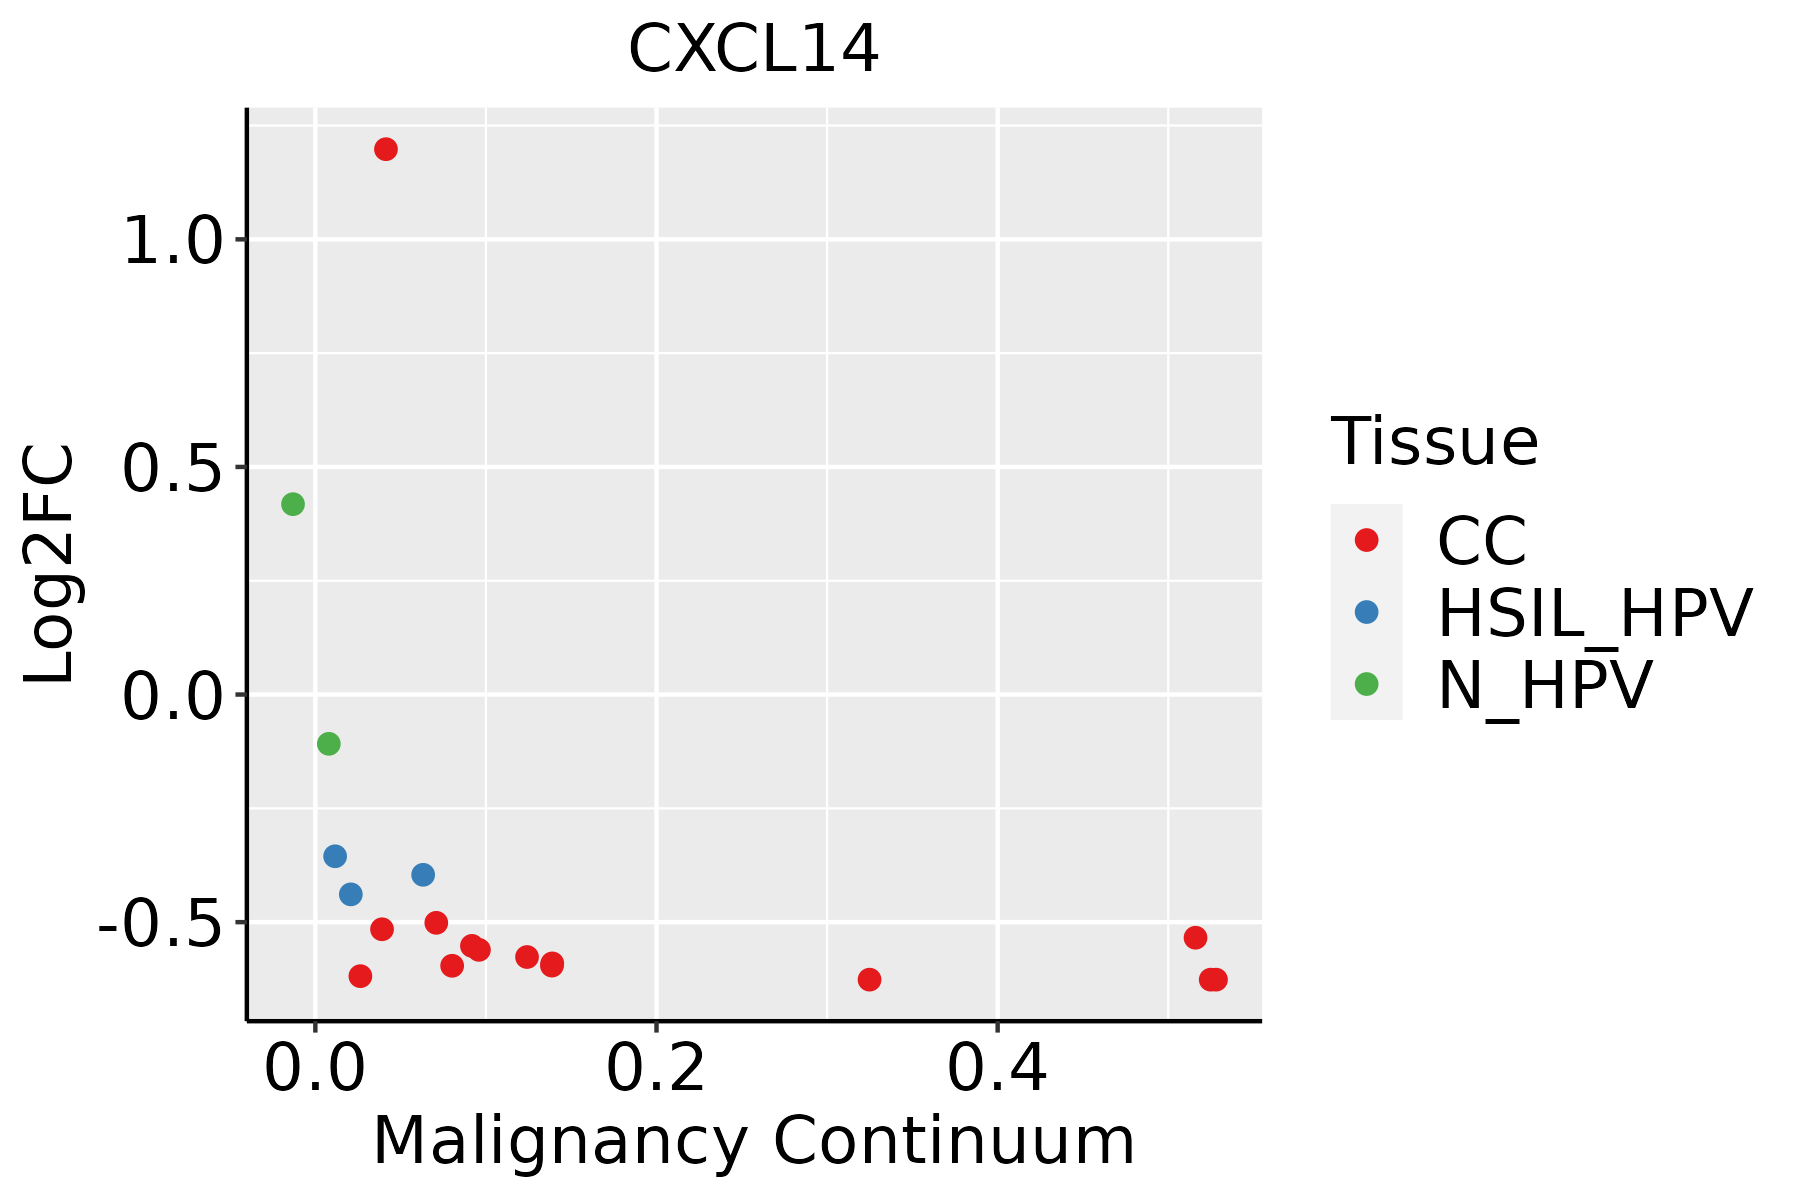 | CC: Cervix cancer |
| HSIL_HPV: HPV-infected high-grade squamous intraepithelial lesions |
| N_HPV: HPV-infected normal cervix |
| Esophagus | 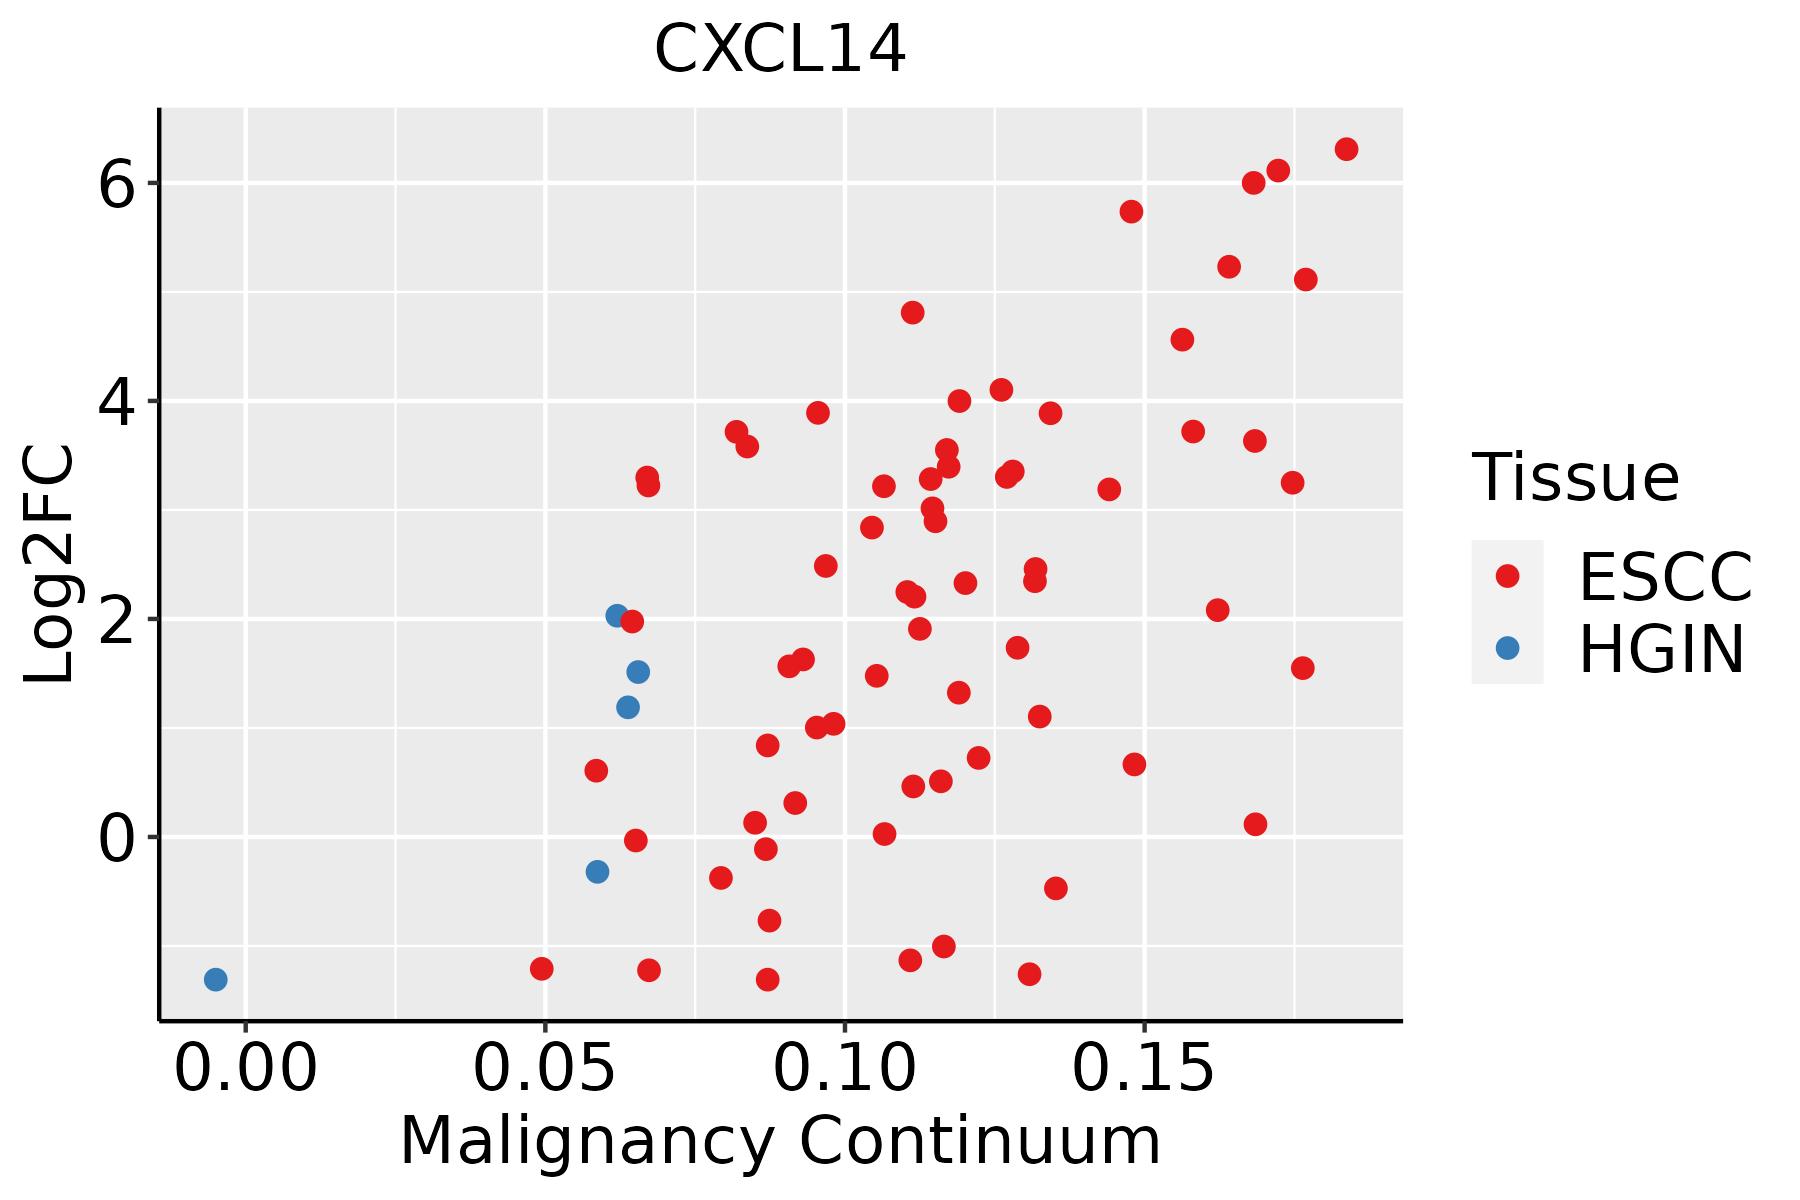 | ESCC: Esophageal squamous cell carcinoma |
| HGIN: High-grade intraepithelial neoplasias |
| LGIN: Low-grade intraepithelial neoplasias |
| Liver | 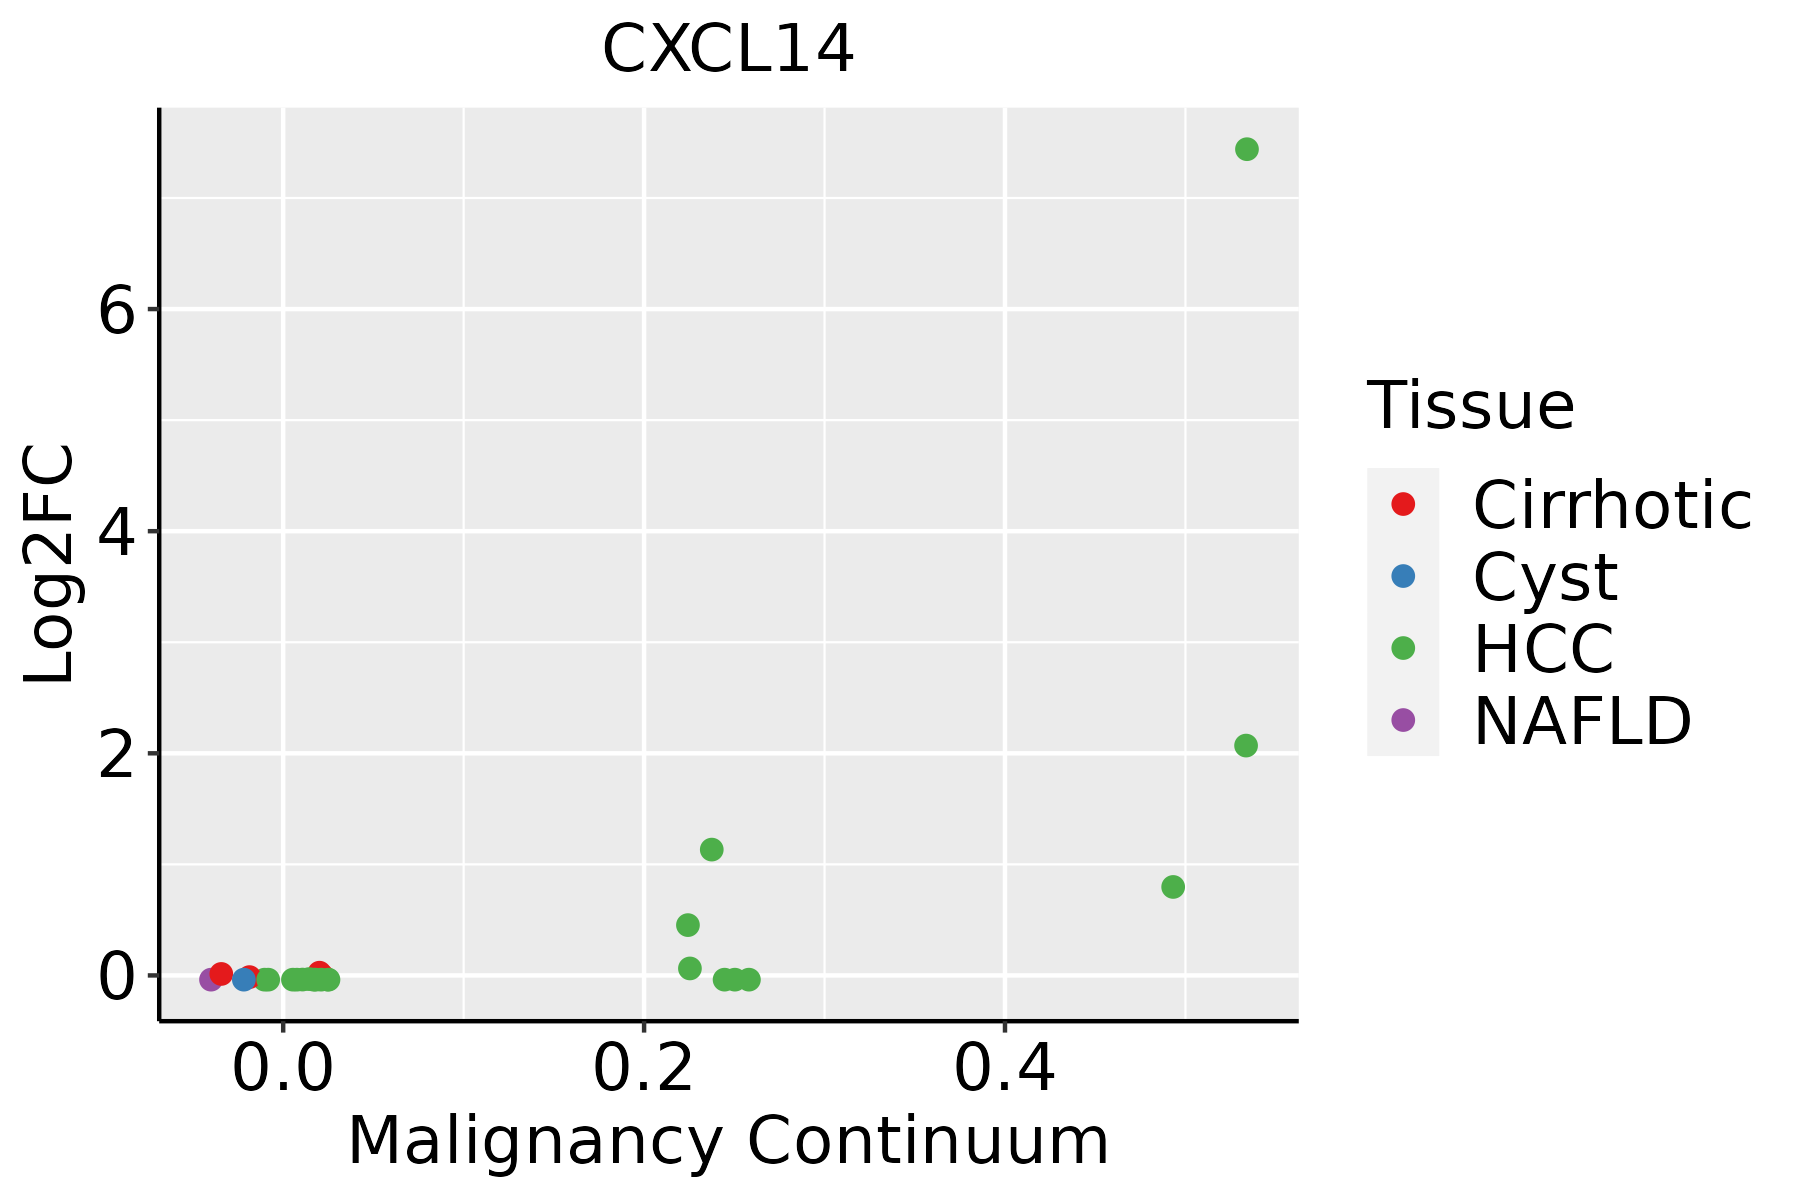 | HCC: Hepatocellular carcinoma |
| NAFLD: Non-alcoholic fatty liver disease |
| Lung | 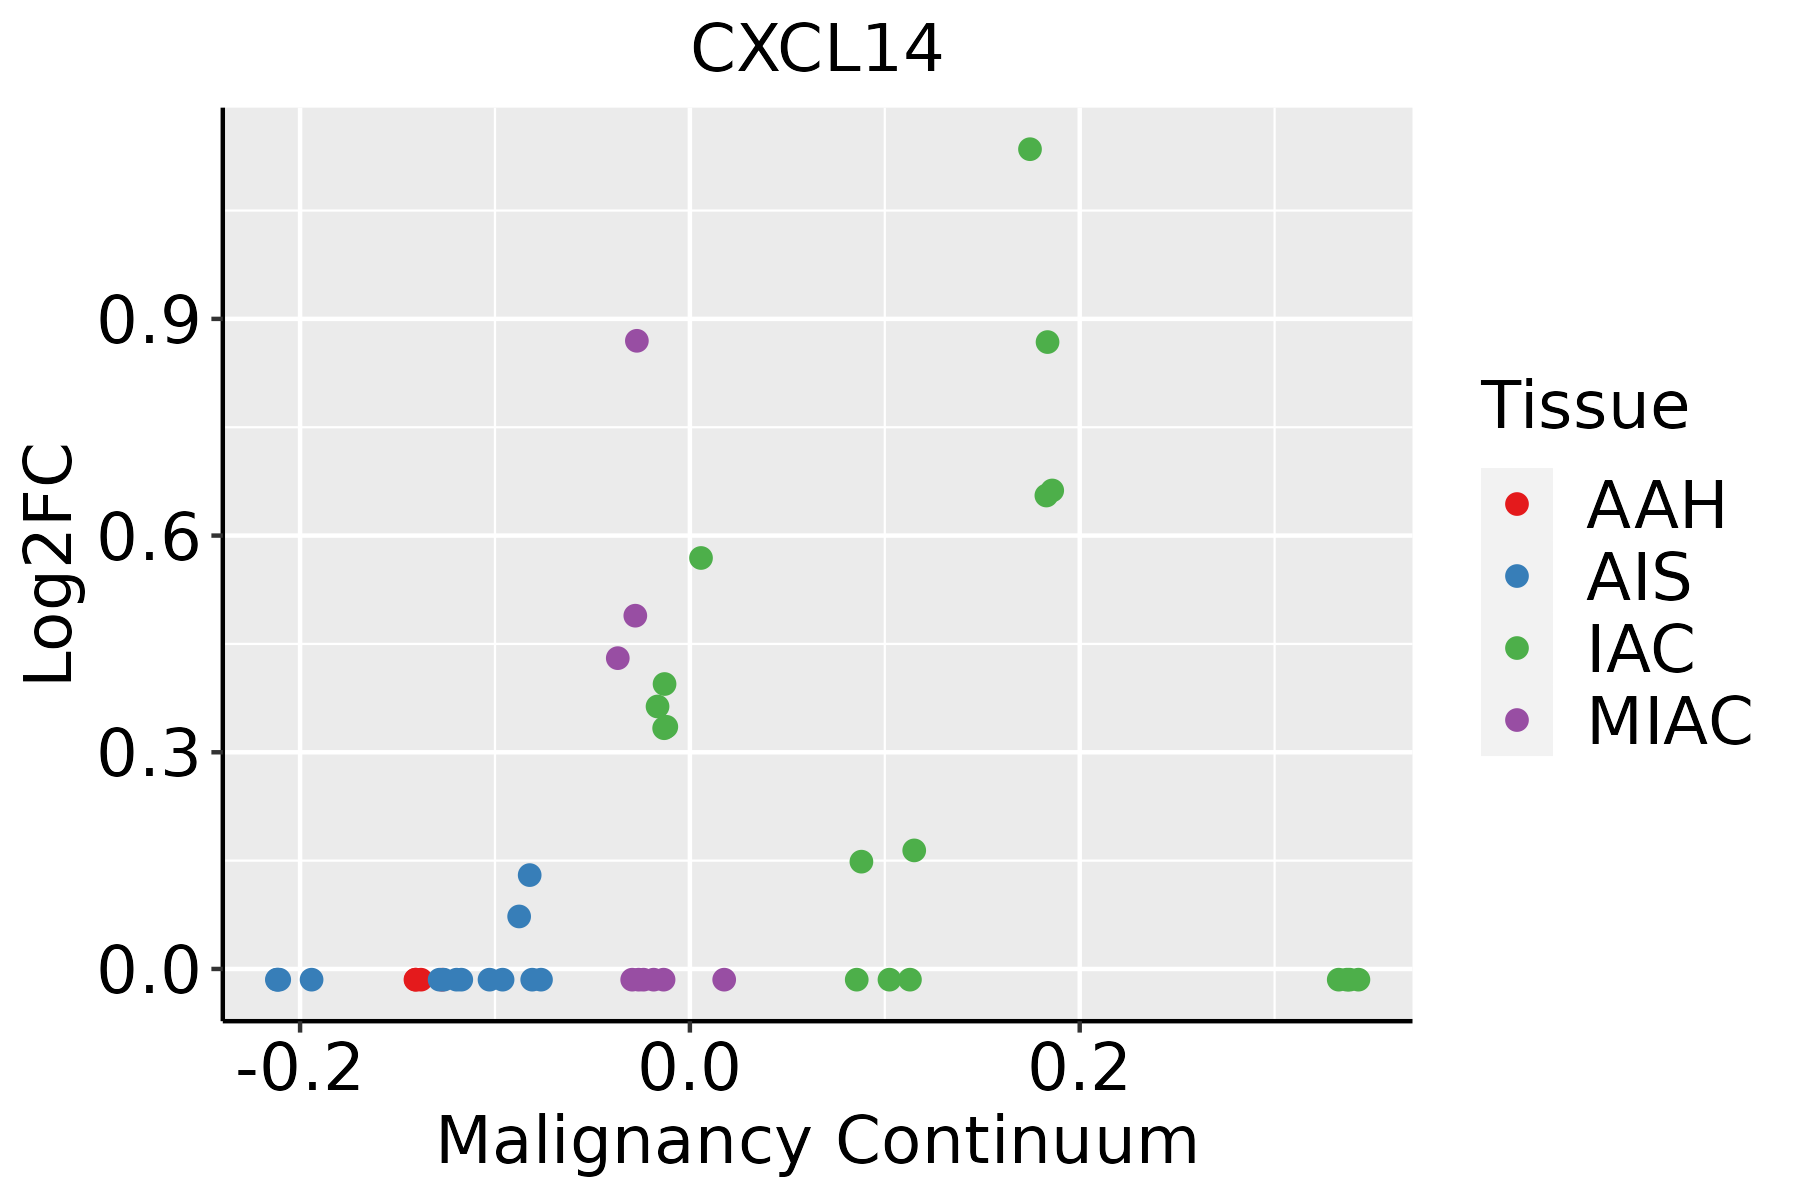 | AAH: Atypical adenomatous hyperplasia |
| AIS: Adenocarcinoma in situ |
| IAC: Invasive lung adenocarcinoma |
| MIA: Minimally invasive adenocarcinoma |
| Oral Cavity |  | EOLP: Erosive Oral lichen planus |
| LP: leukoplakia |
| NEOLP: Non-erosive oral lichen planus |
| OSCC: Oral squamous cell carcinoma |
| Prostate |  | BPH: Benign Prostatic Hyperplasia |
| Skin | 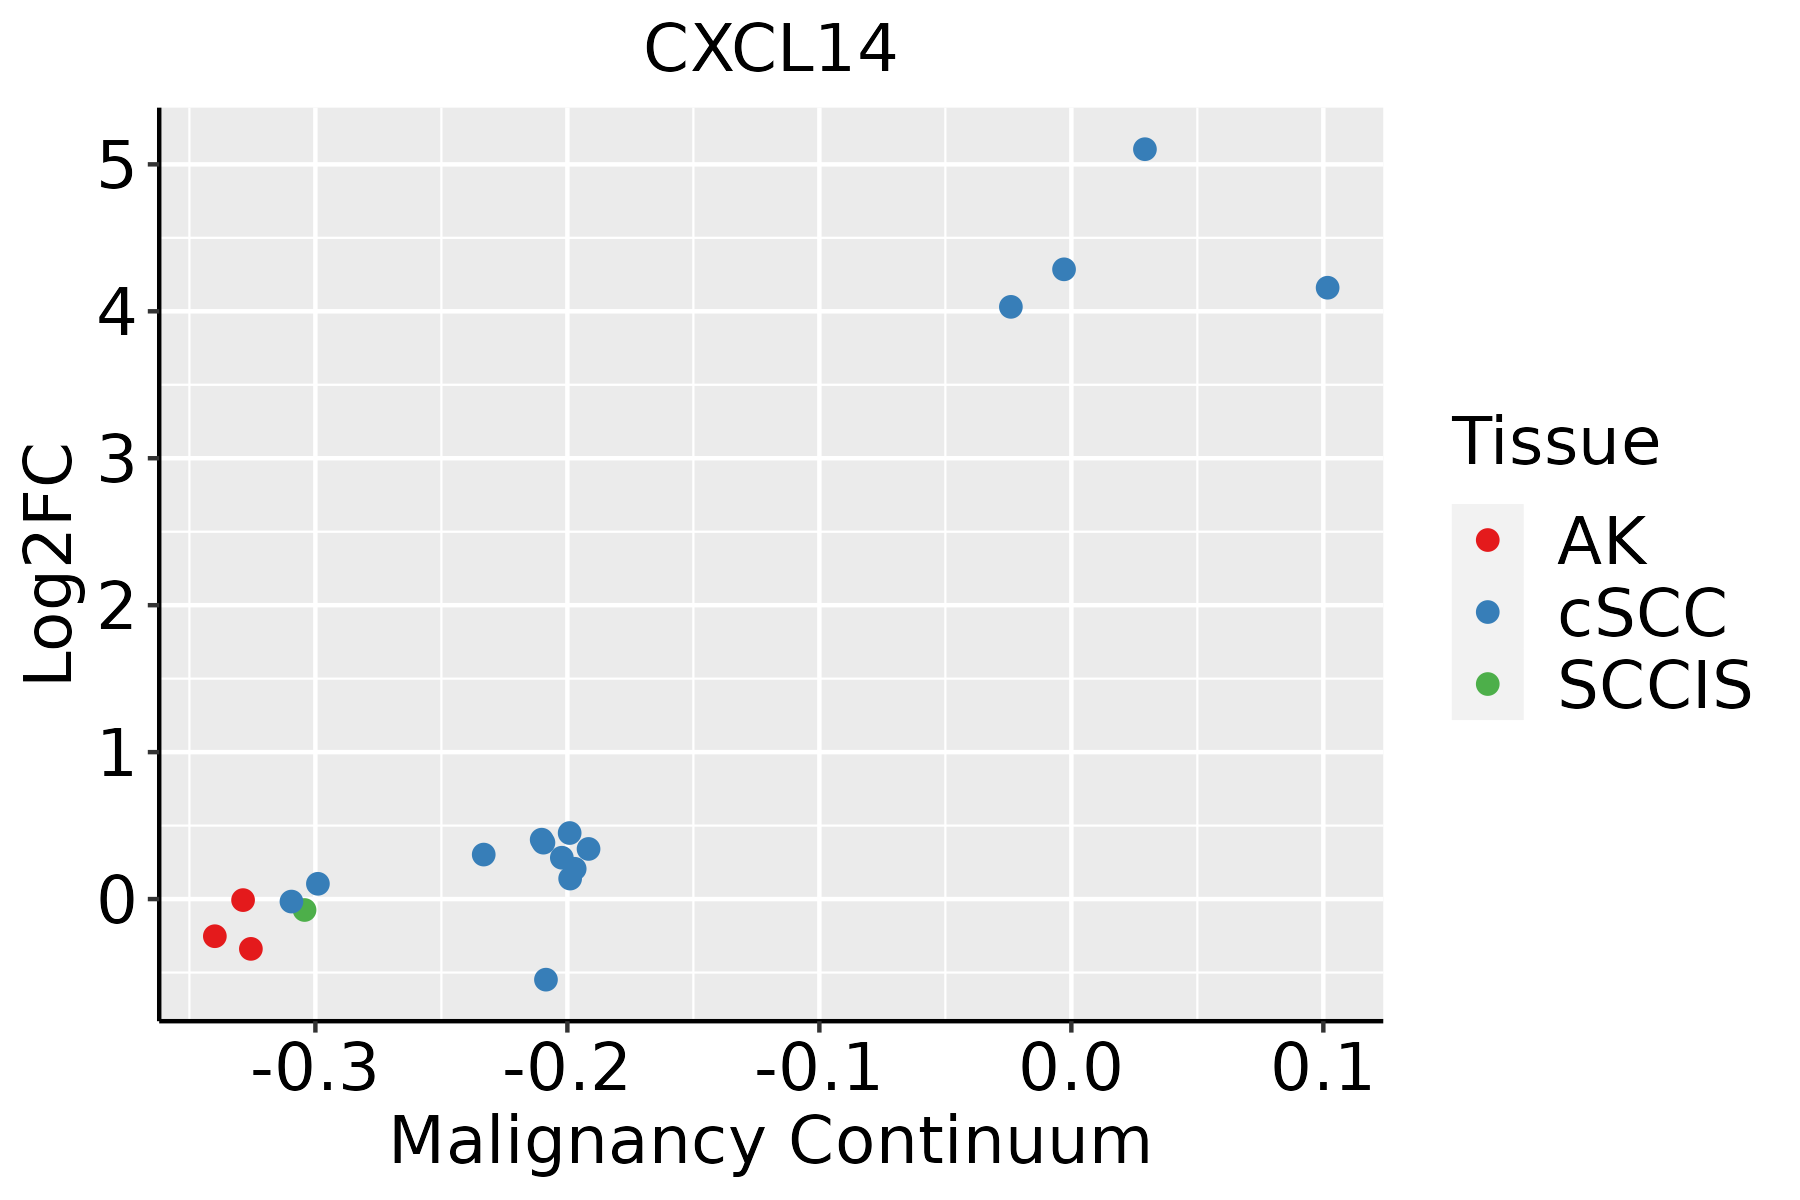 | AK: Actinic keratosis |
| cSCC: Cutaneous squamous cell carcinoma |
| SCCIS:squamous cell carcinoma in situ |
| Thyroid | 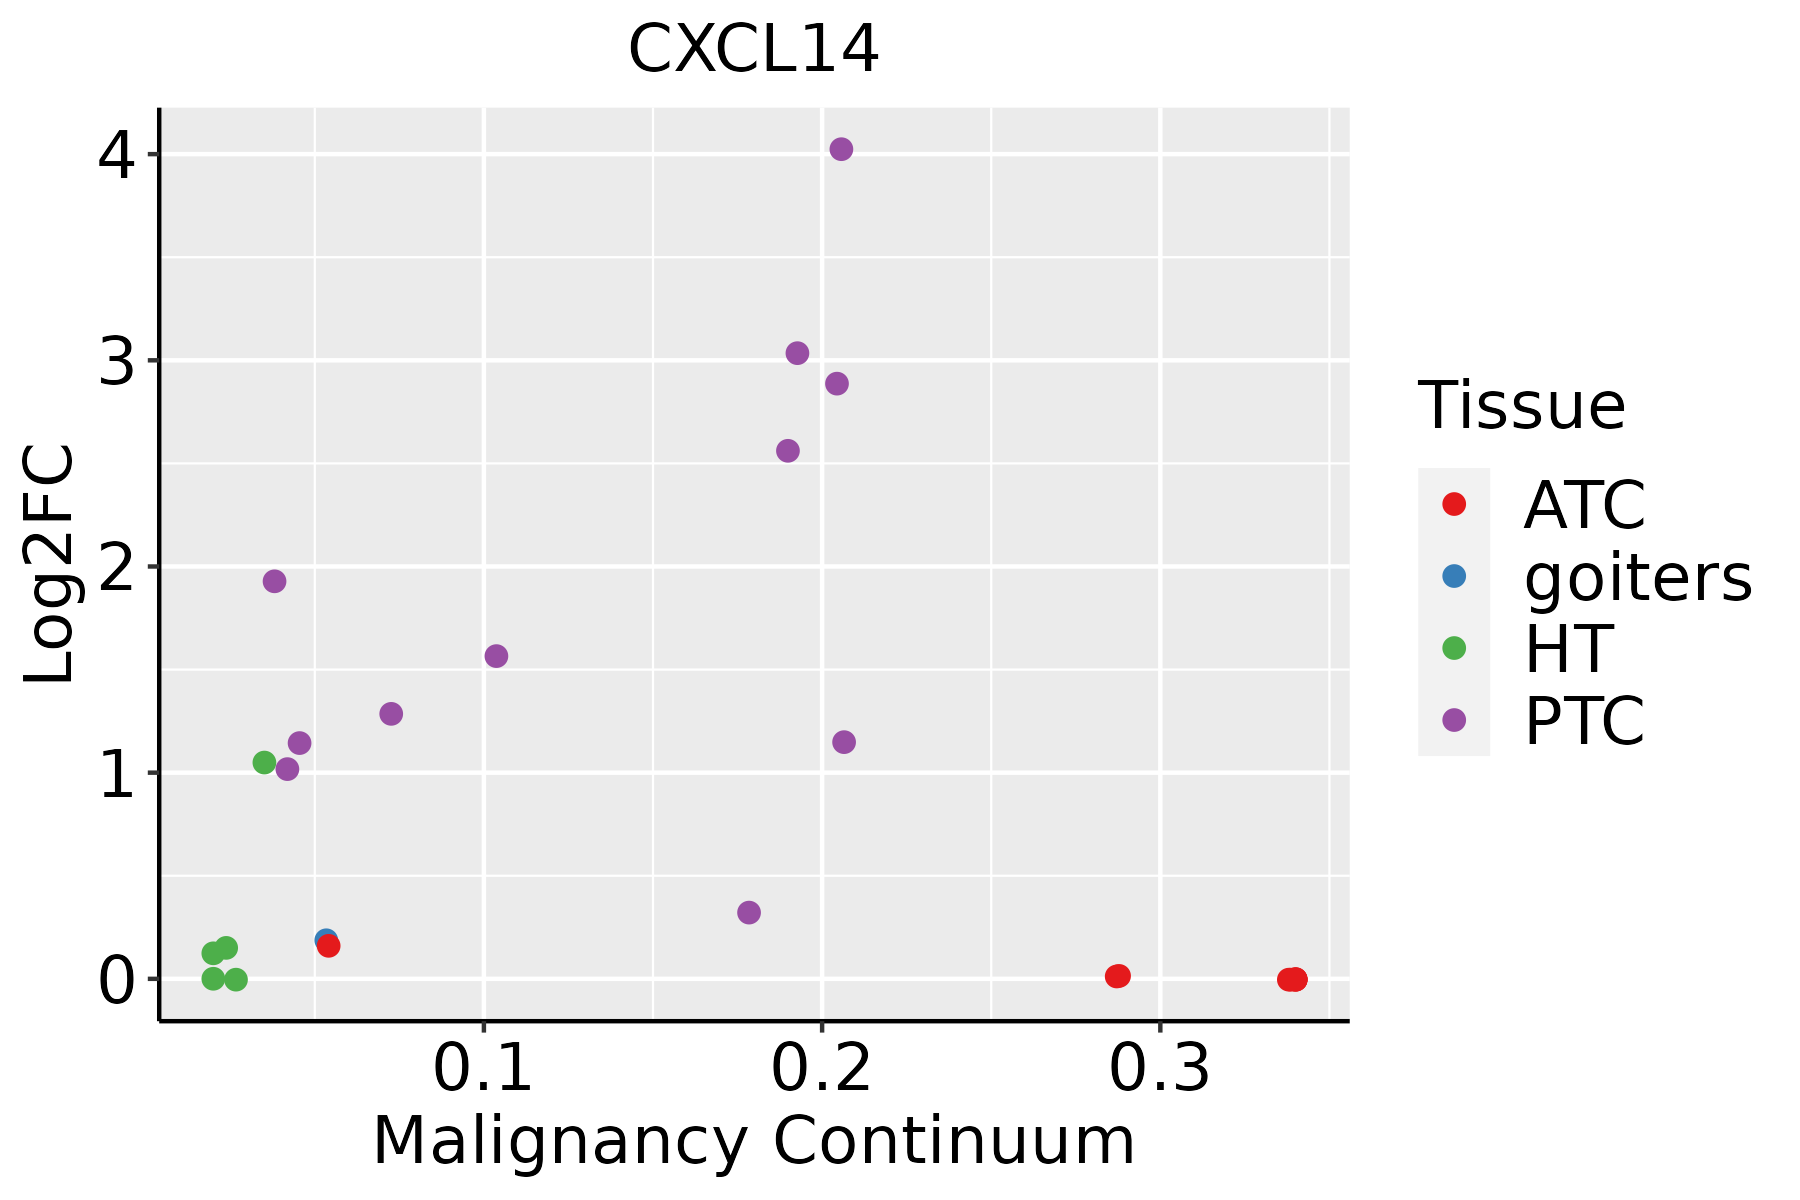 | ATC: Anaplastic thyroid cancer |
| HT: Hashimoto's thyroiditis |
| PTC: Papillary thyroid cancer |
| GO ID | Tissue | Disease Stage | Description | Gene Ratio | Bg Ratio | pvalue | p.adjust | Count |
| GO:006032611 | Breast | IDC | cell chemotaxis | 46/1434 | 310/18723 | 1.13e-05 | 3.08e-04 | 46 |
| GO:001973011 | Breast | IDC | antimicrobial humoral response | 23/1434 | 122/18723 | 4.67e-05 | 1.04e-03 | 23 |
| GO:006184411 | Breast | IDC | antimicrobial humoral immune response mediated by antimicrobial peptide | 16/1434 | 79/18723 | 2.75e-04 | 4.24e-03 | 16 |
| GO:00069596 | Breast | IDC | humoral immune response | 40/1434 | 317/18723 | 1.25e-03 | 1.33e-02 | 40 |
| GO:00603267 | Cervix | CC | cell chemotaxis | 73/2311 | 310/18723 | 2.82e-08 | 1.96e-06 | 73 |
| GO:00197308 | Cervix | CC | antimicrobial humoral response | 27/2311 | 122/18723 | 1.70e-03 | 1.29e-02 | 27 |
| GO:00618447 | Cervix | CC | antimicrobial humoral immune response mediated by antimicrobial peptide | 18/2311 | 79/18723 | 6.82e-03 | 3.74e-02 | 18 |
| GO:00069597 | Cervix | CC | humoral immune response | 54/2311 | 317/18723 | 8.57e-03 | 4.42e-02 | 54 |
| GO:000695912 | Cervix | HSIL_HPV | humoral immune response | 39/737 | 317/18723 | 2.88e-10 | 7.02e-08 | 39 |
| GO:006032612 | Cervix | HSIL_HPV | cell chemotaxis | 36/737 | 310/18723 | 6.69e-09 | 8.80e-07 | 36 |
| GO:001973012 | Cervix | HSIL_HPV | antimicrobial humoral response | 18/737 | 122/18723 | 1.35e-06 | 6.21e-05 | 18 |
| GO:006184412 | Cervix | HSIL_HPV | antimicrobial humoral immune response mediated by antimicrobial peptide | 11/737 | 79/18723 | 2.57e-04 | 4.44e-03 | 11 |
| GO:000695921 | Cervix | N_HPV | humoral immune response | 31/534 | 317/18723 | 2.53e-09 | 7.88e-07 | 31 |
| GO:006032622 | Cervix | N_HPV | cell chemotaxis | 27/534 | 310/18723 | 2.95e-07 | 2.13e-05 | 27 |
| GO:001973022 | Cervix | N_HPV | antimicrobial humoral response | 16/534 | 122/18723 | 3.88e-07 | 2.60e-05 | 16 |
| GO:006184422 | Cervix | N_HPV | antimicrobial humoral immune response mediated by antimicrobial peptide | 9/534 | 79/18723 | 4.08e-04 | 5.77e-03 | 9 |
| GO:00603269 | Oral cavity | OSCC | cell chemotaxis | 146/7305 | 310/18723 | 2.13e-03 | 9.80e-03 | 146 |
| GO:006032614 | Oral cavity | EOLP | cell chemotaxis | 60/2218 | 310/18723 | 8.04e-05 | 9.66e-04 | 60 |
| GO:006032623 | Oral cavity | NEOLP | cell chemotaxis | 55/2005 | 310/18723 | 1.18e-04 | 1.40e-03 | 55 |
| GO:006032610 | Skin | AK | cell chemotaxis | 53/1910 | 310/18723 | 1.20e-04 | 1.50e-03 | 53 |
| Hugo Symbol | Variant Class | Variant Classification | dbSNP RS | HGVSc | HGVSp | HGVSp Short | SWISSPROT | BIOTYPE | SIFT | PolyPhen | Tumor Sample Barcode | Tissue | Histology | Sex | Age | Stage | Therapy Types | Drugs | Outcome |
| CXCL14 | SNV | Missense_Mutation | novel | c.241C>G | p.Gln81Glu | p.Q81E | O95715 | protein_coding | deleterious(0.01) | possibly_damaging(0.729) | TCGA-C5-A902-01 | Cervix | cervical & endocervical cancer | Female | <65 | I/II | Chemotherapy | cisplatin | SD |
| CXCL14 | SNV | Missense_Mutation | rs774689516 | c.328G>A | p.Glu110Lys | p.E110K | O95715 | protein_coding | deleterious_low_confidence(0) | probably_damaging(0.959) | TCGA-AG-A002-01 | Colorectum | rectum adenocarcinoma | Male | <65 | I/II | Unknown | Unknown | SD |
| CXCL14 | SNV | Missense_Mutation | novel | c.263N>G | p.Lys88Arg | p.K88R | O95715 | protein_coding | tolerated(0.11) | possibly_damaging(0.448) | TCGA-A5-A0G1-01 | Endometrium | uterine corpus endometrioid carcinoma | Female | >=65 | I/II | Unknown | Unknown | SD |
| CXCL14 | SNV | Missense_Mutation | | c.139N>T | p.Arg47Cys | p.R47C | O95715 | protein_coding | deleterious(0) | benign(0.017) | TCGA-AX-A1CE-01 | Endometrium | uterine corpus endometrioid carcinoma | Female | <65 | I/II | Unspecific | Paclitaxel | SD |
| CXCL14 | SNV | Missense_Mutation | novel | c.185N>G | p.His62Arg | p.H62R | O95715 | protein_coding | tolerated(0.08) | possibly_damaging(0.815) | TCGA-BG-A0VW-01 | Endometrium | uterine corpus endometrioid carcinoma | Female | >=65 | I/II | Unknown | Unknown | SD |
| CXCL14 | SNV | Missense_Mutation | novel | c.130N>T | p.Pro44Ser | p.P44S | O95715 | protein_coding | deleterious(0.02) | probably_damaging(0.999) | TCGA-DD-AADM-01 | Liver | liver hepatocellular carcinoma | Male | <65 | I/II | Unknown | Unknown | SD |
| CXCL14 | SNV | Missense_Mutation | | c.91N>T | p.Arg31Cys | p.R31C | O95715 | protein_coding | deleterious_low_confidence(0.05) | possibly_damaging(0.465) | TCGA-MI-A75I-01 | Liver | liver hepatocellular carcinoma | Male | <65 | I/II | Unknown | Unknown | PD |
| CXCL14 | SNV | Missense_Mutation | novel | c.163N>C | p.Glu55Gln | p.E55Q | O95715 | protein_coding | deleterious(0.01) | probably_damaging(0.998) | TCGA-55-6987-01 | Lung | lung adenocarcinoma | Male | >=65 | I/II | Unknown | Unknown | SD |
| CXCL14 | SNV | Missense_Mutation | novel | c.230G>T | p.Arg77Met | p.R77M | O95715 | protein_coding | deleterious_low_confidence(0) | probably_damaging(0.998) | TCGA-56-8629-01 | Lung | lung squamous cell carcinoma | Male | <65 | I/II | Chemotherapy | cisplatin | CR |
| CXCL14 | SNV | Missense_Mutation | novel | c.182C>A | p.Pro61Gln | p.P61Q | O95715 | protein_coding | deleterious(0) | probably_damaging(1) | TCGA-CV-7090-01 | Oral cavity | head & neck squamous cell carcinoma | Male | <65 | I/II | Unknown | Unknown | SD |


