
|
|||||
|
 | |
| |
| |
| |
| |
| |
|
Gene: CXCL11 |
Gene summary for CXCL11 |
| Gene information | Species | Human | Gene symbol | CXCL11 | Gene ID | 6373 |
| Gene name | C-X-C motif chemokine ligand 11 | |
| Gene Alias | H174 | |
| Cytomap | 4q21.1 | |
| Gene Type | protein-coding | GO ID | GO:0002237 | UniProtAcc | O14625 |
Top |
Malignant transformation analysis |
| Identification of the aberrant gene expression in precancerous and cancerous lesions by comparing the gene expression of stem-like cells in diseased tissues with normal stem cells |
| Entrez ID | Symbol | Replicates | Species | Organ | Tissue | Adj P-value | Log2FC | Malignancy |
| 6373 | CXCL11 | P2T-E | Human | Esophagus | ESCC | 8.40e-04 | 2.56e-01 | 0.1177 |
| 6373 | CXCL11 | P17T-E | Human | Esophagus | ESCC | 1.49e-02 | 3.44e-01 | 0.1278 |
| 6373 | CXCL11 | P24T-E | Human | Esophagus | ESCC | 4.31e-06 | 3.86e-01 | 0.1287 |
| 6373 | CXCL11 | P36T-E | Human | Esophagus | ESCC | 5.72e-04 | 3.29e-01 | 0.1187 |
| 6373 | CXCL11 | P37T-E | Human | Esophagus | ESCC | 1.93e-09 | 7.49e-01 | 0.1371 |
| 6373 | CXCL11 | P40T-E | Human | Esophagus | ESCC | 5.68e-07 | 4.74e-01 | 0.109 |
| 6373 | CXCL11 | P52T-E | Human | Esophagus | ESCC | 2.65e-49 | 2.38e+00 | 0.1555 |
| 6373 | CXCL11 | P62T-E | Human | Esophagus | ESCC | 2.51e-06 | 3.36e-01 | 0.1302 |
| 6373 | CXCL11 | P75T-E | Human | Esophagus | ESCC | 1.47e-14 | 1.15e+00 | 0.1125 |
| 6373 | CXCL11 | P80T-E | Human | Esophagus | ESCC | 7.27e-30 | 2.91e+00 | 0.155 |
| 6373 | CXCL11 | P89T-E | Human | Esophagus | ESCC | 4.33e-15 | 2.71e+00 | 0.1752 |
| 6373 | CXCL11 | P91T-E | Human | Esophagus | ESCC | 4.77e-11 | 2.81e+00 | 0.1828 |
| 6373 | CXCL11 | HCC2 | Human | Liver | HCC | 1.32e-03 | 2.46e+00 | 0.5341 |
| 6373 | CXCL11 | HCC5 | Human | Liver | HCC | 7.23e-03 | 2.74e+00 | 0.4932 |
| 6373 | CXCL11 | S028 | Human | Liver | HCC | 1.44e-13 | 1.63e+00 | 0.2503 |
| 6373 | CXCL11 | S029 | Human | Liver | HCC | 3.09e-09 | 2.58e+00 | 0.2581 |
| 6373 | CXCL11 | C04 | Human | Oral cavity | OSCC | 1.49e-14 | 1.22e+00 | 0.2633 |
| 6373 | CXCL11 | C21 | Human | Oral cavity | OSCC | 2.49e-03 | 8.25e-01 | 0.2678 |
| 6373 | CXCL11 | C30 | Human | Oral cavity | OSCC | 5.78e-38 | 3.91e+00 | 0.3055 |
| 6373 | CXCL11 | C46 | Human | Oral cavity | OSCC | 2.91e-11 | 6.31e-01 | 0.1673 |
| Page: 1 2 |
| Tissue | Expression Dynamics | Abbreviation |
| Esophagus | 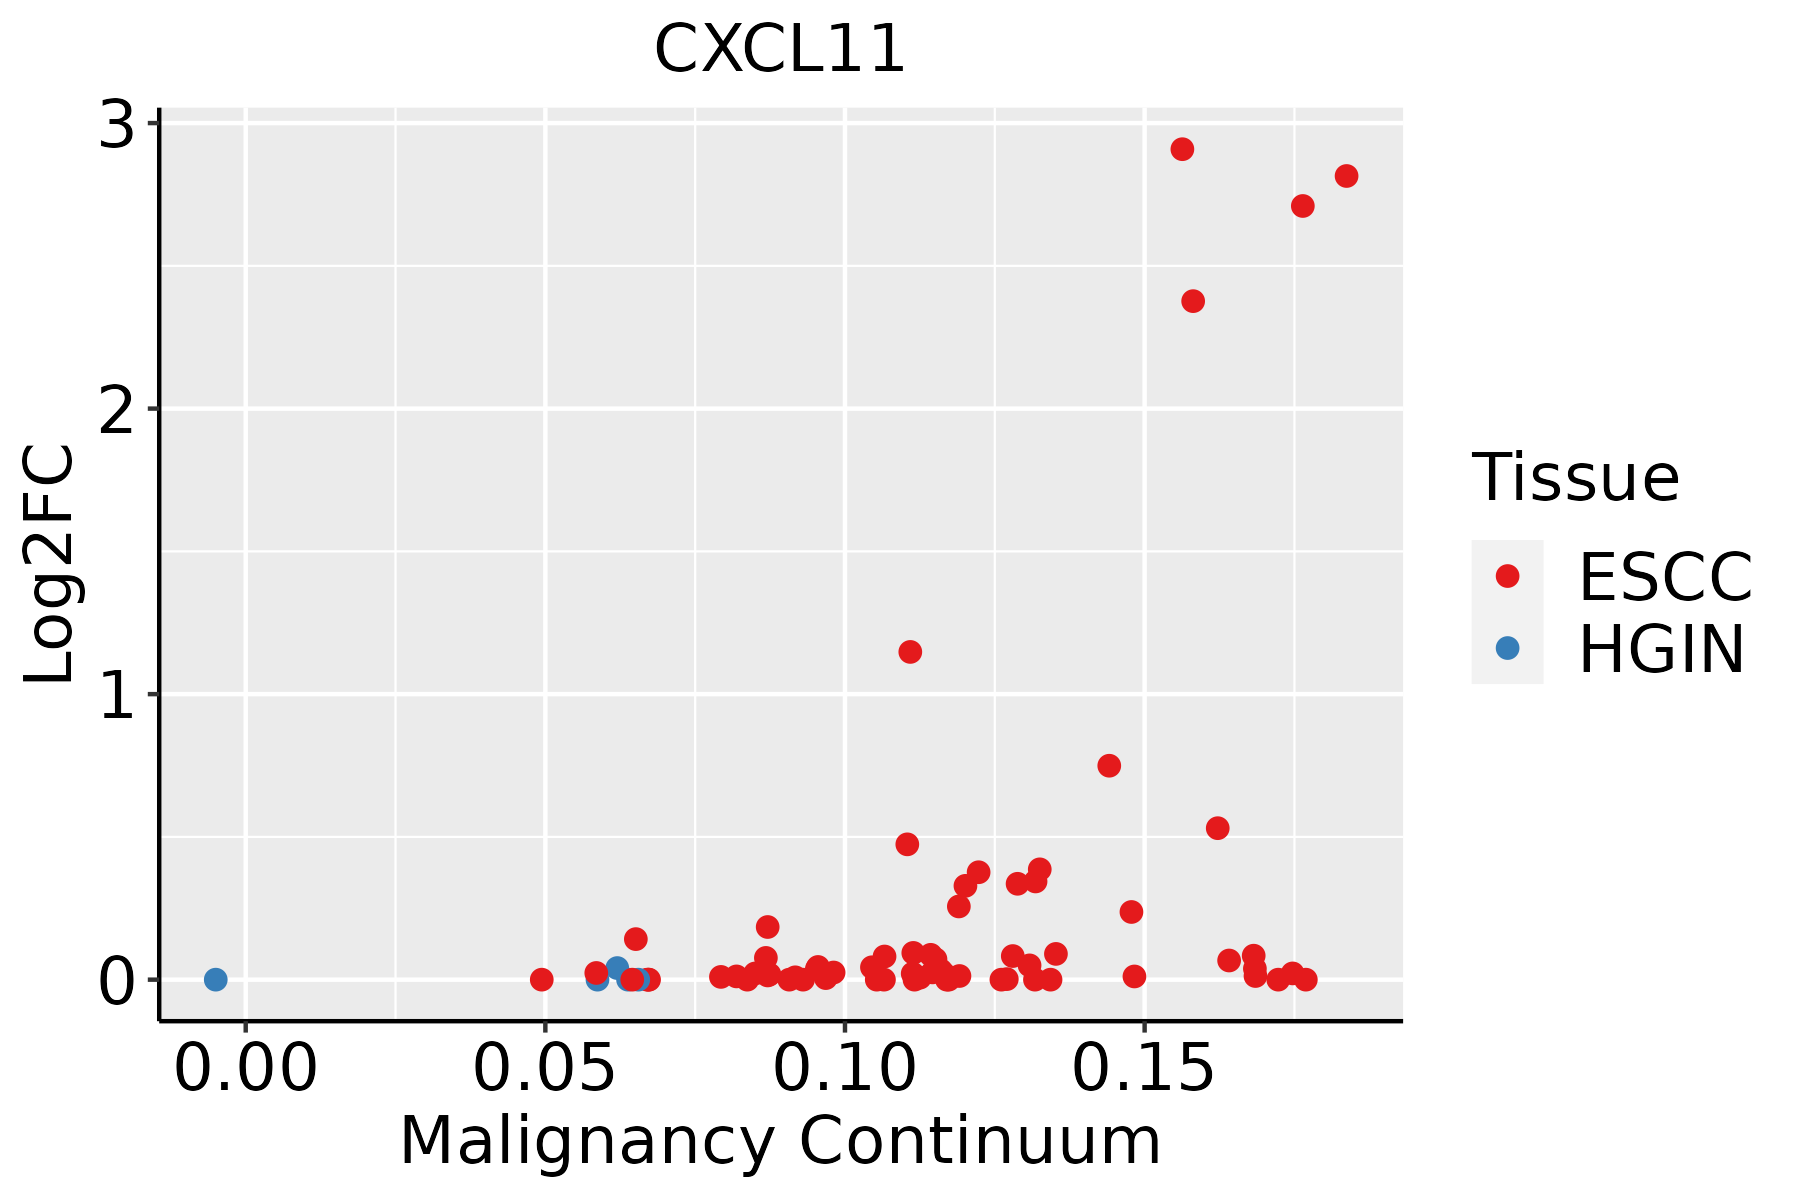 | ESCC: Esophageal squamous cell carcinoma |
| HGIN: High-grade intraepithelial neoplasias | ||
| LGIN: Low-grade intraepithelial neoplasias | ||
| Liver | 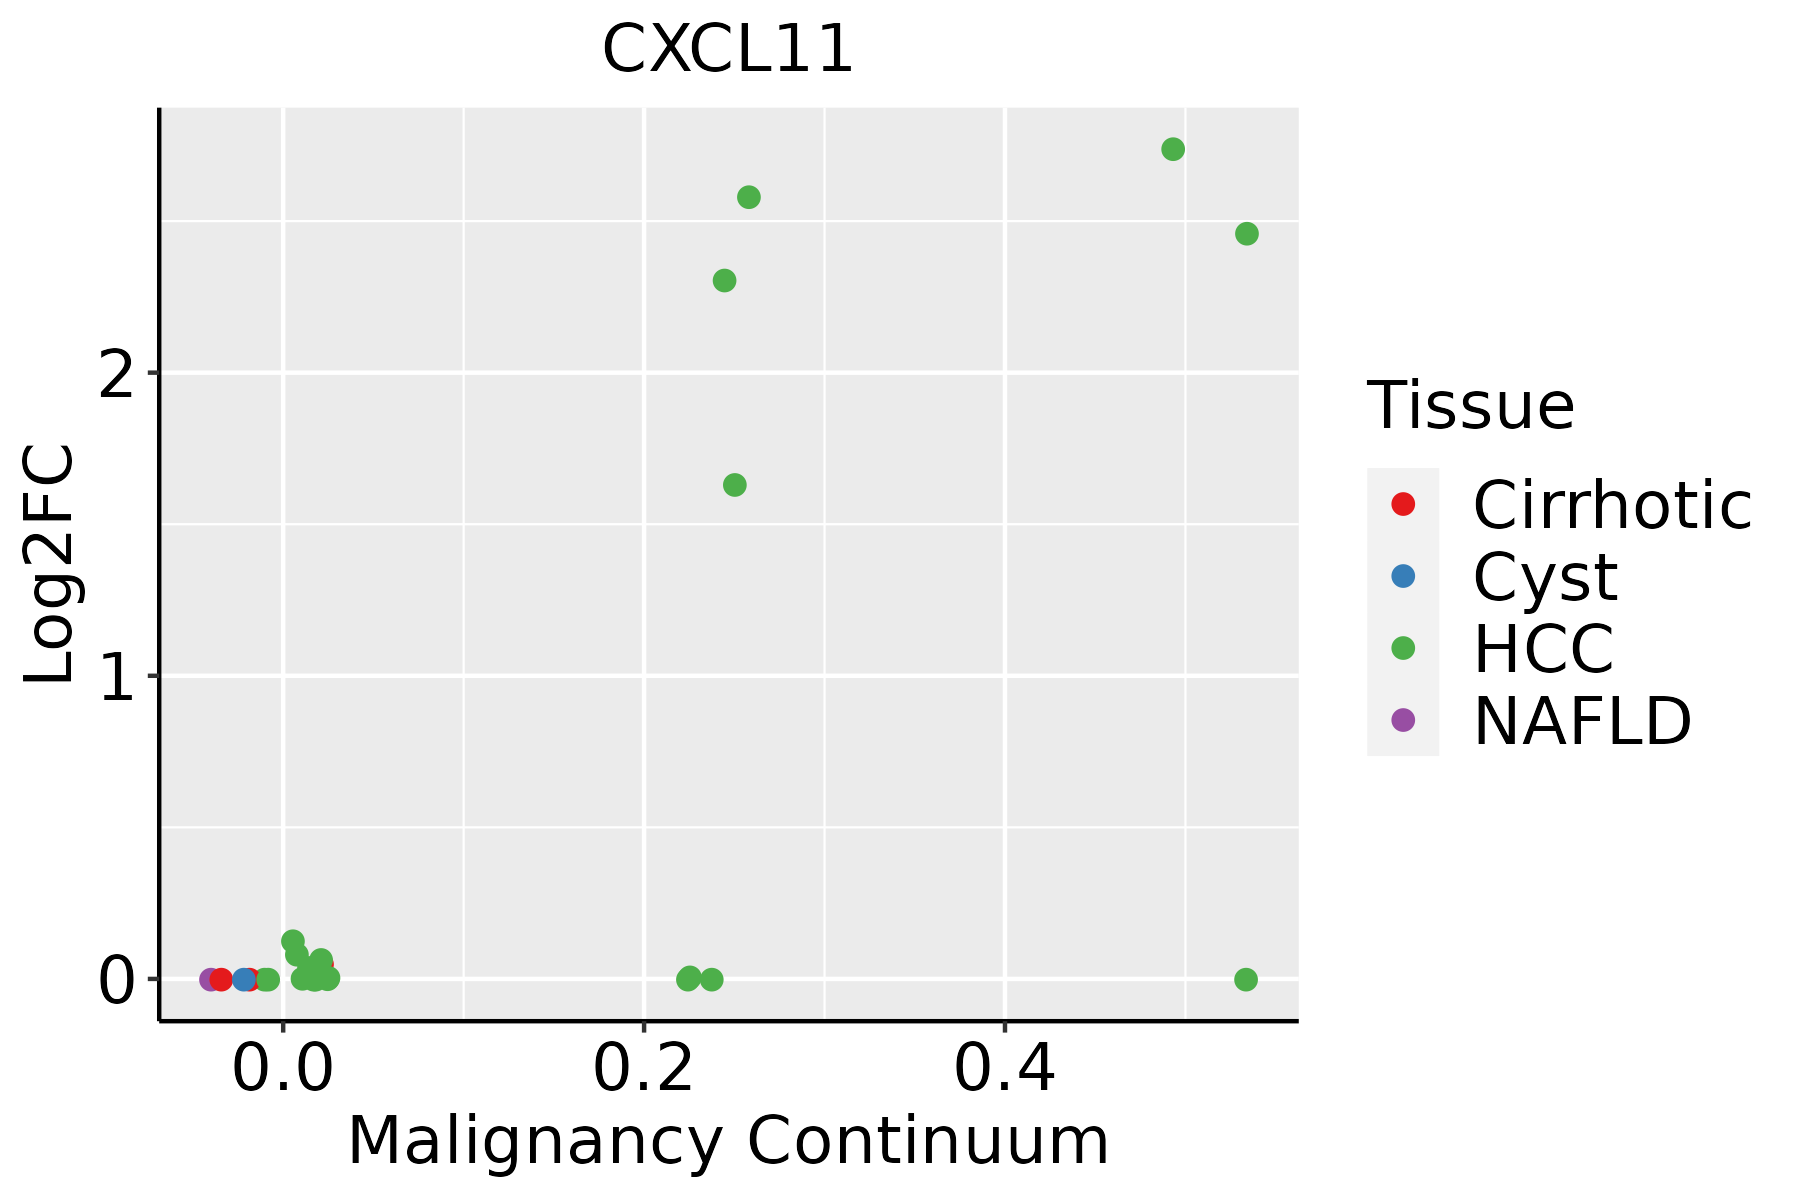 | HCC: Hepatocellular carcinoma |
| NAFLD: Non-alcoholic fatty liver disease | ||
| Oral Cavity | 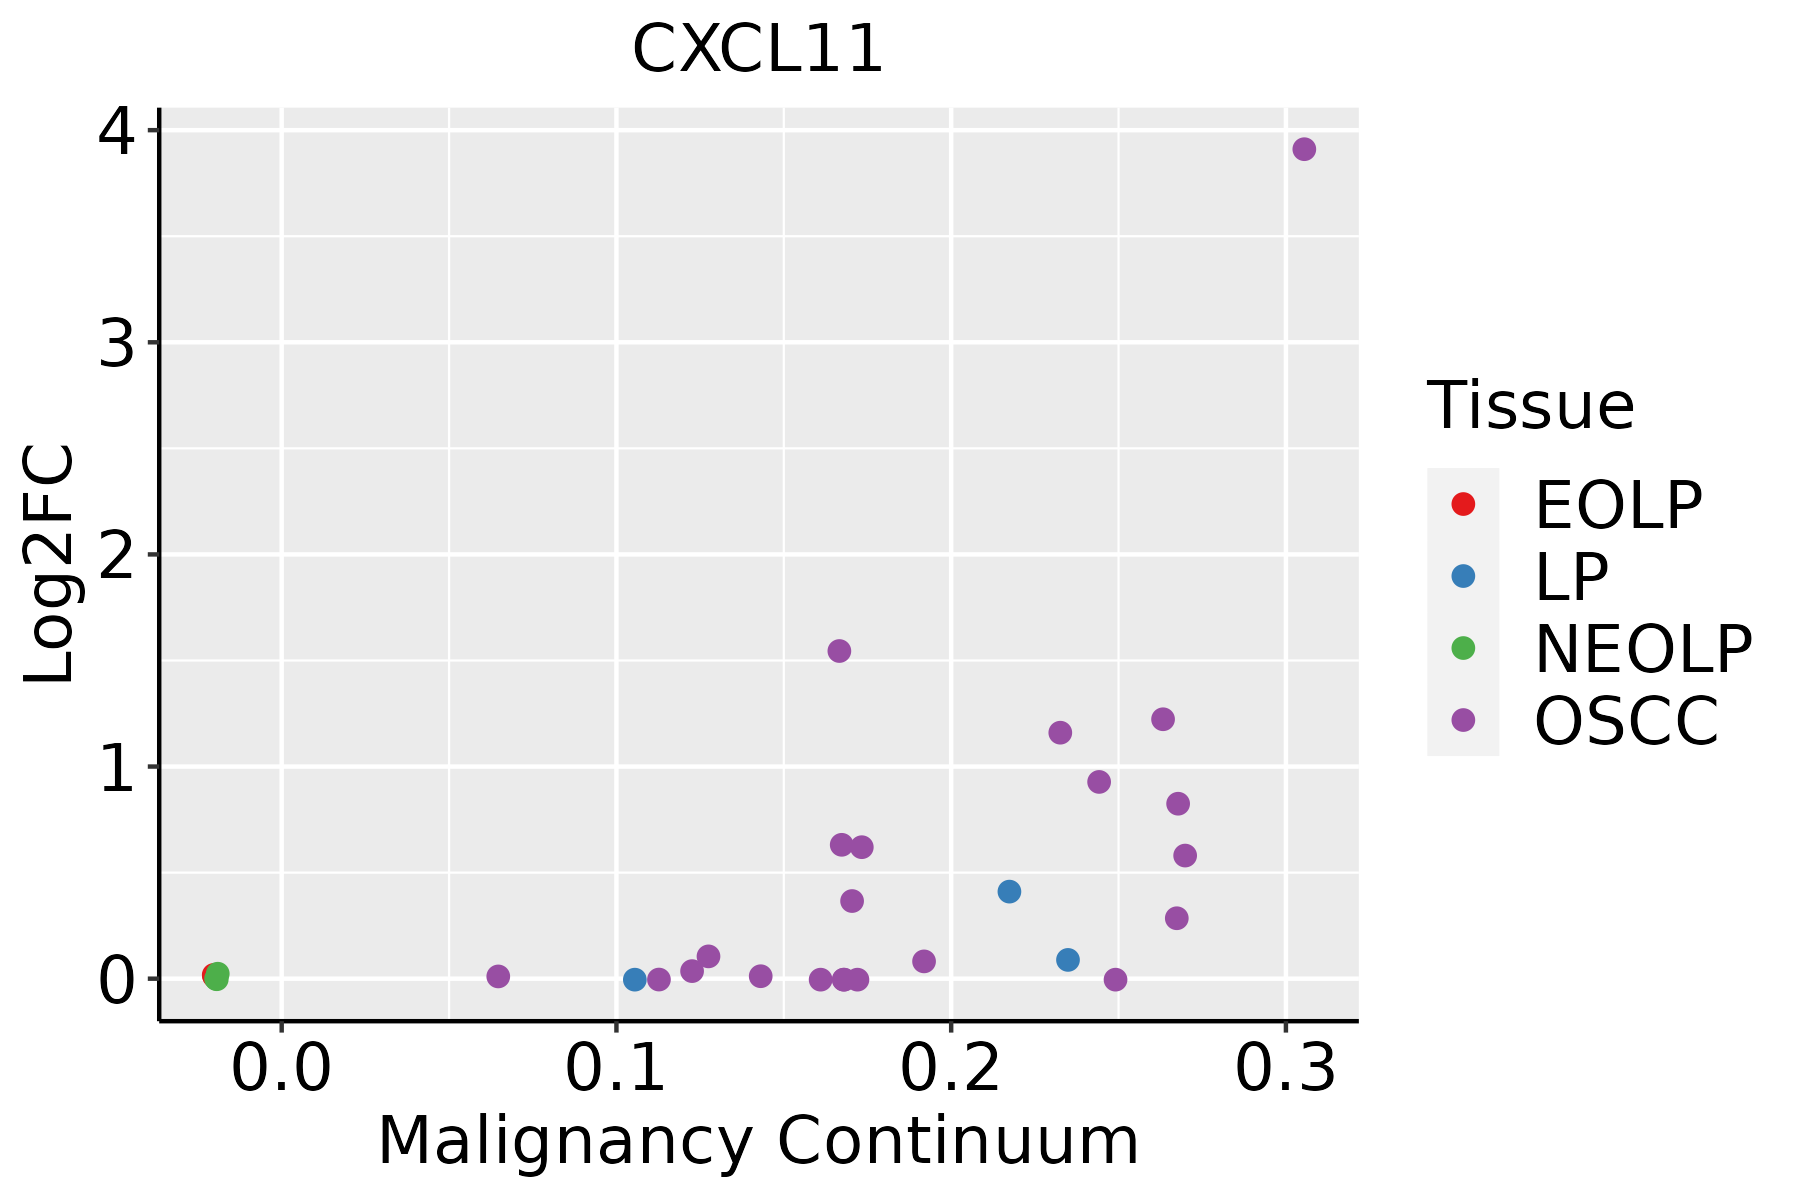 | EOLP: Erosive Oral lichen planus |
| LP: leukoplakia | ||
| NEOLP: Non-erosive oral lichen planus | ||
| OSCC: Oral squamous cell carcinoma | ||
| Skin |  | AK: Actinic keratosis |
| cSCC: Cutaneous squamous cell carcinoma | ||
| SCCIS:squamous cell carcinoma in situ |
| ∗log2FC in expression of this searched gene in stem-like cells from each diseased tissue sample relative to stem-like cells in normal samples in each tissue plotted against the malignancy continuum. Samples are colored based on if they are from different disease stage. |
Top |
Malignant transformation related pathway analysis |
| Find out the enriched GO biological processes and KEGG pathways involved in transition from healthy to precancer to cancer |
| Tissue | Disease Stage | Enriched GO biological Processes |
| Colorectum | AD |  |
| Colorectum | SER |  |
| Colorectum | MSS |  |
| Colorectum | MSI-H |  |
| Colorectum | FAP |  |
| ∗Top 15 enriched GO BP terms are showed in the bar plot of each disease state in each tissue. Each row represents a significant GO biological process which is colored according to the -log10(p.adjust). |
| Page: 1 2 3 4 5 6 7 8 9 |
| GO ID | Tissue | Disease Stage | Description | Gene Ratio | Bg Ratio | pvalue | p.adjust | Count |
| GO:0051235110 | Esophagus | ESCC | maintenance of location | 200/8552 | 327/18723 | 1.01e-08 | 2.02e-07 | 200 |
| GO:0051651111 | Esophagus | ESCC | maintenance of location in cell | 126/8552 | 214/18723 | 6.57e-05 | 5.00e-04 | 126 |
| GO:003249619 | Esophagus | ESCC | response to lipopolysaccharide | 191/8552 | 343/18723 | 1.11e-04 | 7.73e-04 | 191 |
| GO:000223719 | Esophagus | ESCC | response to molecule of bacterial origin | 194/8552 | 363/18723 | 1.64e-03 | 7.61e-03 | 194 |
| GO:007122215 | Esophagus | ESCC | cellular response to lipopolysaccharide | 113/8552 | 209/18723 | 8.79e-03 | 3.10e-02 | 113 |
| GO:007121617 | Esophagus | ESCC | cellular response to biotic stimulus | 131/8552 | 246/18723 | 9.85e-03 | 3.39e-02 | 131 |
| GO:005123521 | Liver | HCC | maintenance of location | 185/7958 | 327/18723 | 1.70e-07 | 3.12e-06 | 185 |
| GO:005165112 | Liver | HCC | maintenance of location in cell | 119/7958 | 214/18723 | 7.11e-05 | 6.39e-04 | 119 |
| GO:003249611 | Liver | HCC | response to lipopolysaccharide | 174/7958 | 343/18723 | 1.19e-03 | 6.62e-03 | 174 |
| GO:00712166 | Liver | HCC | cellular response to biotic stimulus | 128/7958 | 246/18723 | 1.53e-03 | 8.10e-03 | 128 |
| GO:00712226 | Liver | HCC | cellular response to lipopolysaccharide | 110/7958 | 209/18723 | 1.92e-03 | 9.77e-03 | 110 |
| GO:000223711 | Liver | HCC | response to molecule of bacterial origin | 181/7958 | 363/18723 | 2.58e-03 | 1.24e-02 | 181 |
| GO:00712196 | Liver | HCC | cellular response to molecule of bacterial origin | 113/7958 | 221/18723 | 5.73e-03 | 2.38e-02 | 113 |
| GO:005123518 | Oral cavity | OSCC | maintenance of location | 182/7305 | 327/18723 | 6.16e-10 | 1.58e-08 | 182 |
| GO:005165120 | Oral cavity | OSCC | maintenance of location in cell | 121/7305 | 214/18723 | 1.39e-07 | 2.32e-06 | 121 |
| GO:003249617 | Oral cavity | OSCC | response to lipopolysaccharide | 178/7305 | 343/18723 | 7.27e-07 | 1.03e-05 | 178 |
| GO:007121615 | Oral cavity | OSCC | cellular response to biotic stimulus | 129/7305 | 246/18723 | 1.20e-05 | 1.23e-04 | 129 |
| GO:000223717 | Oral cavity | OSCC | response to molecule of bacterial origin | 181/7305 | 363/18723 | 1.48e-05 | 1.49e-04 | 181 |
| GO:007122210 | Oral cavity | OSCC | cellular response to lipopolysaccharide | 110/7305 | 209/18723 | 4.15e-05 | 3.60e-04 | 110 |
| GO:00192214 | Oral cavity | OSCC | cytokine-mediated signaling pathway | 222/7305 | 472/18723 | 2.02e-04 | 1.35e-03 | 222 |
| Page: 1 2 |
| Pathway ID | Tissue | Disease Stage | Description | Gene Ratio | Bg Ratio | pvalue | p.adjust | qvalue | Count |
| hsa04620 | Oral cavity | OSCC | Toll-like receptor signaling pathway | 58/3704 | 104/8465 | 8.77e-03 | 1.98e-02 | 1.01e-02 | 58 |
| hsa046201 | Oral cavity | OSCC | Toll-like receptor signaling pathway | 58/3704 | 104/8465 | 8.77e-03 | 1.98e-02 | 1.01e-02 | 58 |
| Page: 1 |
Top |
Cell-cell communication analysis |
| Identification of potential cell-cell interactions between two cell types and their ligand-receptor pairs for different disease states |
| Ligand | Receptor | LRpair | Pathway | Tissue | Disease Stage |
| CXCL11 | ACKR1 | CXCL11_ACKR1 | CXCL | Esophagus | ESCC |
| CXCL11 | ACKR3 | CXCL11_ACKR3 | CXCL | Esophagus | ESCC |
| CXCL11 | ACKR1 | CXCL11_ACKR1 | CXCL | Skin | cSCC |
| CXCL11 | CXCR3 | CXCL11_CXCR3 | CXCL | Skin | cSCC |
| Page: 1 |
Top |
Single-cell gene regulatory network inference analysis |
| Find out the significant the regulons (TFs) and the target genes of each regulon across cell types for different disease states |
| TF | Cell Type | Tissue | Disease Stage | Target Gene | RSS | Regulon Activity |
| ∗The dot plots of a searched regulon are shown for all cell subpopulations in each disease state of each tissue based on the regulon specific score inferred using pySCENIC and by calculating the average expression. |
| Page: 1 |
Top |
Somatic mutation of malignant transformation related genes |
| Annotation of somatic variants for genes involved in malignant transformation |
| Hugo Symbol | Variant Class | Variant Classification | dbSNP RS | HGVSc | HGVSp | HGVSp Short | SWISSPROT | BIOTYPE | SIFT | PolyPhen | Tumor Sample Barcode | Tissue | Histology | Sex | Age | Stage | Therapy Types | Drugs | Outcome |
| CXCL11 | SNV | Missense_Mutation | novel | c.214C>A | p.Gln72Lys | p.Q72K | O14625 | protein_coding | tolerated(0.24) | benign(0.393) | TCGA-BH-A1FN-01 | Breast | breast invasive carcinoma | Female | <65 | I/II | Unknown | Unknown | PD |
| CXCL11 | SNV | Missense_Mutation | novel | c.22N>G | p.Ile8Val | p.I8V | O14625 | protein_coding | tolerated(0.6) | benign(0) | TCGA-AA-3877-01 | Colorectum | colon adenocarcinoma | Female | >=65 | I/II | Unknown | Unknown | SD |
| CXCL11 | SNV | Missense_Mutation | novel | c.276N>T | p.Lys92Asn | p.K92N | O14625 | protein_coding | tolerated(0.1) | benign(0.221) | TCGA-AZ-4315-01 | Colorectum | colon adenocarcinoma | Male | <65 | I/II | Unknown | Unknown | SD |
| CXCL11 | SNV | Missense_Mutation | novel | c.167N>G | p.Asn56Ser | p.N56S | O14625 | protein_coding | tolerated(1) | benign(0.013) | TCGA-AG-A002-01 | Colorectum | rectum adenocarcinoma | Male | <65 | I/II | Unknown | Unknown | SD |
| CXCL11 | SNV | Missense_Mutation | novel | c.109G>A | p.Val37Ile | p.V37I | O14625 | protein_coding | tolerated(0.09) | benign(0.119) | TCGA-A5-A0G2-01 | Endometrium | uterine corpus endometrioid carcinoma | Female | <65 | III/IV | Unknown | Unknown | SD |
| CXCL11 | SNV | Missense_Mutation | rs768099347 | c.263N>G | p.Lys88Arg | p.K88R | O14625 | protein_coding | tolerated(0.32) | benign(0.007) | TCGA-AJ-A3EK-01 | Endometrium | uterine corpus endometrioid carcinoma | Female | <65 | I/II | Chemotherapy | carboplatin | CR |
| CXCL11 | SNV | Missense_Mutation | novel | c.52N>A | p.Val18Ile | p.V18I | O14625 | protein_coding | tolerated(0.8) | benign(0) | TCGA-AP-A056-01 | Endometrium | uterine corpus endometrioid carcinoma | Female | <65 | I/II | Unknown | Unknown | SD |
| CXCL11 | SNV | Missense_Mutation | rs375210045 | c.86N>A | p.Arg29His | p.R29H | O14625 | protein_coding | deleterious(0) | probably_damaging(0.927) | TCGA-AX-A1CE-01 | Endometrium | uterine corpus endometrioid carcinoma | Female | <65 | I/II | Unspecific | Paclitaxel | SD |
| CXCL11 | SNV | Missense_Mutation | rs372692015 | c.236C>T | p.Ser79Leu | p.S79L | O14625 | protein_coding | deleterious(0.03) | benign(0.033) | TCGA-BK-A6W3-01 | Endometrium | uterine corpus endometrioid carcinoma | Female | <65 | I/II | Unknown | Unknown | SD |
| CXCL11 | SNV | Missense_Mutation | rs377189872 | c.85N>T | p.Arg29Cys | p.R29C | O14625 | protein_coding | deleterious(0.03) | benign(0.077) | TCGA-EO-A3AY-01 | Endometrium | uterine corpus endometrioid carcinoma | Female | <65 | I/II | Unknown | Unknown | PD |
| Page: 1 2 |
Top |
Related drugs of malignant transformation related genes |
| Identification of chemicals and drugs interact with genes involved in malignant transfromation |
| (DGIdb 4.0) |
| Entrez ID | Symbol | Category | Interaction Types | Drug Claim Name | Drug Name | PMIDs |
| Page: 1 |

Copyright 2023-Present -The University of Texas Health Science Center at Houston |