
|
|||||
|
 | |
| |
| |
| |
| |
| |
|
Gene: CXADR |
Gene summary for CXADR |
| Gene information | Species | Human | Gene symbol | CXADR | Gene ID | 1525 |
| Gene name | CXADR Ig-like cell adhesion molecule | |
| Gene Alias | CAR | |
| Cytomap | 21q21.1 | |
| Gene Type | protein-coding | GO ID | GO:0000003 | UniProtAcc | P78310 |
Top |
Malignant transformation analysis |
| Identification of the aberrant gene expression in precancerous and cancerous lesions by comparing the gene expression of stem-like cells in diseased tissues with normal stem cells |
| Entrez ID | Symbol | Replicates | Species | Organ | Tissue | Adj P-value | Log2FC | Malignancy |
| 1525 | CXADR | GSM4909282 | Human | Breast | IDC | 1.14e-17 | 6.30e-01 | -0.0288 |
| 1525 | CXADR | GSM4909285 | Human | Breast | IDC | 3.05e-22 | 6.32e-01 | 0.21 |
| 1525 | CXADR | GSM4909291 | Human | Breast | IDC | 5.16e-05 | -2.57e-01 | 0.1753 |
| 1525 | CXADR | GSM4909293 | Human | Breast | IDC | 1.95e-03 | -2.03e-01 | 0.1581 |
| 1525 | CXADR | GSM4909296 | Human | Breast | IDC | 4.19e-11 | -2.21e-01 | 0.1524 |
| 1525 | CXADR | GSM4909297 | Human | Breast | IDC | 1.49e-04 | 1.10e-01 | 0.1517 |
| 1525 | CXADR | GSM4909301 | Human | Breast | IDC | 3.21e-04 | -1.67e-01 | 0.1577 |
| 1525 | CXADR | GSM4909306 | Human | Breast | IDC | 2.29e-02 | -1.86e-01 | 0.1564 |
| 1525 | CXADR | GSM4909311 | Human | Breast | IDC | 4.96e-14 | -2.18e-01 | 0.1534 |
| 1525 | CXADR | GSM4909312 | Human | Breast | IDC | 6.55e-03 | -3.75e-02 | 0.1552 |
| 1525 | CXADR | GSM4909319 | Human | Breast | IDC | 2.31e-15 | -2.69e-01 | 0.1563 |
| 1525 | CXADR | GSM4909320 | Human | Breast | IDC | 1.65e-03 | -2.39e-01 | 0.1575 |
| 1525 | CXADR | GSM4909321 | Human | Breast | IDC | 6.00e-08 | -1.54e-01 | 0.1559 |
| 1525 | CXADR | brca2 | Human | Breast | Precancer | 9.16e-06 | 3.75e-01 | -0.024 |
| 1525 | CXADR | brca3 | Human | Breast | Precancer | 3.54e-04 | 2.93e-01 | -0.0263 |
| 1525 | CXADR | M1 | Human | Breast | IDC | 1.45e-02 | -2.36e-01 | 0.1577 |
| 1525 | CXADR | NCCBC14 | Human | Breast | DCIS | 4.79e-04 | -1.21e-01 | 0.2021 |
| 1525 | CXADR | NCCBC5 | Human | Breast | DCIS | 1.71e-08 | -2.31e-01 | 0.2046 |
| 1525 | CXADR | P1 | Human | Breast | IDC | 2.40e-08 | -2.60e-01 | 0.1527 |
| 1525 | CXADR | DCIS2 | Human | Breast | DCIS | 3.56e-37 | 1.04e-01 | 0.0085 |
| Page: 1 2 3 4 5 6 7 8 9 10 11 12 |
| Tissue | Expression Dynamics | Abbreviation |
| Breast | 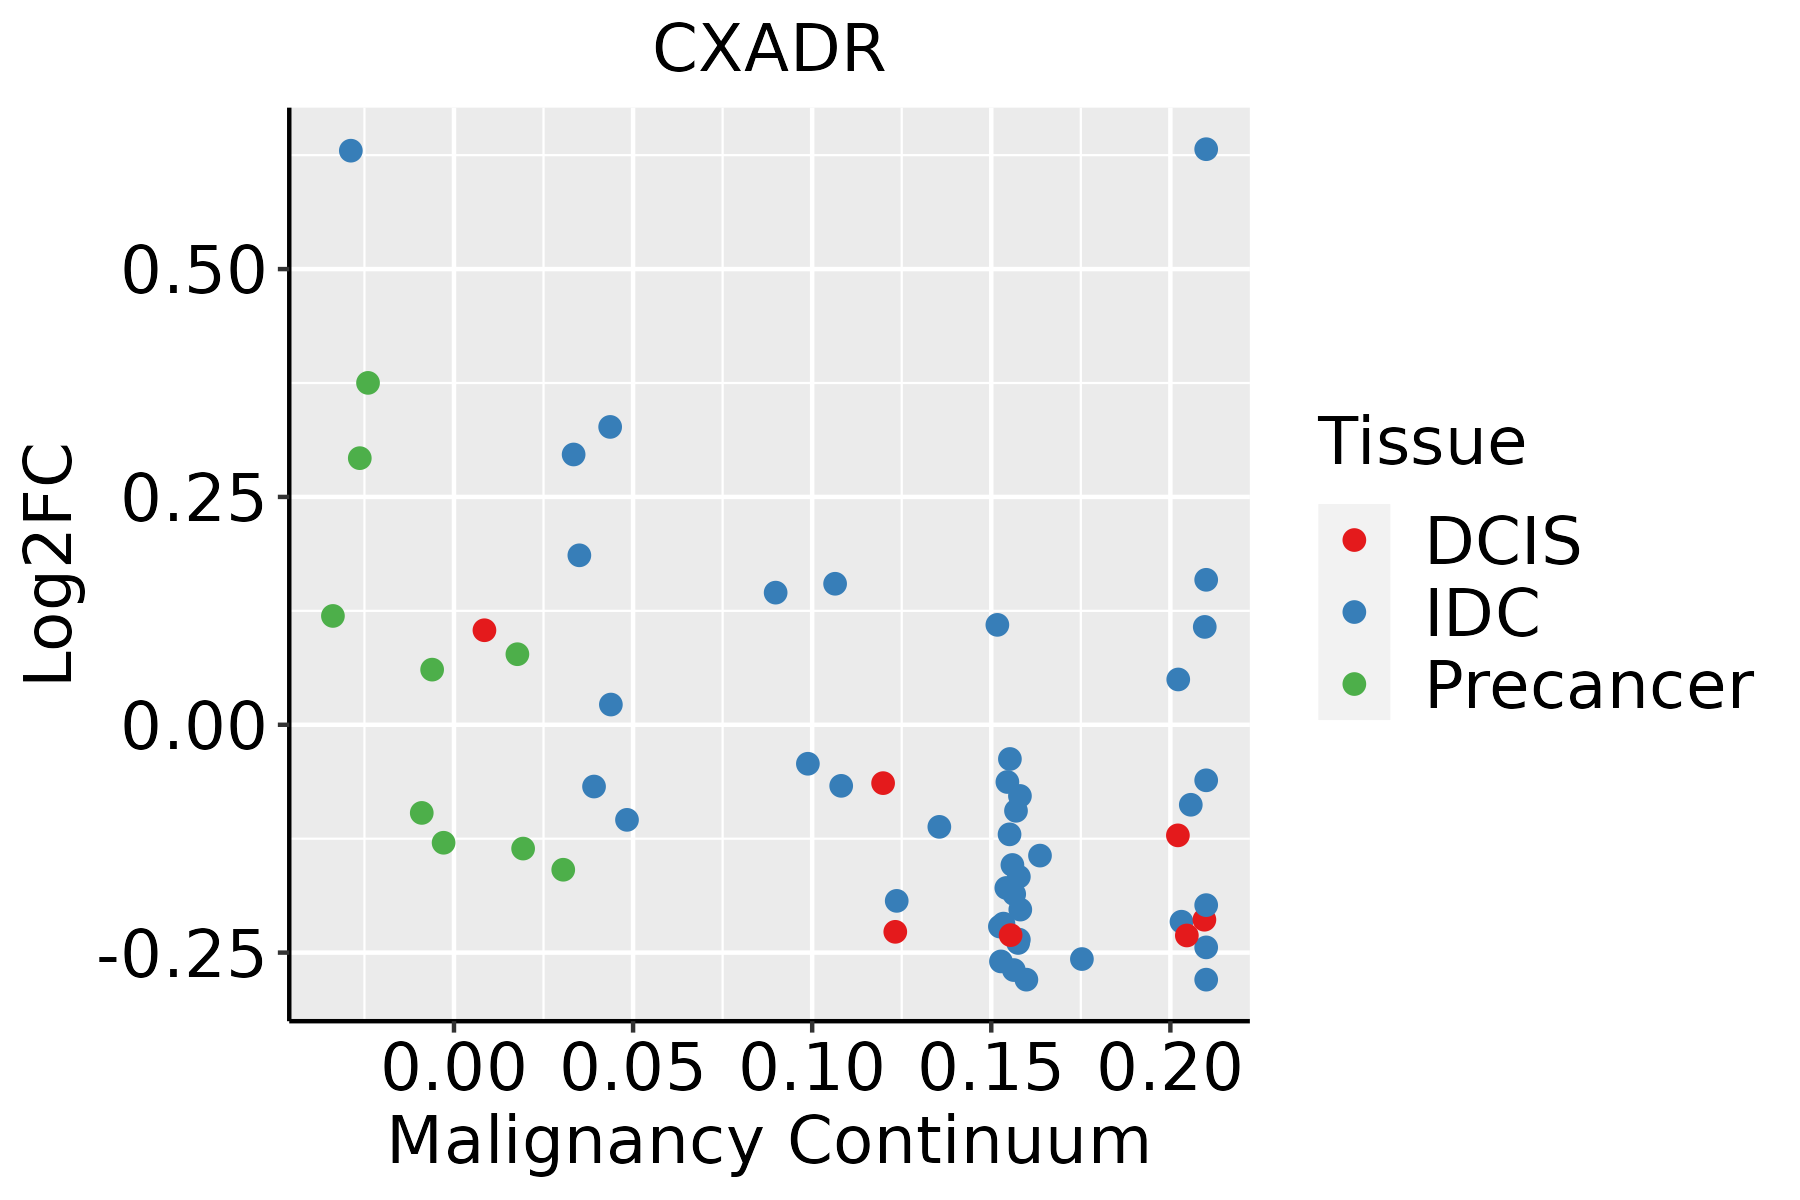 | IDC: Invasive ductal carcinoma |
| DCIS: Ductal carcinoma in situ | ||
| Precancer(BRCA1-mut): Precancerous lesion from BRCA1 mutation carriers | ||
| Colorectum (GSE201348) |  | FAP: Familial adenomatous polyposis |
| CRC: Colorectal cancer | ||
| Colorectum (HTA11) |  | AD: Adenomas |
| SER: Sessile serrated lesions | ||
| MSI-H: Microsatellite-high colorectal cancer | ||
| MSS: Microsatellite stable colorectal cancer | ||
| Endometrium |  | AEH: Atypical endometrial hyperplasia |
| EEC: Endometrioid Cancer | ||
| Esophagus | 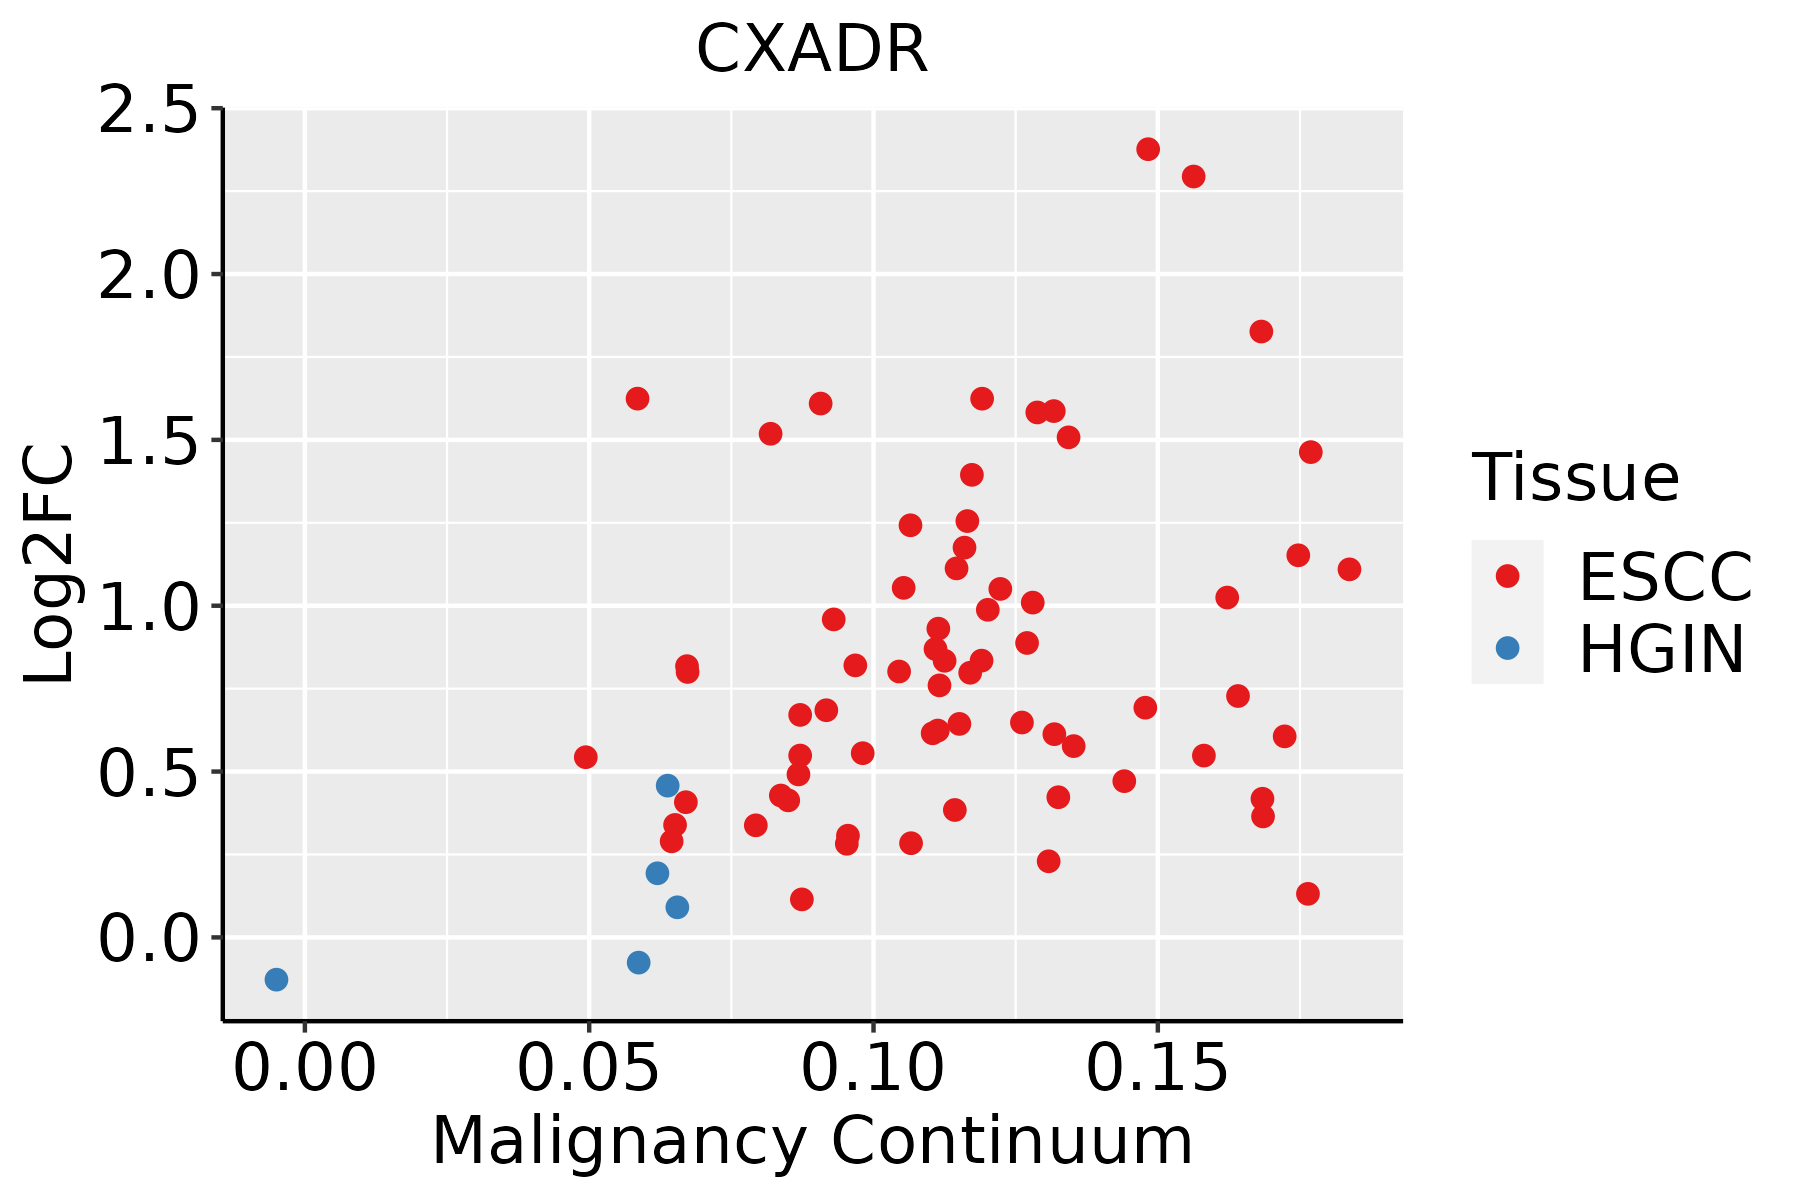 | ESCC: Esophageal squamous cell carcinoma |
| HGIN: High-grade intraepithelial neoplasias | ||
| LGIN: Low-grade intraepithelial neoplasias | ||
| GC | 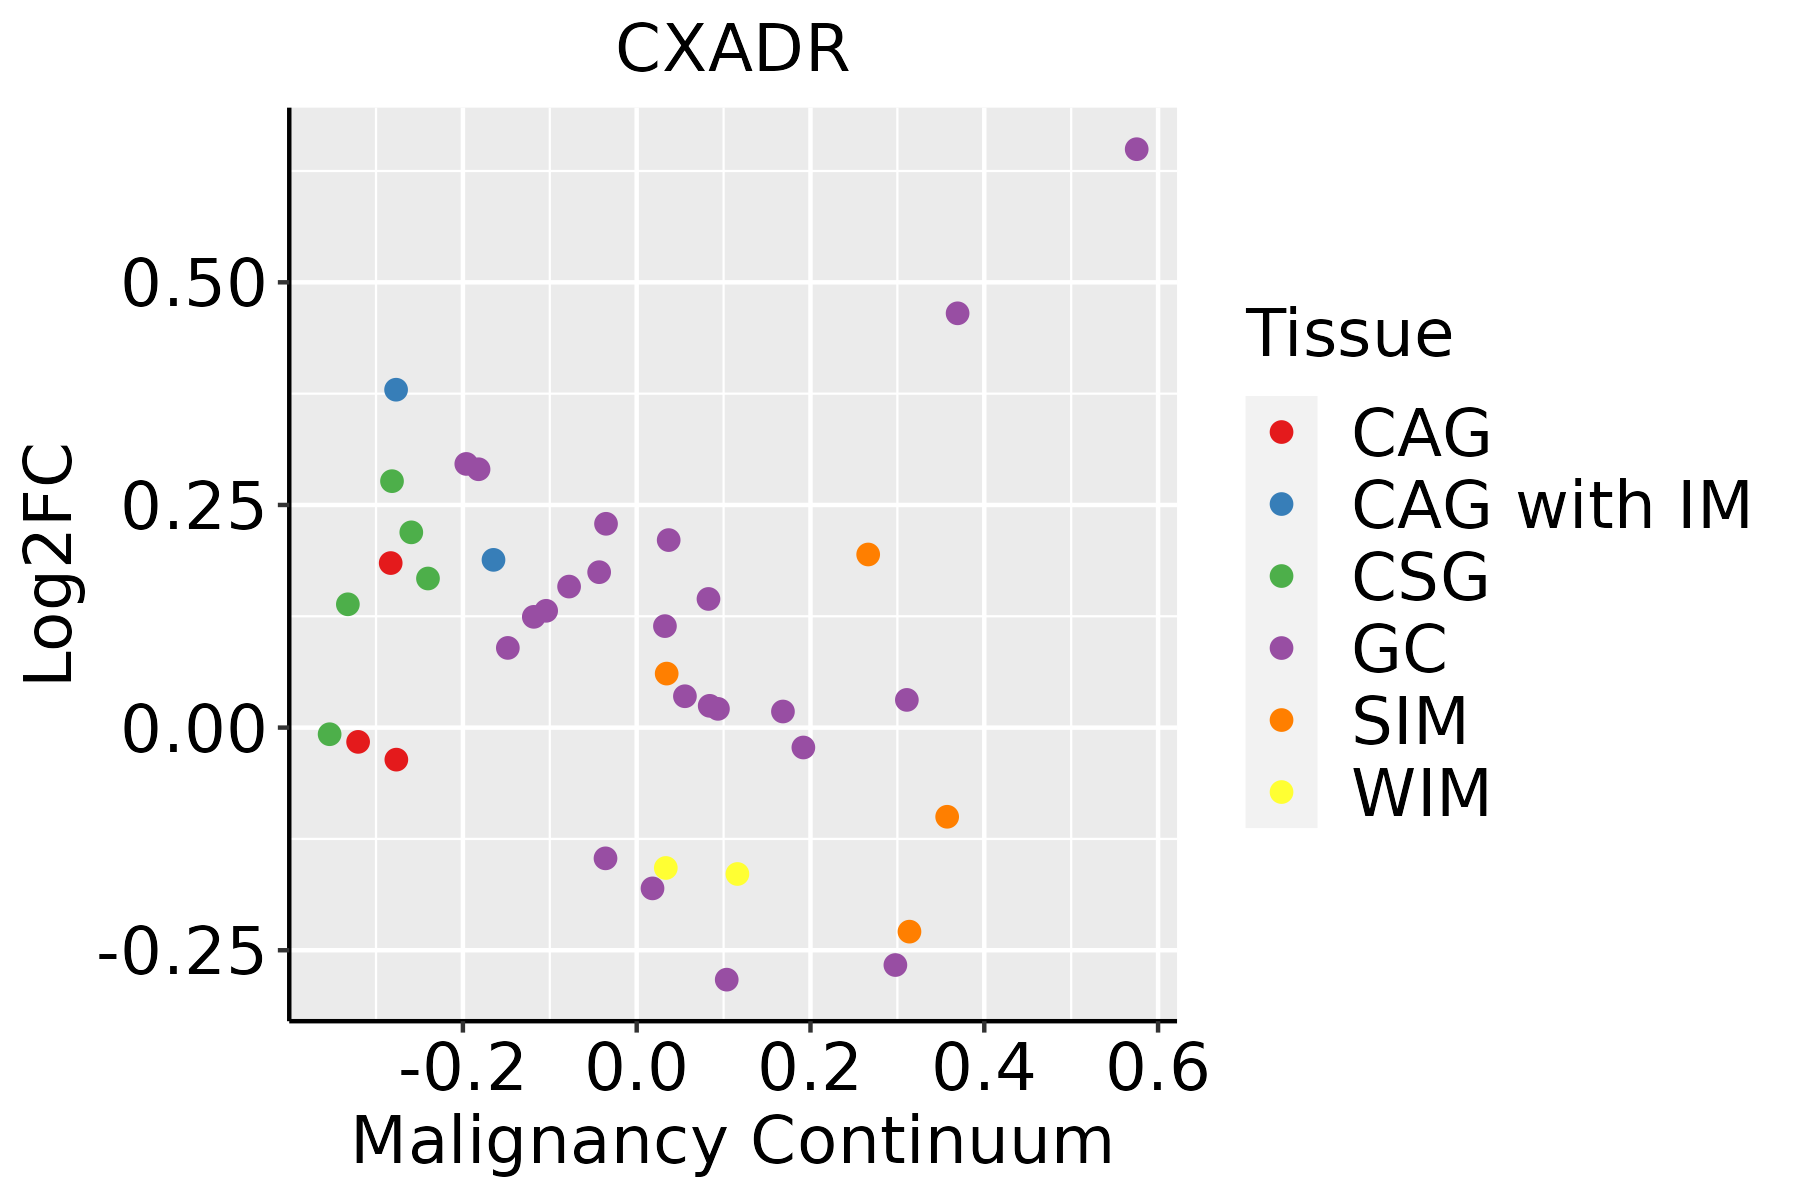 | CAG: Chronic atrophic gastritis |
| CAG with IM: Chronic atrophic gastritis with intestinal metaplasia | ||
| CSG: Chronic superficial gastritis | ||
| GC: Gastric cancer | ||
| SIM: Severe intestinal metaplasia | ||
| WIM: Wild intestinal metaplasia | ||
| Liver |  | HCC: Hepatocellular carcinoma |
| NAFLD: Non-alcoholic fatty liver disease | ||
| Lung |  | AAH: Atypical adenomatous hyperplasia |
| AIS: Adenocarcinoma in situ | ||
| IAC: Invasive lung adenocarcinoma | ||
| MIA: Minimally invasive adenocarcinoma | ||
| Oral Cavity |  | EOLP: Erosive Oral lichen planus |
| LP: leukoplakia | ||
| NEOLP: Non-erosive oral lichen planus | ||
| OSCC: Oral squamous cell carcinoma | ||
| Prostate | 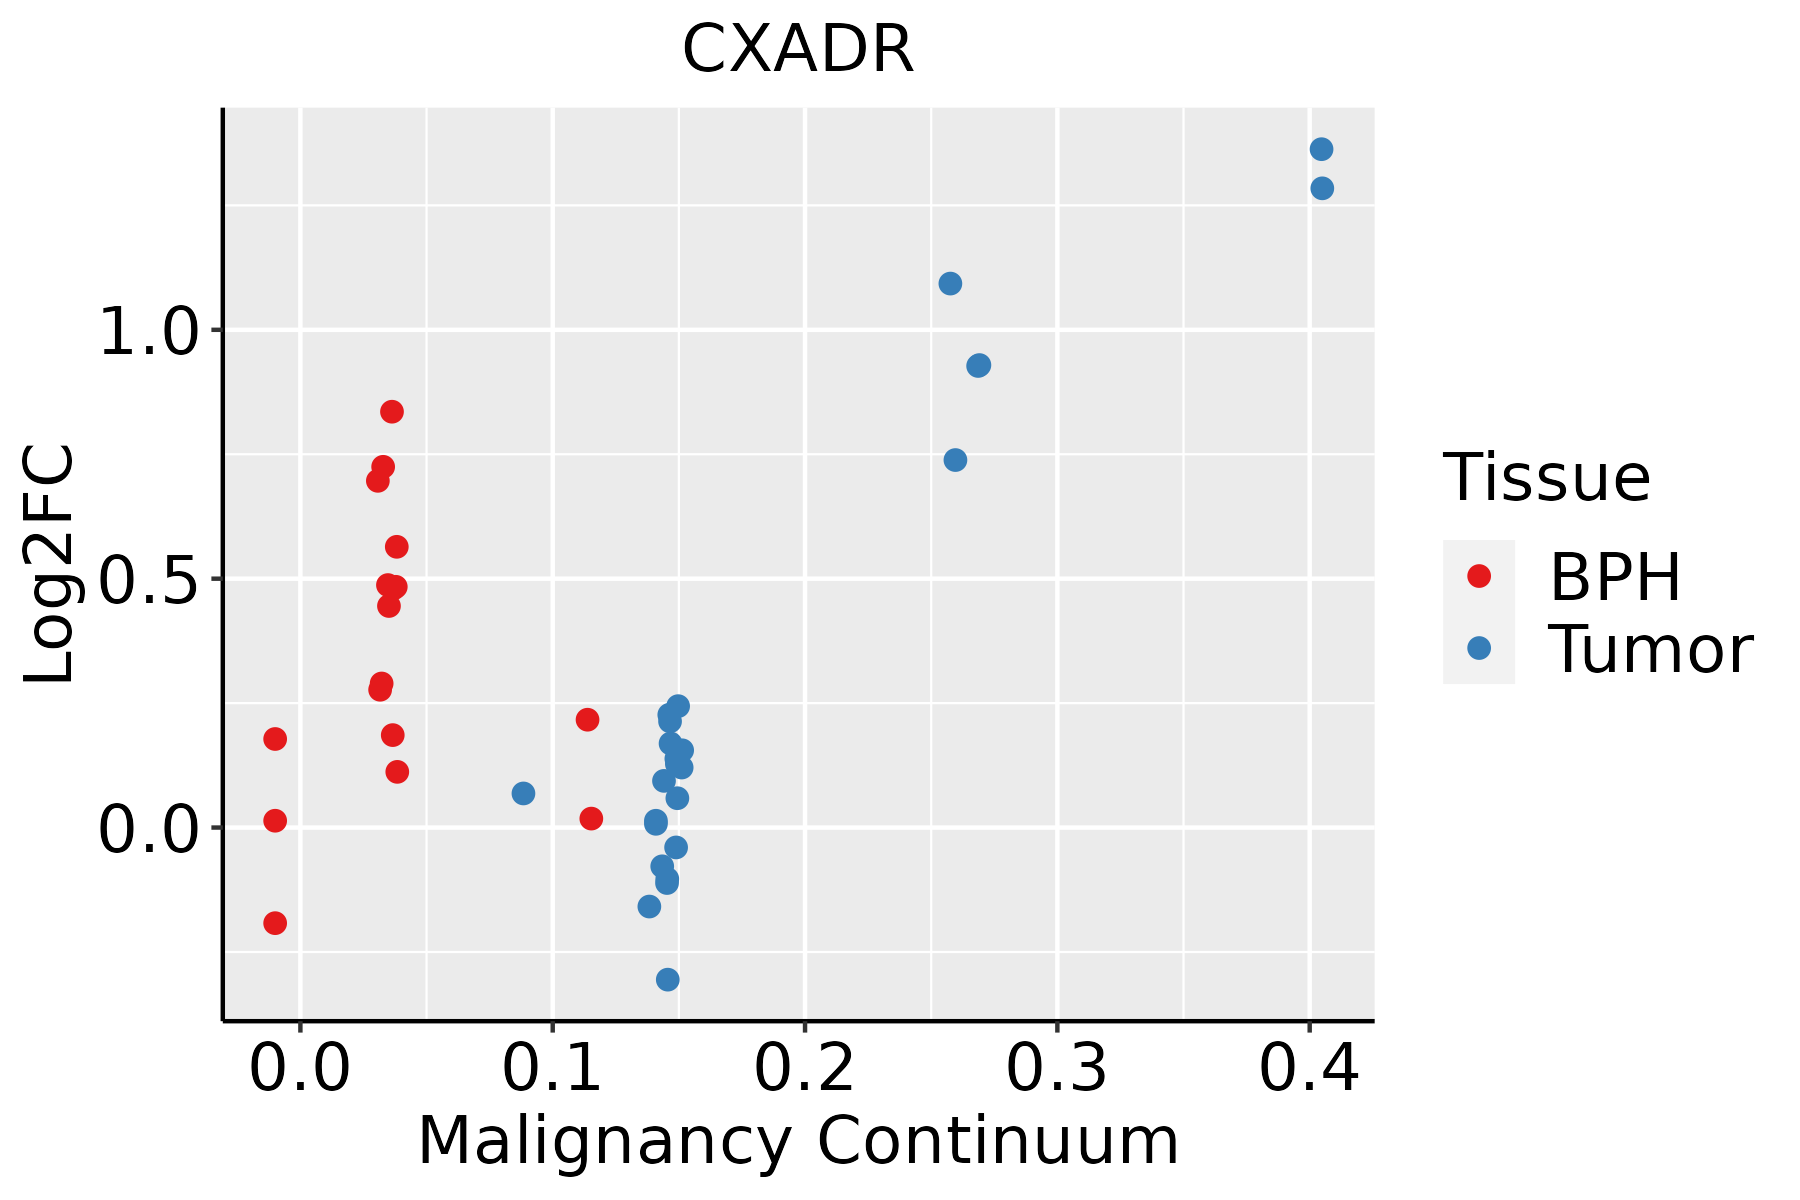 | BPH: Benign Prostatic Hyperplasia |
| Skin | 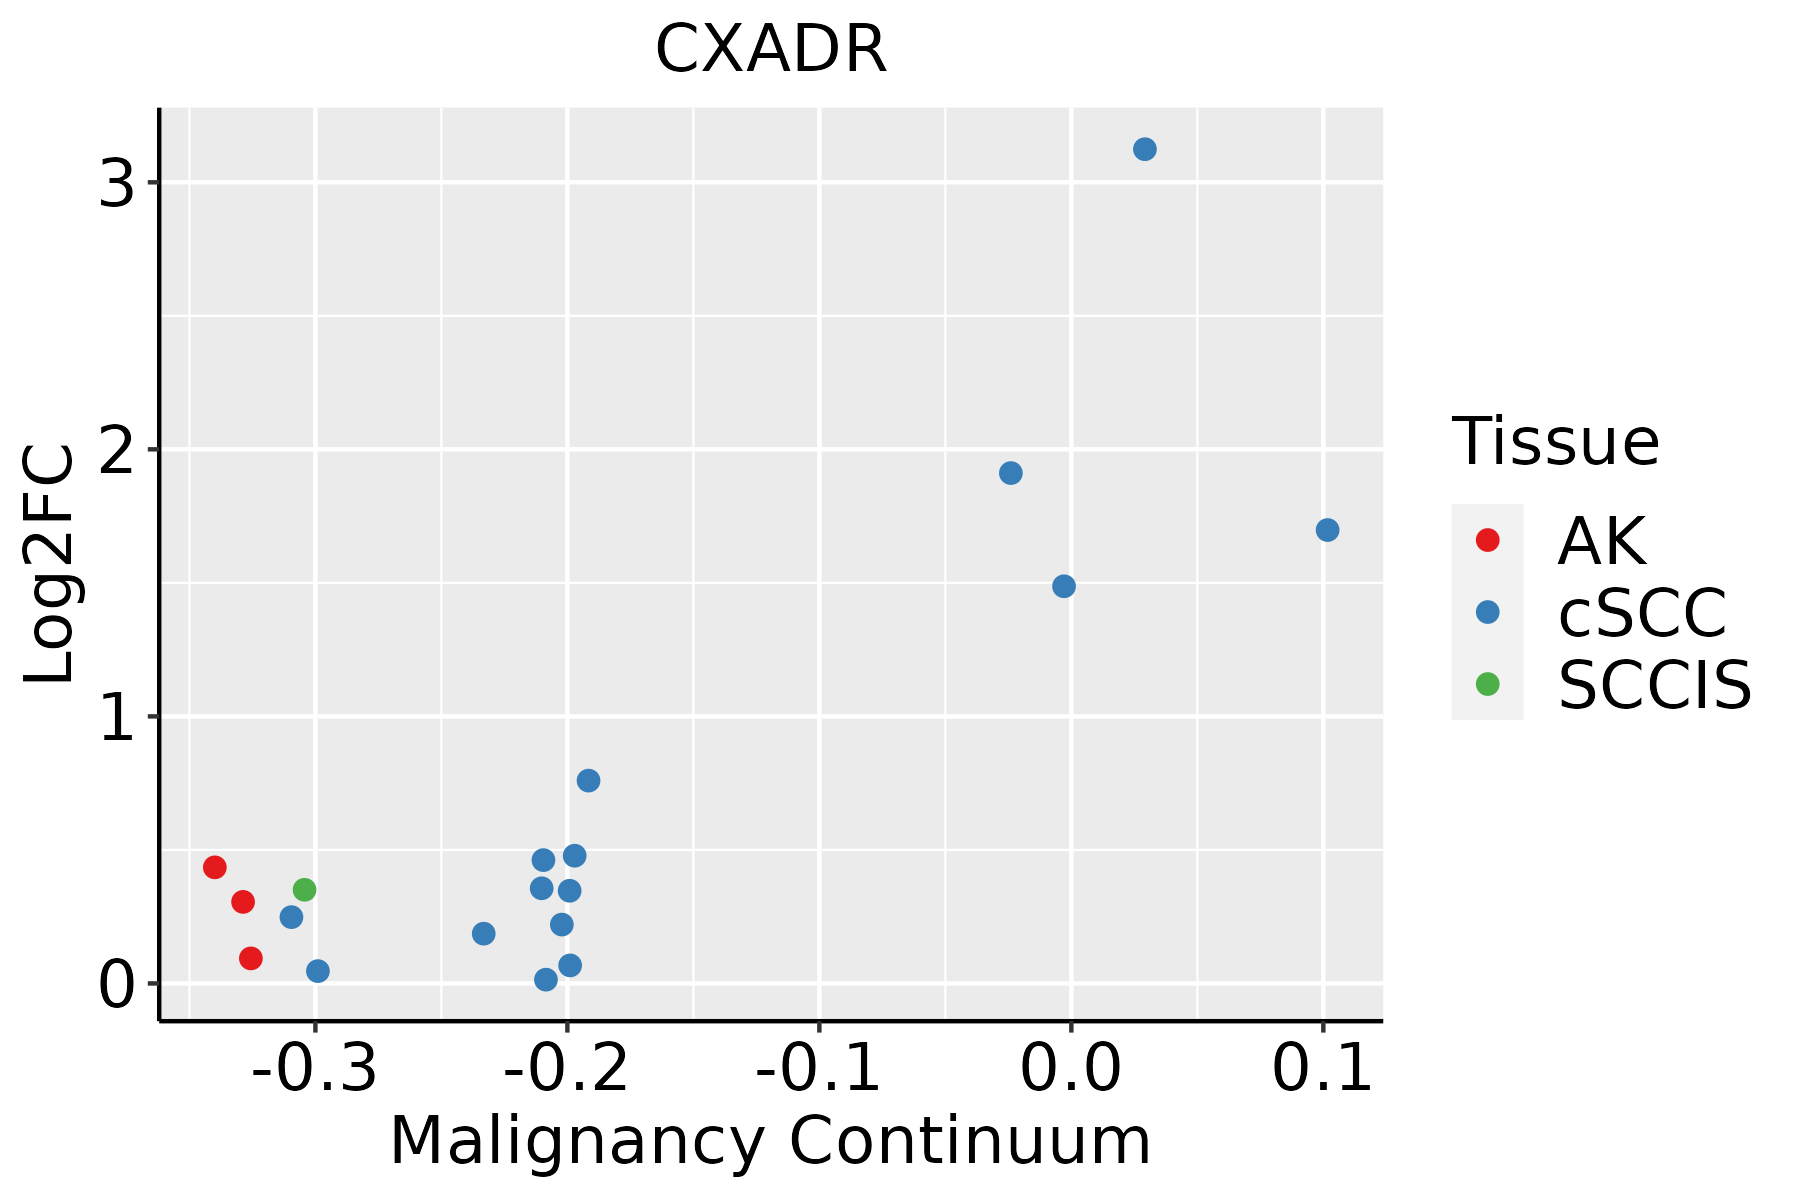 | AK: Actinic keratosis |
| cSCC: Cutaneous squamous cell carcinoma | ||
| SCCIS:squamous cell carcinoma in situ | ||
| Thyroid | 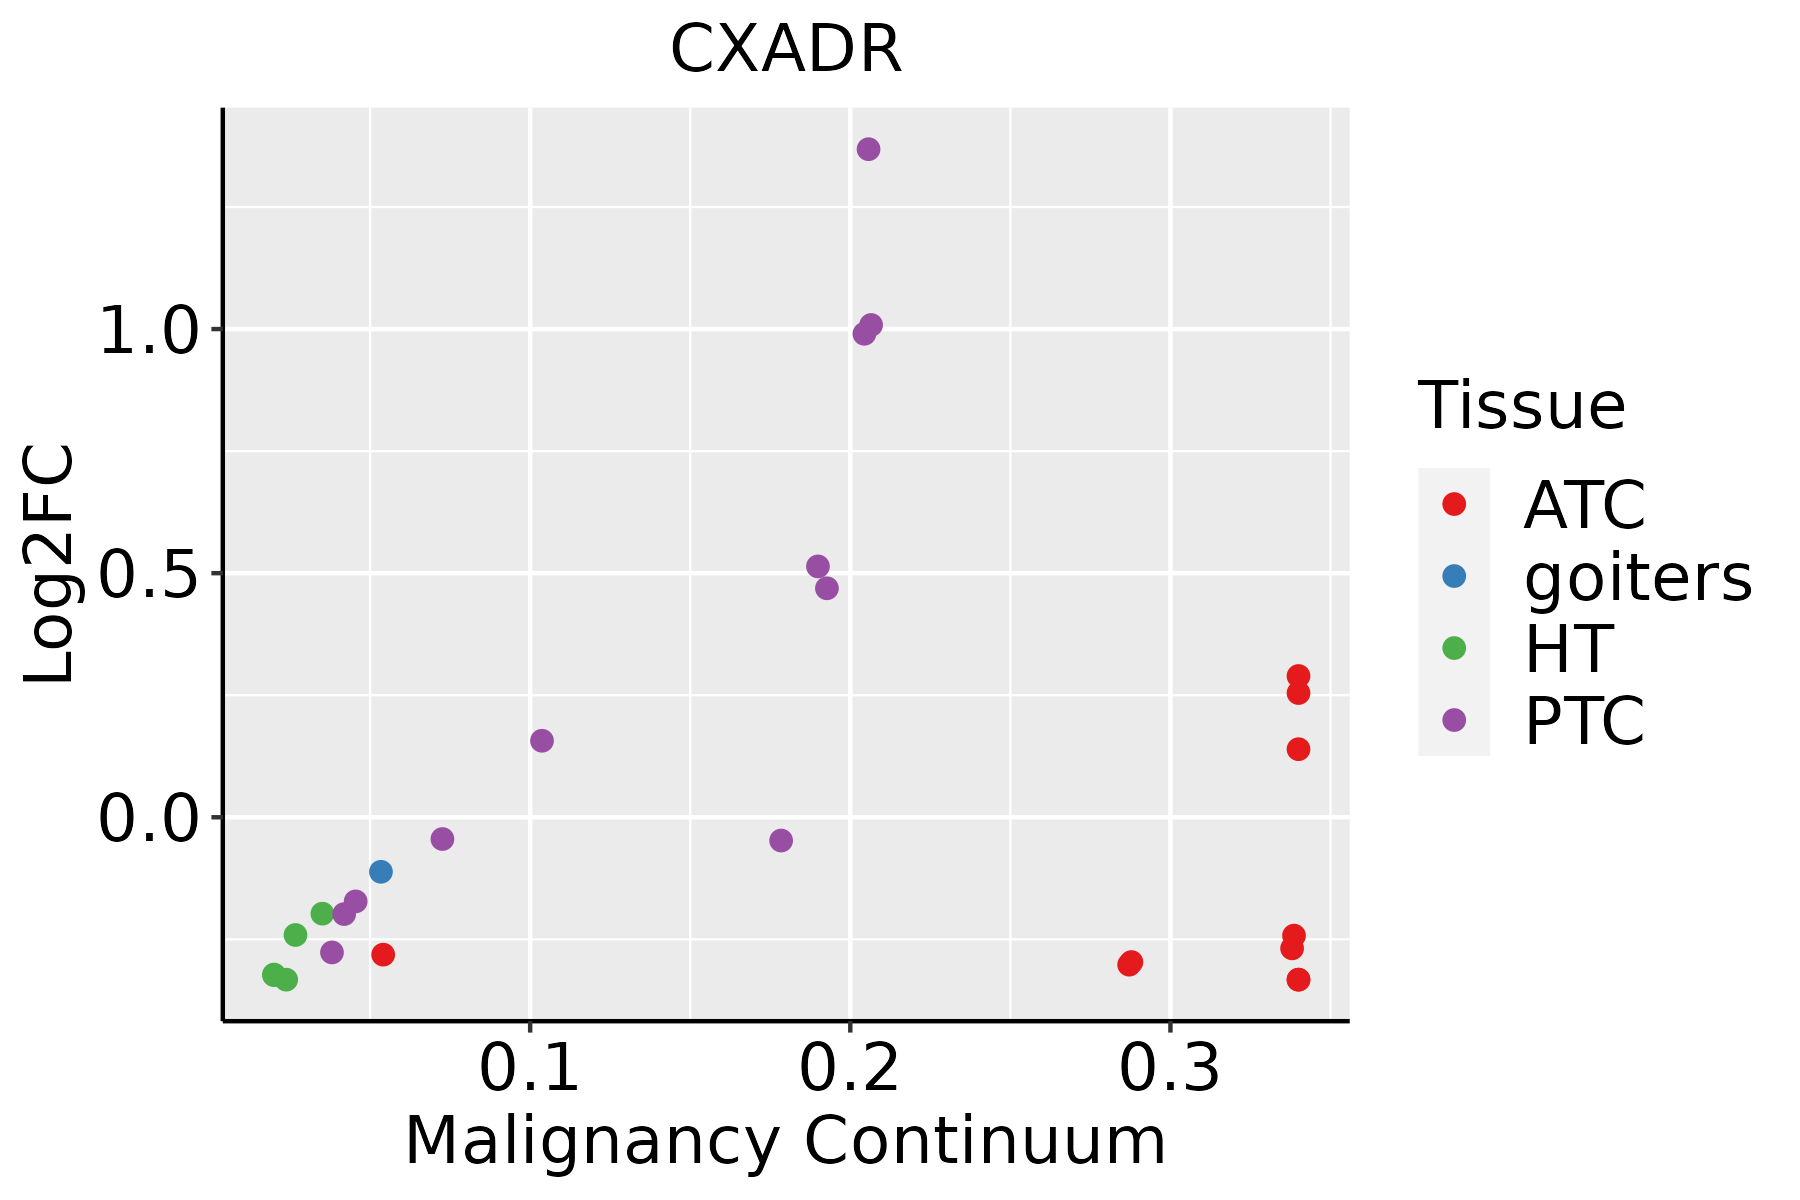 | ATC: Anaplastic thyroid cancer |
| HT: Hashimoto's thyroiditis | ||
| PTC: Papillary thyroid cancer |
| ∗log2FC in expression of this searched gene in stem-like cells from each diseased tissue sample relative to stem-like cells in normal samples in each tissue plotted against the malignancy continuum. Samples are colored based on if they are from different disease stage. |
Top |
Malignant transformation related pathway analysis |
| Find out the enriched GO biological processes and KEGG pathways involved in transition from healthy to precancer to cancer |
| Tissue | Disease Stage | Enriched GO biological Processes |
| Colorectum | AD |  |
| Colorectum | SER |  |
| Colorectum | MSS |  |
| Colorectum | MSI-H |  |
| Colorectum | FAP |  |
| ∗Top 15 enriched GO BP terms are showed in the bar plot of each disease state in each tissue. Each row represents a significant GO biological process which is colored according to the -log10(p.adjust). |
| Page: 1 2 3 4 5 6 7 8 9 |
| GO ID | Tissue | Disease Stage | Description | Gene Ratio | Bg Ratio | pvalue | p.adjust | Count |
| GO:00160329 | Breast | Precancer | viral process | 58/1080 | 415/18723 | 3.42e-10 | 3.16e-08 | 58 |
| GO:00190589 | Breast | Precancer | viral life cycle | 47/1080 | 317/18723 | 2.42e-09 | 1.99e-07 | 47 |
| GO:00444039 | Breast | Precancer | biological process involved in symbiotic interaction | 42/1080 | 290/18723 | 3.40e-08 | 2.11e-06 | 42 |
| GO:00975297 | Breast | Precancer | myeloid leukocyte migration | 34/1080 | 220/18723 | 1.42e-07 | 7.82e-06 | 34 |
| GO:00521269 | Breast | Precancer | movement in host environment | 29/1080 | 175/18723 | 2.59e-07 | 1.28e-05 | 29 |
| GO:00509006 | Breast | Precancer | leukocyte migration | 47/1080 | 369/18723 | 2.82e-07 | 1.39e-05 | 47 |
| GO:00305956 | Breast | Precancer | leukocyte chemotaxis | 34/1080 | 230/18723 | 4.16e-07 | 1.89e-05 | 34 |
| GO:00603266 | Breast | Precancer | cell chemotaxis | 41/1080 | 310/18723 | 5.99e-07 | 2.55e-05 | 41 |
| GO:00517019 | Breast | Precancer | biological process involved in interaction with host | 31/1080 | 203/18723 | 6.52e-07 | 2.71e-05 | 31 |
| GO:00716217 | Breast | Precancer | granulocyte chemotaxis | 23/1080 | 125/18723 | 6.73e-07 | 2.77e-05 | 23 |
| GO:00444099 | Breast | Precancer | entry into host | 25/1080 | 151/18723 | 1.74e-06 | 6.19e-05 | 25 |
| GO:00467189 | Breast | Precancer | viral entry into host cell | 24/1080 | 144/18723 | 2.46e-06 | 8.35e-05 | 24 |
| GO:00341099 | Breast | Precancer | homotypic cell-cell adhesion | 18/1080 | 90/18723 | 3.15e-06 | 1.03e-04 | 18 |
| GO:00975307 | Breast | Precancer | granulocyte migration | 24/1080 | 148/18723 | 4.04e-06 | 1.26e-04 | 24 |
| GO:00305937 | Breast | Precancer | neutrophil chemotaxis | 19/1080 | 103/18723 | 5.94e-06 | 1.71e-04 | 19 |
| GO:00421107 | Breast | Precancer | T cell activation | 52/1080 | 487/18723 | 1.37e-05 | 3.42e-04 | 52 |
| GO:19902665 | Breast | Precancer | neutrophil migration | 20/1080 | 122/18723 | 2.13e-05 | 4.99e-04 | 20 |
| GO:00018948 | Breast | Precancer | tissue homeostasis | 27/1080 | 268/18723 | 3.49e-03 | 2.90e-02 | 27 |
| GO:00605374 | Breast | Precancer | muscle tissue development | 37/1080 | 403/18723 | 3.60e-03 | 2.98e-02 | 37 |
| GO:00147063 | Breast | Precancer | striated muscle tissue development | 35/1080 | 384/18723 | 5.10e-03 | 3.83e-02 | 35 |
| Page: 1 2 3 4 5 6 7 8 9 10 11 12 13 14 15 16 17 18 19 20 21 22 23 24 25 26 27 28 29 30 31 32 |
| Pathway ID | Tissue | Disease Stage | Description | Gene Ratio | Bg Ratio | pvalue | p.adjust | qvalue | Count |
| hsa0541618 | Breast | Precancer | Viral myocarditis | 14/684 | 60/8465 | 2.32e-04 | 1.98e-03 | 1.52e-03 | 14 |
| hsa0541619 | Breast | Precancer | Viral myocarditis | 14/684 | 60/8465 | 2.32e-04 | 1.98e-03 | 1.52e-03 | 14 |
| hsa0541623 | Breast | IDC | Viral myocarditis | 18/867 | 60/8465 | 1.85e-05 | 2.01e-04 | 1.50e-04 | 18 |
| hsa0541633 | Breast | IDC | Viral myocarditis | 18/867 | 60/8465 | 1.85e-05 | 2.01e-04 | 1.50e-04 | 18 |
| hsa0541642 | Breast | DCIS | Viral myocarditis | 19/846 | 60/8465 | 3.12e-06 | 4.20e-05 | 3.09e-05 | 19 |
| hsa0541652 | Breast | DCIS | Viral myocarditis | 19/846 | 60/8465 | 3.12e-06 | 4.20e-05 | 3.09e-05 | 19 |
| hsa0541626 | Endometrium | EEC | Viral myocarditis | 28/1237 | 60/8465 | 2.81e-09 | 5.77e-08 | 4.30e-08 | 28 |
| hsa0541635 | Endometrium | EEC | Viral myocarditis | 28/1237 | 60/8465 | 2.81e-09 | 5.77e-08 | 4.30e-08 | 28 |
| hsa0541630 | Esophagus | ESCC | Viral myocarditis | 41/4205 | 60/8465 | 2.59e-03 | 7.05e-03 | 3.61e-03 | 41 |
| hsa05416114 | Esophagus | ESCC | Viral myocarditis | 41/4205 | 60/8465 | 2.59e-03 | 7.05e-03 | 3.61e-03 | 41 |
| hsa0541614 | Liver | Cirrhotic | Viral myocarditis | 28/2530 | 60/8465 | 4.38e-03 | 1.68e-02 | 1.03e-02 | 28 |
| hsa0541615 | Liver | Cirrhotic | Viral myocarditis | 28/2530 | 60/8465 | 4.38e-03 | 1.68e-02 | 1.03e-02 | 28 |
| hsa0541621 | Liver | Cyst | Viral myocarditis | 9/339 | 60/8465 | 5.79e-04 | 6.94e-03 | 5.73e-03 | 9 |
| hsa0541631 | Liver | Cyst | Viral myocarditis | 9/339 | 60/8465 | 5.79e-04 | 6.94e-03 | 5.73e-03 | 9 |
| hsa0541616 | Lung | IAC | Viral myocarditis | 21/1053 | 60/8465 | 5.30e-06 | 1.57e-04 | 1.04e-04 | 21 |
| hsa0541617 | Lung | IAC | Viral myocarditis | 21/1053 | 60/8465 | 5.30e-06 | 1.57e-04 | 1.04e-04 | 21 |
| hsa0541622 | Lung | AIS | Viral myocarditis | 19/961 | 60/8465 | 2.01e-05 | 4.08e-04 | 2.61e-04 | 19 |
| hsa0541632 | Lung | AIS | Viral myocarditis | 19/961 | 60/8465 | 2.01e-05 | 4.08e-04 | 2.61e-04 | 19 |
| hsa0541661 | Lung | MIAC | Viral myocarditis | 15/507 | 60/8465 | 1.61e-06 | 9.39e-05 | 6.79e-05 | 15 |
| hsa0541671 | Lung | MIAC | Viral myocarditis | 15/507 | 60/8465 | 1.61e-06 | 9.39e-05 | 6.79e-05 | 15 |
| Page: 1 2 |
Top |
Cell-cell communication analysis |
| Identification of potential cell-cell interactions between two cell types and their ligand-receptor pairs for different disease states |
| Ligand | Receptor | LRpair | Pathway | Tissue | Disease Stage |
| Page: 1 |
Top |
Single-cell gene regulatory network inference analysis |
| Find out the significant the regulons (TFs) and the target genes of each regulon across cell types for different disease states |
| TF | Cell Type | Tissue | Disease Stage | Target Gene | RSS | Regulon Activity |
| ∗The dot plots of a searched regulon are shown for all cell subpopulations in each disease state of each tissue based on the regulon specific score inferred using pySCENIC and by calculating the average expression. |
| Page: 1 |
Top |
Somatic mutation of malignant transformation related genes |
| Annotation of somatic variants for genes involved in malignant transformation |
| Hugo Symbol | Variant Class | Variant Classification | dbSNP RS | HGVSc | HGVSp | HGVSp Short | SWISSPROT | BIOTYPE | SIFT | PolyPhen | Tumor Sample Barcode | Tissue | Histology | Sex | Age | Stage | Therapy Types | Drugs | Outcome |
| CXADR | SNV | Missense_Mutation | rs760582039 | c.734G>A | p.Gly245Glu | p.G245E | P78310 | protein_coding | deleterious(0.01) | probably_damaging(0.974) | TCGA-OL-A5RZ-01 | Breast | breast invasive carcinoma | Female | <65 | I/II | Chemotherapy | doxorubicin | CR |
| CXADR | SNV | Missense_Mutation | novel | c.400N>T | p.His134Tyr | p.H134Y | P78310 | protein_coding | tolerated(0.18) | benign(0.018) | TCGA-VS-A94Z-01 | Cervix | cervical & endocervical cancer | Female | <65 | I/II | Chemotherapy | cisplatin | CR |
| CXADR | SNV | Missense_Mutation | c.923C>T | p.Ser308Phe | p.S308F | P78310 | protein_coding | deleterious(0.04) | benign(0.171) | TCGA-A6-6781-01 | Colorectum | colon adenocarcinoma | Male | <65 | III/IV | Chemotherapy | oxaliplatin | SD | |
| CXADR | SNV | Missense_Mutation | rs778453029 | c.791G>A | p.Arg264His | p.R264H | P78310 | protein_coding | tolerated(0.18) | benign(0.043) | TCGA-D5-6540-01 | Colorectum | colon adenocarcinoma | Male | >=65 | I/II | Unknown | Unknown | SD |
| CXADR | SNV | Missense_Mutation | rs374465561 | c.131N>T | p.Thr44Met | p.T44M | P78310 | protein_coding | deleterious(0.02) | possibly_damaging(0.519) | TCGA-G4-6302-01 | Colorectum | colon adenocarcinoma | Female | >=65 | I/II | Unknown | Unknown | SD |
| CXADR | SNV | Missense_Mutation | c.289N>T | p.Asp97Tyr | p.D97Y | P78310 | protein_coding | deleterious(0.01) | probably_damaging(0.995) | TCGA-AG-A002-01 | Colorectum | rectum adenocarcinoma | Male | <65 | I/II | Unknown | Unknown | SD | |
| CXADR | SNV | Missense_Mutation | c.1091N>C | p.Ile364Thr | p.I364T | P78310 | protein_coding | deleterious(0) | possibly_damaging(0.82) | TCGA-F5-6464-01 | Colorectum | rectum adenocarcinoma | Female | >=65 | III/IV | Unknown | Unknown | SD | |
| CXADR | SNV | Missense_Mutation | rs772476067 | c.388A>G | p.Asn130Asp | p.N130D | P78310 | protein_coding | deleterious(0.01) | benign(0.203) | TCGA-F5-6814-01 | Colorectum | rectum adenocarcinoma | Male | <65 | I/II | Unknown | Unknown | SD |
| CXADR | deletion | Frame_Shift_Del | c.597delN | p.Asn201MetfsTer27 | p.N201Mfs*27 | P78310 | protein_coding | TCGA-AD-6895-01 | Colorectum | colon adenocarcinoma | Male | >=65 | III/IV | Unknown | Unknown | SD | |||
| CXADR | SNV | Missense_Mutation | rs368675196 | c.323N>T | p.Thr108Met | p.T108M | P78310 | protein_coding | tolerated(0.1) | benign(0.44) | TCGA-A5-A0G2-01 | Endometrium | uterine corpus endometrioid carcinoma | Female | <65 | III/IV | Unknown | Unknown | SD |
| Page: 1 2 3 4 5 |
Top |
Related drugs of malignant transformation related genes |
| Identification of chemicals and drugs interact with genes involved in malignant transfromation |
| (DGIdb 4.0) |
| Entrez ID | Symbol | Category | Interaction Types | Drug Claim Name | Drug Name | PMIDs |
| Page: 1 |

Copyright 2023-Present -The University of Texas Health Science Center at Houston |