Schematic overview of the cellular and molecular mechanisms involved in the cancer progression, including the proposed cellular and molecular mechanisms in cancer cells trajectory. AT1: alveolar type 1 cells; AT2: alveolar type 2 cells; AAH: atypical adenomatous hyperplasia; AIS: adenocarcinoma in situ; MIA: minimally invasive adenocarcinoma; IA: invasive adenocarcinoma; EMT: epithelial-mesenchymal transition

Home

Download

Statistics

Help

Contact

Center for Computational Systems Medicine
leaf

Gene summary

leaf

Malignant transformation analysis

leaf

Malignant transformation related pathway analysis

leaf

Cell-cell communication analysis

leaf

Single-cell gene regulatory network inference analysis

leaf

Somatic mutation of malignant transformation related genes

leaf

Related drugs of malignant transformation related genes

Gene: CWF19L2

Gene summary for CWF19L2

check button Gene summary.

Gene informationSpeciesHuman
Gene symbol

CWF19L2

Gene ID

143884

Gene nameCWF19 like cell cycle control factor 2
Gene AliasCWF19L2
Cytomap11q22.3
Gene Typeprotein-coding
GO ID

GO:0000375

UniProtAcc

Q2TBE0


Top

Malignant transformation analysis

check button Identification of the aberrant gene expression in precancerous and cancerous lesions by comparing the gene expression of stem-like cells in diseased tissues with normal stem cells
check button Malignant transformation involving gene list.
Entrez IDSymbolReplicatesSpeciesOrganTissueAdj P-valueLog2FCMalignancy
143884CWF19L2LZE4THumanEsophagusESCC5.12e-051.63e-010.0811
143884CWF19L2LZE20THumanEsophagusESCC8.74e-031.10e-010.0662
143884CWF19L2LZE24THumanEsophagusESCC1.21e-082.32e-010.0596
143884CWF19L2P4T-EHumanEsophagusESCC6.17e-162.65e-010.1323
143884CWF19L2P5T-EHumanEsophagusESCC9.97e-182.81e-010.1327
143884CWF19L2P8T-EHumanEsophagusESCC1.37e-035.48e-020.0889
143884CWF19L2P9T-EHumanEsophagusESCC9.52e-109.07e-020.1131
143884CWF19L2P10T-EHumanEsophagusESCC5.76e-151.88e-010.116
143884CWF19L2P11T-EHumanEsophagusESCC3.57e-062.37e-010.1426
143884CWF19L2P12T-EHumanEsophagusESCC1.02e-182.69e-010.1122
143884CWF19L2P15T-EHumanEsophagusESCC2.02e-083.64e-020.1149
143884CWF19L2P16T-EHumanEsophagusESCC1.69e-071.38e-010.1153
143884CWF19L2P20T-EHumanEsophagusESCC4.38e-088.57e-020.1124
143884CWF19L2P21T-EHumanEsophagusESCC3.84e-132.12e-010.1617
143884CWF19L2P22T-EHumanEsophagusESCC7.83e-082.97e-020.1236
143884CWF19L2P23T-EHumanEsophagusESCC1.60e-081.44e-010.108
143884CWF19L2P24T-EHumanEsophagusESCC4.22e-051.11e-020.1287
143884CWF19L2P26T-EHumanEsophagusESCC1.47e-161.85e-010.1276
143884CWF19L2P27T-EHumanEsophagusESCC6.94e-111.10e-010.1055
143884CWF19L2P30T-EHumanEsophagusESCC2.79e-061.70e-010.137
Page: 1 2 3 4 5 

check button Transcriptomic changes along malignancy continuum.
TissueExpression DynamicsAbbreviation
EsophagusThe image shows the transcriptomic changes along malignancy continuum.log2FC in expression of this searched gene in stem-like cells from each diseased tissue sample relative to stem-like cells in normal samples in each tissue plotted against the malignancy continuum. Samples are colored based on if they are from different disease stage.
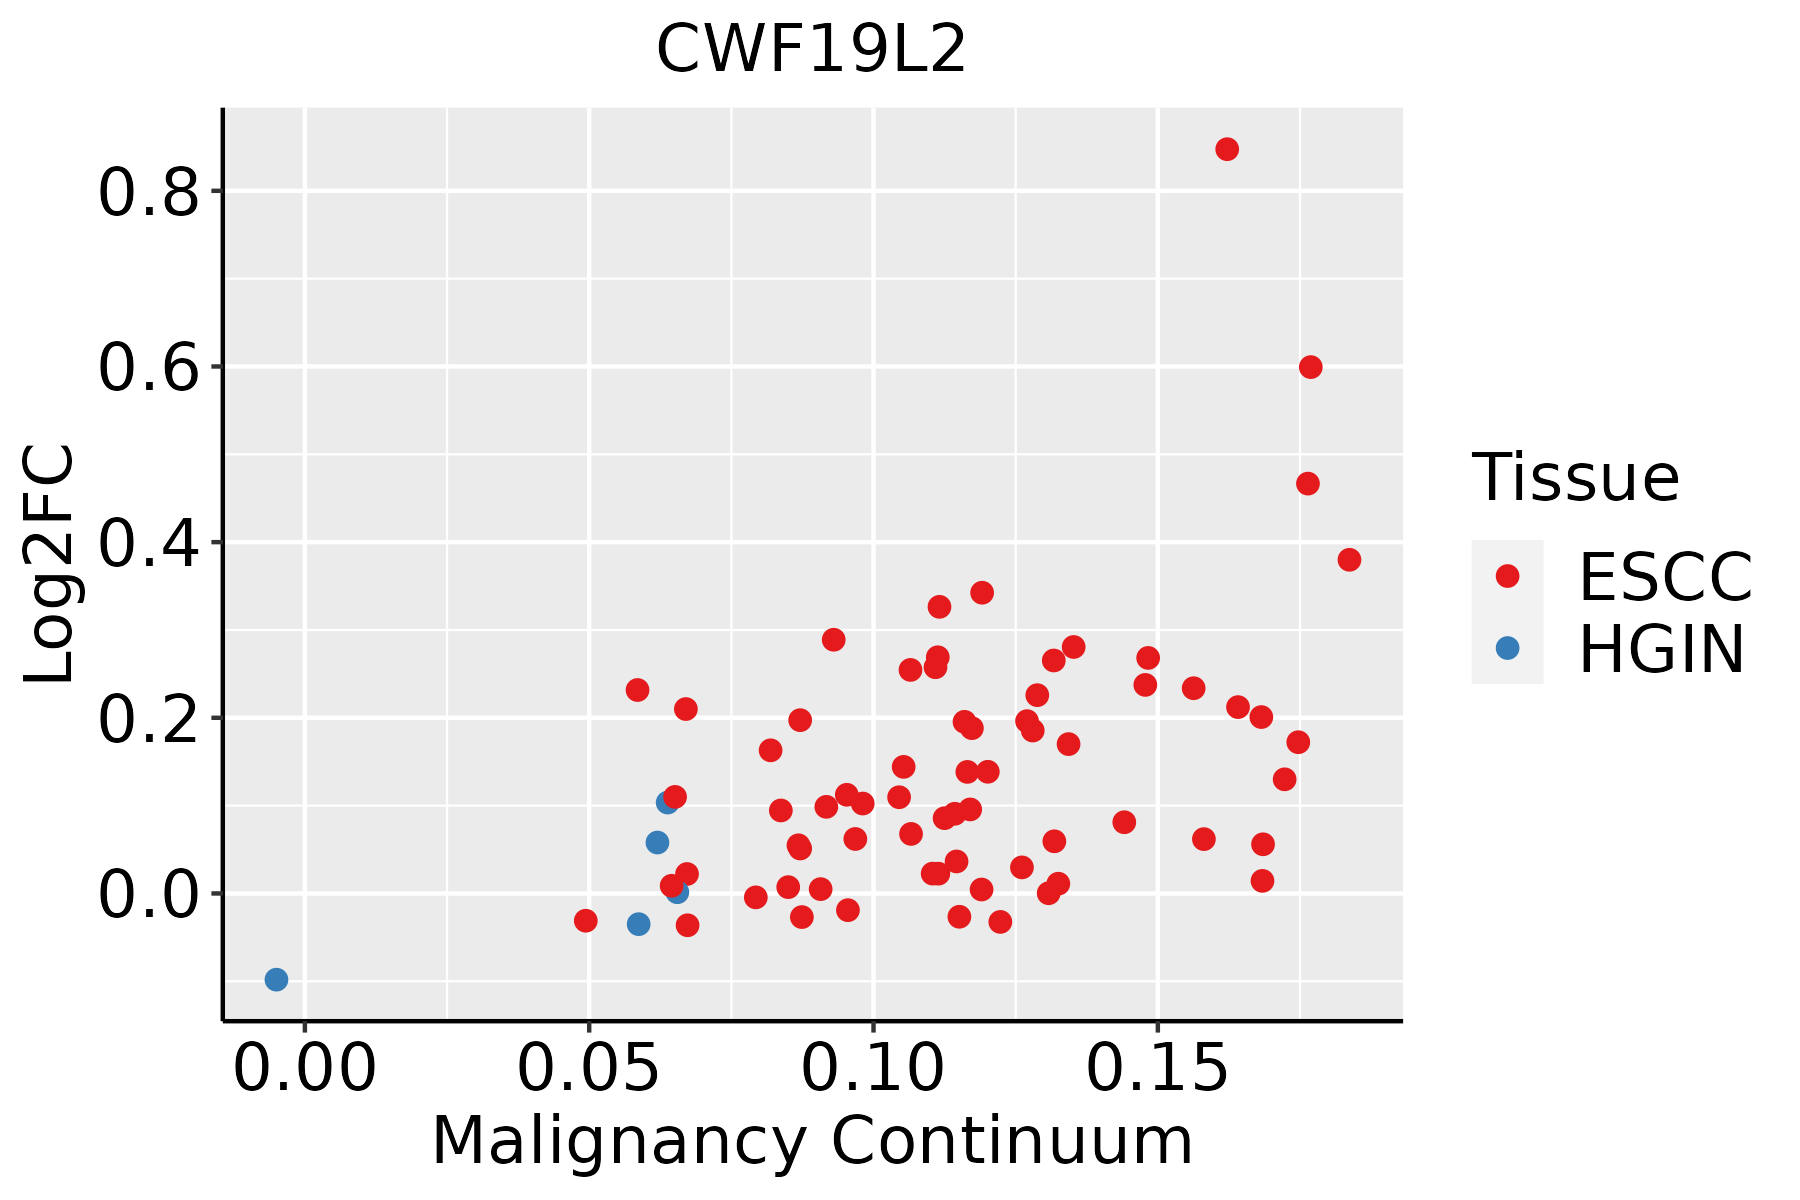
ESCC: Esophageal squamous cell carcinoma
HGIN: High-grade intraepithelial neoplasias
LGIN: Low-grade intraepithelial neoplasias
LiverThe image shows the transcriptomic changes along malignancy continuum.log2FC in expression of this searched gene in stem-like cells from each diseased tissue sample relative to stem-like cells in normal samples in each tissue plotted against the malignancy continuum. Samples are colored based on if they are from different disease stage.
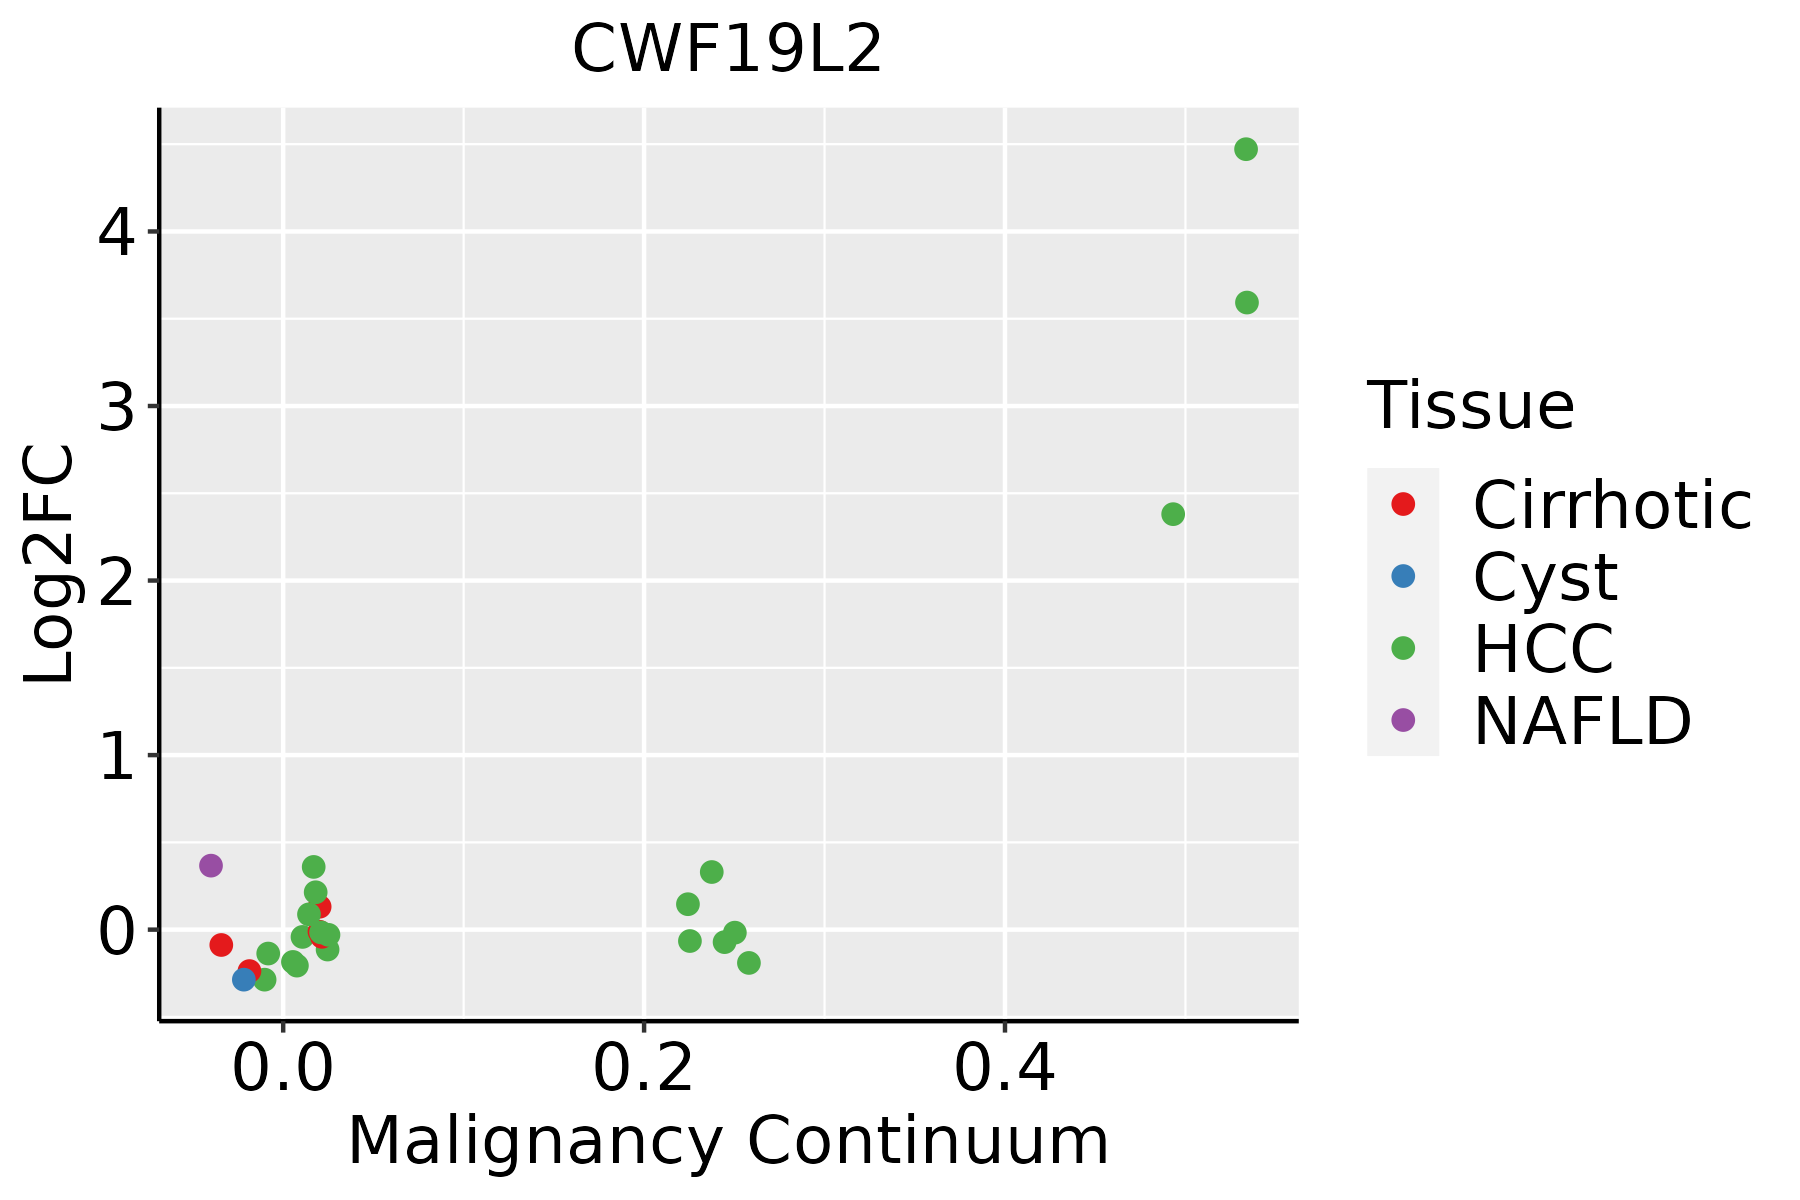
HCC: Hepatocellular carcinoma
NAFLD: Non-alcoholic fatty liver disease
Oral CavityThe image shows the transcriptomic changes along malignancy continuum.log2FC in expression of this searched gene in stem-like cells from each diseased tissue sample relative to stem-like cells in normal samples in each tissue plotted against the malignancy continuum. Samples are colored based on if they are from different disease stage.
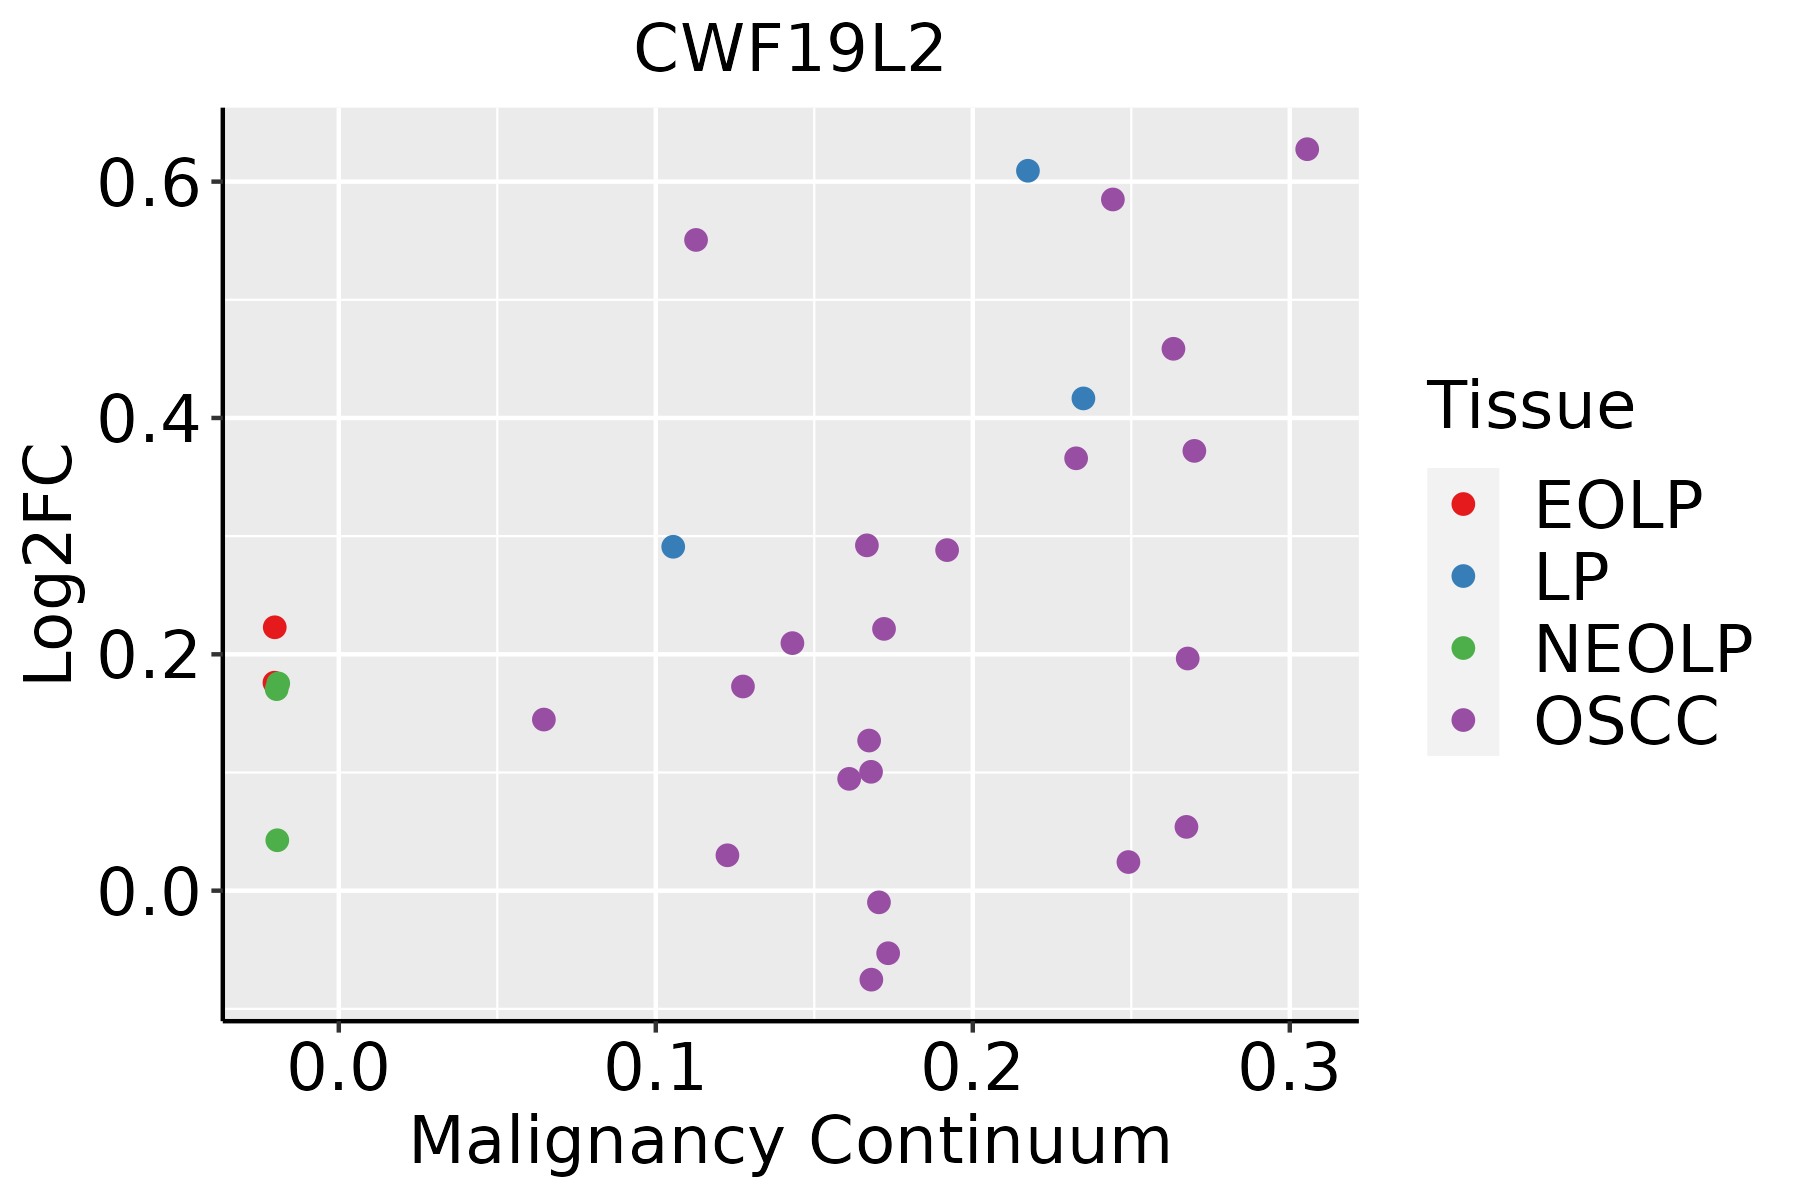
EOLP: Erosive Oral lichen planus
LP: leukoplakia
NEOLP: Non-erosive oral lichen planus
OSCC: Oral squamous cell carcinoma
ThyroidThe image shows the transcriptomic changes along malignancy continuum.log2FC in expression of this searched gene in stem-like cells from each diseased tissue sample relative to stem-like cells in normal samples in each tissue plotted against the malignancy continuum. Samples are colored based on if they are from different disease stage.
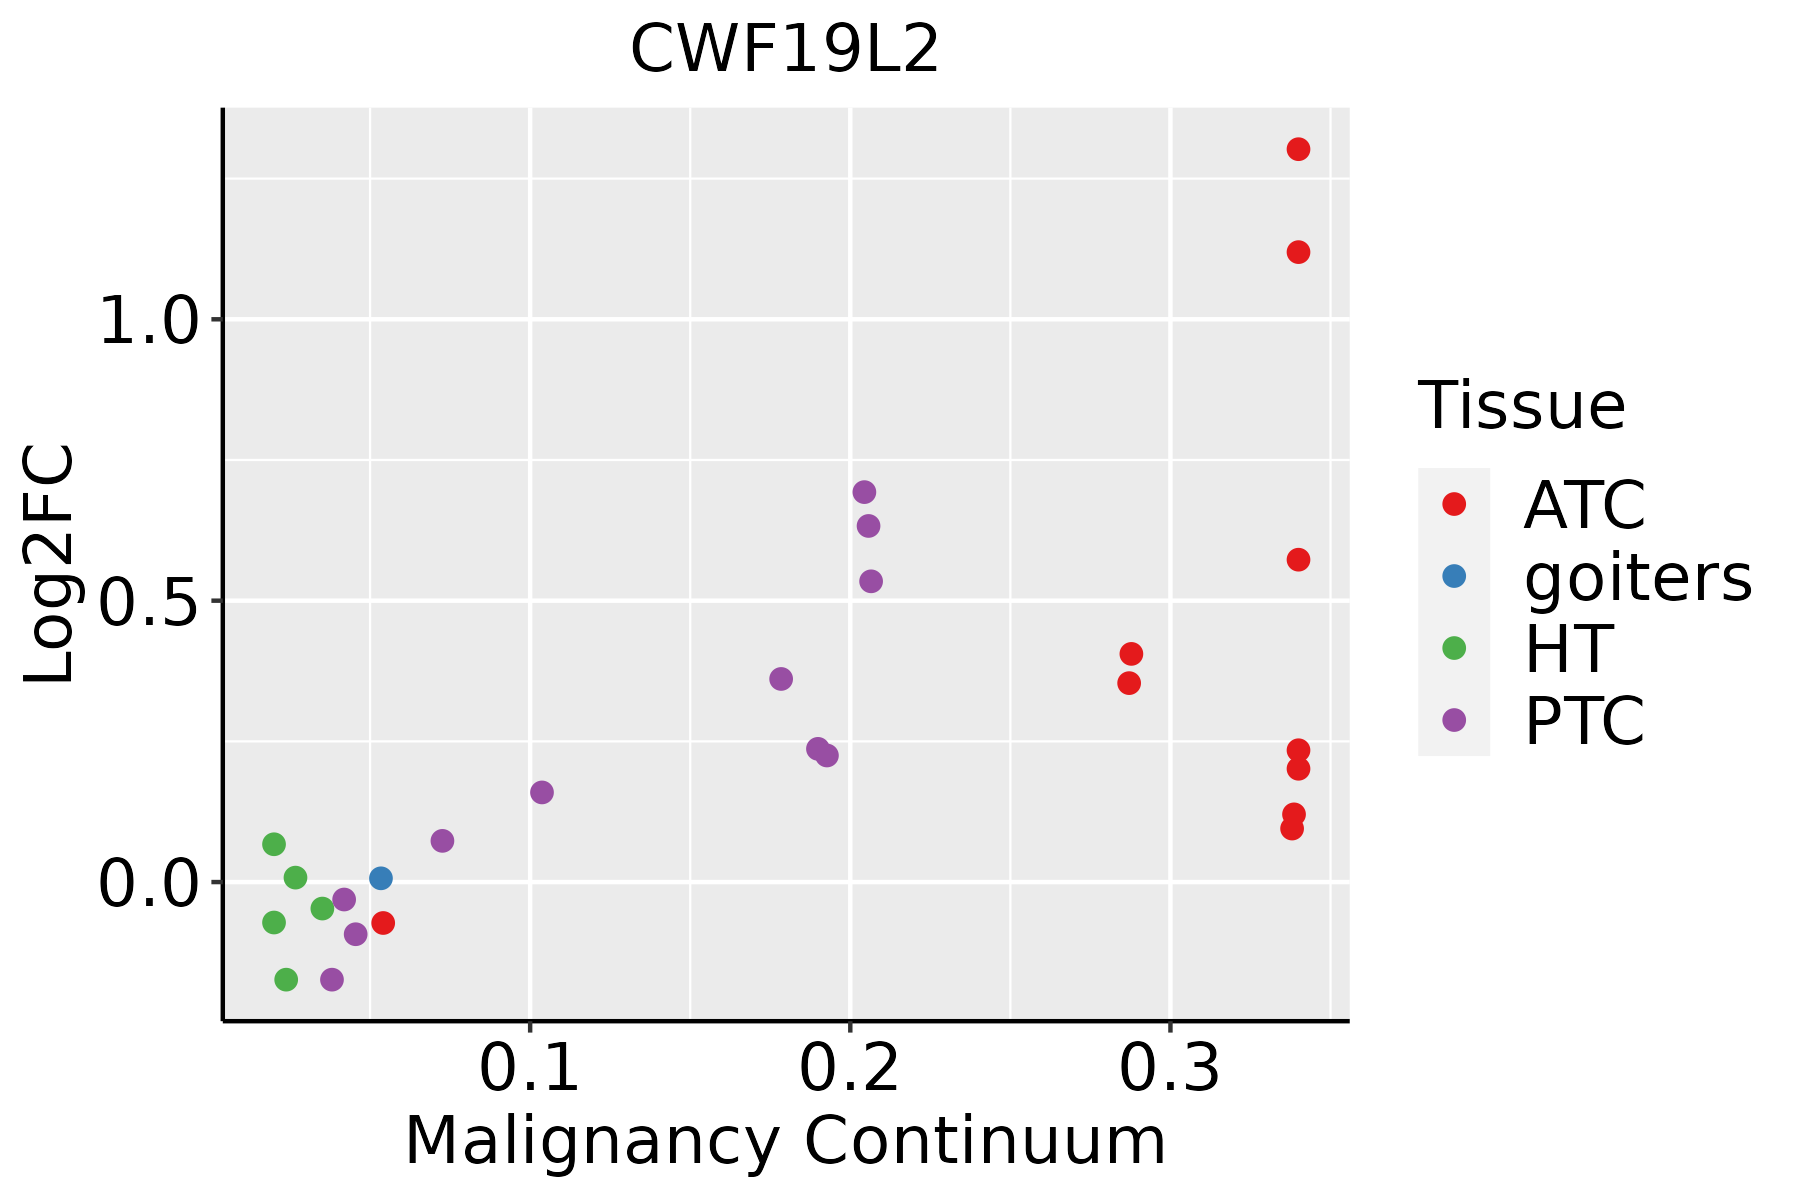
ATC: Anaplastic thyroid cancer
HT: Hashimoto's thyroiditis
PTC: Papillary thyroid cancer
∗log2FC in expression of this searched gene in stem-like cells from each diseased tissue sample relative to stem-like cells in normal samples in each tissue plotted against the malignancy continuum. Samples are colored based on if they are from different disease stage.

Top

Malignant transformation related pathway analysis

check buttonFind out the enriched GO biological processes and KEGG pathways involved in transition from healthy to precancer to cancer
check button Figure of enriched GO biological processes.
TissueDisease StageEnriched GO biological Processes
ColorectumADGO analysis - Figure of enriched GO biological processes: Top 15 enriched GO BP terms are showed in the bar plot of each disease state in each tissue. Each row represents a significant GO biological process which is colored according to the -log10(p.adjust).
ColorectumSERGO analysis - Figure of enriched GO biological processes: Top 15 enriched GO BP terms are showed in the bar plot of each disease state in each tissue. Each row represents a significant GO biological process which is colored according to the -log10(p.adjust).
ColorectumMSSGO analysis - Figure of enriched GO biological processes: Top 15 enriched GO BP terms are showed in the bar plot of each disease state in each tissue. Each row represents a significant GO biological process which is colored according to the -log10(p.adjust).
ColorectumMSI-HGO analysis - Figure of enriched GO biological processes: Top 15 enriched GO BP terms are showed in the bar plot of each disease state in each tissue. Each row represents a significant GO biological process which is colored according to the -log10(p.adjust).
ColorectumFAPGO analysis - Figure of enriched GO biological processes: Top 15 enriched GO BP terms are showed in the bar plot of each disease state in each tissue. Each row represents a significant GO biological process which is colored according to the -log10(p.adjust).
∗Top 15 enriched GO BP terms are showed in the bar plot of each disease state in each tissue. Each row represents a significant GO biological process which is colored according to the -log10(p.adjust).
Page: 1 2 3 4 5 6 7 8 9 

check button Enriched GO biological processes.
GO IDTissueDisease StageDescriptionGene RatioBg Ratiopvaluep.adjustCount
GO:0008380111EsophagusESCCRNA splicing336/8552434/187231.74e-423.67e-39336
GO:0000375111EsophagusESCCRNA splicing, via transesterification reactions248/8552324/187233.05e-301.49e-27248
GO:0000377111EsophagusESCCRNA splicing, via transesterification reactions with bulged adenosine as nucleophile244/8552320/187232.52e-291.07e-26244
GO:0000398111EsophagusESCCmRNA splicing, via spliceosome244/8552320/187232.52e-291.07e-26244
GO:00083807LiverNAFLDRNA splicing70/1882434/187234.62e-051.10e-0370
GO:00003777LiverNAFLDRNA splicing, via transesterification reactions with bulged adenosine as nucleophile51/1882320/187236.21e-048.18e-0351
GO:00003987LiverNAFLDmRNA splicing, via spliceosome51/1882320/187236.21e-048.18e-0351
GO:00003757LiverNAFLDRNA splicing, via transesterification reactions51/1882324/187238.28e-041.02e-0251
GO:000838012LiverCirrhoticRNA splicing229/4634434/187239.13e-372.86e-33229
GO:000037512LiverCirrhoticRNA splicing, via transesterification reactions175/4634324/187235.95e-307.47e-27175
GO:000037712LiverCirrhoticRNA splicing, via transesterification reactions with bulged adenosine as nucleophile172/4634320/187234.02e-293.60e-26172
GO:000039812LiverCirrhoticmRNA splicing, via spliceosome172/4634320/187234.02e-293.60e-26172
GO:000838022LiverHCCRNA splicing313/7958434/187231.36e-361.73e-33313
GO:000037522LiverHCCRNA splicing, via transesterification reactions228/7958324/187231.47e-244.06e-22228
GO:000037722LiverHCCRNA splicing, via transesterification reactions with bulged adenosine as nucleophile224/7958320/187231.16e-232.62e-21224
GO:000039822LiverHCCmRNA splicing, via spliceosome224/7958320/187231.16e-232.62e-21224
GO:000838020Oral cavityOSCCRNA splicing308/7305434/187232.43e-427.70e-39308
GO:000037519Oral cavityOSCCRNA splicing, via transesterification reactions225/7305324/187235.20e-292.99e-26225
GO:000037719Oral cavityOSCCRNA splicing, via transesterification reactions with bulged adenosine as nucleophile221/7305320/187235.50e-282.18e-25221
GO:000039819Oral cavityOSCCmRNA splicing, via spliceosome221/7305320/187235.50e-282.18e-25221
Page: 1 2 

check button Enriched KEGG pathways.
Pathway IDTissueDisease StageDescriptionGene RatioBg Ratiopvaluep.adjustqvalueCount
Page: 1 

Top

Cell-cell communication analysis

check buttonIdentification of potential cell-cell interactions between two cell types and their ligand-receptor pairs for different disease states
LigandReceptorLRpairPathwayTissueDisease Stage
Page: 1 

Top

Single-cell gene regulatory network inference analysis

check buttonFind out the significant the regulons (TFs) and the target genes of each regulon across cell types for different disease states
TFCell TypeTissueDisease StageTarget GeneRSSRegulon Activity
∗The dot plots of a searched regulon are shown for all cell subpopulations in each disease state of each tissue based on the regulon specific score inferred using pySCENIC and by calculating the average expression.
Page: 1 

Top

Somatic mutation of malignant transformation related genes

check buttonAnnotation of somatic variants for genes involved in malignant transformation
Hugo SymbolVariant ClassVariant ClassificationdbSNP RSHGVScHGVSpHGVSp ShortSWISSPROTBIOTYPESIFTPolyPhenTumor Sample BarcodeTissueHistologySexAgeStageTherapy TypesDrugsOutcome
CWF19L2SNVMissense_Mutationnovelc.1297N>Gp.Gln433Glup.Q433EQ2TBE0protein_codingtolerated(0.25)benign(0.003)TCGA-A2-A3XZ-01Breastbreast invasive carcinomaFemale<65I/IIChemotherapycarboplatinCR
CWF19L2SNVMissense_Mutationnovelc.1138N>Gp.His380Aspp.H380DQ2TBE0protein_codingtolerated(0.16)benign(0.009)TCGA-A2-A3XZ-01Breastbreast invasive carcinomaFemale<65I/IIChemotherapycarboplatinCR
CWF19L2SNVMissense_Mutationnovelc.1052N>Gp.Ser351Cysp.S351CQ2TBE0protein_codingtolerated(0.1)possibly_damaging(0.511)TCGA-A2-A3XZ-01Breastbreast invasive carcinomaFemale<65I/IIChemotherapycarboplatinCR
CWF19L2SNVMissense_Mutationnovelc.17C>Ap.Ala6Glup.A6EQ2TBE0protein_codingdeleterious(0.03)benign(0.069)TCGA-AN-A0FS-01Breastbreast invasive carcinomaFemale<65I/IIUnknownUnknownSD
CWF19L2SNVMissense_Mutationc.1474N>Ap.Glu492Lysp.E492KQ2TBE0protein_codingdeleterious(0)probably_damaging(0.947)TCGA-C8-A26Y-01Breastbreast invasive carcinomaFemale>=65I/IIUnknownUnknownSD
CWF19L2SNVMissense_Mutationc.1033N>Cp.Glu345Glnp.E345QQ2TBE0protein_codingtolerated(0.15)benign(0.011)TCGA-C8-A26Y-01Breastbreast invasive carcinomaFemale>=65I/IIUnknownUnknownSD
CWF19L2SNVMissense_Mutationc.2159G>Cp.Arg720Thrp.R720TQ2TBE0protein_codingtolerated(0.9)benign(0.003)TCGA-D8-A1J8-01Breastbreast invasive carcinomaFemale>=65I/IIHormone TherapynolvadexSD
CWF19L2SNVMissense_Mutationnovelc.1725G>Tp.Lys575Asnp.K575NQ2TBE0protein_codingdeleterious(0)benign(0.196)TCGA-OL-A6VR-01Breastbreast invasive carcinomaFemale<65I/IIUnknownUnknownSD
CWF19L2insertionFrame_Shift_Insnovelc.14_15insCCCTGTGCTGGAGGAATGGGATAAAGp.Met5IlefsTer68p.M5Ifs*68Q2TBE0protein_codingTCGA-AN-A0FS-01Breastbreast invasive carcinomaFemale<65I/IIUnknownUnknownSD
CWF19L2insertionNonsense_Mutationnovelc.953_954insAp.Tyr318Terp.Y318*Q2TBE0protein_codingTCGA-AO-A12A-01Breastbreast invasive carcinomaFemale<65I/IIChemotherapycyclophosphamideSD
Page: 1 2 3 4 5 6 7 8 9 10 11 12 13 14 

Top

Related drugs of malignant transformation related genes

check buttonIdentification of chemicals and drugs interact with genes involved in malignant transfromation
(DGIdb 4.0)
Entrez IDSymbolCategoryInteraction TypesDrug Claim NameDrug NamePMIDs
Page: 1