
|
|||||
|
 | |
| |
| |
| |
| |
| |
|
Gene: CWC27 |
Gene summary for CWC27 |
| Gene information | Species | Human | Gene symbol | CWC27 | Gene ID | 10283 |
| Gene name | CWC27 spliceosome associated cyclophilin | |
| Gene Alias | NY-CO-10 | |
| Cytomap | 5q12.3 | |
| Gene Type | protein-coding | GO ID | GO:0000375 | UniProtAcc | Q6UX04 |
Top |
Malignant transformation analysis |
| Identification of the aberrant gene expression in precancerous and cancerous lesions by comparing the gene expression of stem-like cells in diseased tissues with normal stem cells |
| Entrez ID | Symbol | Replicates | Species | Organ | Tissue | Adj P-value | Log2FC | Malignancy |
| 10283 | CWC27 | HTA11_3410_2000001011 | Human | Colorectum | AD | 4.53e-08 | -4.63e-01 | 0.0155 |
| 10283 | CWC27 | HTA11_696_2000001011 | Human | Colorectum | AD | 1.09e-02 | -2.73e-01 | -0.1464 |
| 10283 | CWC27 | HTA11_866_2000001011 | Human | Colorectum | AD | 2.46e-02 | -2.47e-01 | -0.1001 |
| 10283 | CWC27 | HTA11_7696_3000711011 | Human | Colorectum | AD | 3.45e-02 | -2.88e-01 | 0.0674 |
| 10283 | CWC27 | HTA11_99999974143_84620 | Human | Colorectum | MSS | 1.60e-11 | -4.24e-01 | 0.3005 |
| 10283 | CWC27 | A001-C-207 | Human | Colorectum | FAP | 3.26e-03 | -2.61e-01 | 0.1278 |
| 10283 | CWC27 | A015-C-203 | Human | Colorectum | FAP | 2.33e-24 | -4.57e-01 | -0.1294 |
| 10283 | CWC27 | A015-C-204 | Human | Colorectum | FAP | 3.64e-07 | -4.45e-01 | -0.0228 |
| 10283 | CWC27 | A002-C-201 | Human | Colorectum | FAP | 1.55e-08 | -3.19e-01 | 0.0324 |
| 10283 | CWC27 | A002-C-203 | Human | Colorectum | FAP | 4.80e-05 | -2.28e-01 | 0.2786 |
| 10283 | CWC27 | A001-C-119 | Human | Colorectum | FAP | 1.25e-10 | -5.21e-01 | -0.1557 |
| 10283 | CWC27 | A001-C-108 | Human | Colorectum | FAP | 1.63e-14 | -3.11e-01 | -0.0272 |
| 10283 | CWC27 | A002-C-205 | Human | Colorectum | FAP | 1.33e-17 | -5.02e-01 | -0.1236 |
| 10283 | CWC27 | A001-C-104 | Human | Colorectum | FAP | 5.99e-07 | -2.97e-01 | 0.0184 |
| 10283 | CWC27 | A015-C-006 | Human | Colorectum | FAP | 6.21e-10 | -4.27e-01 | -0.0994 |
| 10283 | CWC27 | A015-C-106 | Human | Colorectum | FAP | 3.80e-11 | -3.18e-01 | -0.0511 |
| 10283 | CWC27 | A002-C-114 | Human | Colorectum | FAP | 9.69e-12 | -3.64e-01 | -0.1561 |
| 10283 | CWC27 | A015-C-104 | Human | Colorectum | FAP | 4.14e-27 | -4.95e-01 | -0.1899 |
| 10283 | CWC27 | A001-C-014 | Human | Colorectum | FAP | 3.49e-14 | -3.32e-01 | 0.0135 |
| 10283 | CWC27 | A002-C-016 | Human | Colorectum | FAP | 3.07e-16 | -3.61e-01 | 0.0521 |
| Page: 1 2 3 4 5 6 7 |
| Tissue | Expression Dynamics | Abbreviation |
| Colorectum (GSE201348) |  | FAP: Familial adenomatous polyposis |
| CRC: Colorectal cancer | ||
| Colorectum (HTA11) |  | AD: Adenomas |
| SER: Sessile serrated lesions | ||
| MSI-H: Microsatellite-high colorectal cancer | ||
| MSS: Microsatellite stable colorectal cancer | ||
| Esophagus |  | ESCC: Esophageal squamous cell carcinoma |
| HGIN: High-grade intraepithelial neoplasias | ||
| LGIN: Low-grade intraepithelial neoplasias | ||
| Liver |  | HCC: Hepatocellular carcinoma |
| NAFLD: Non-alcoholic fatty liver disease | ||
| Oral Cavity | 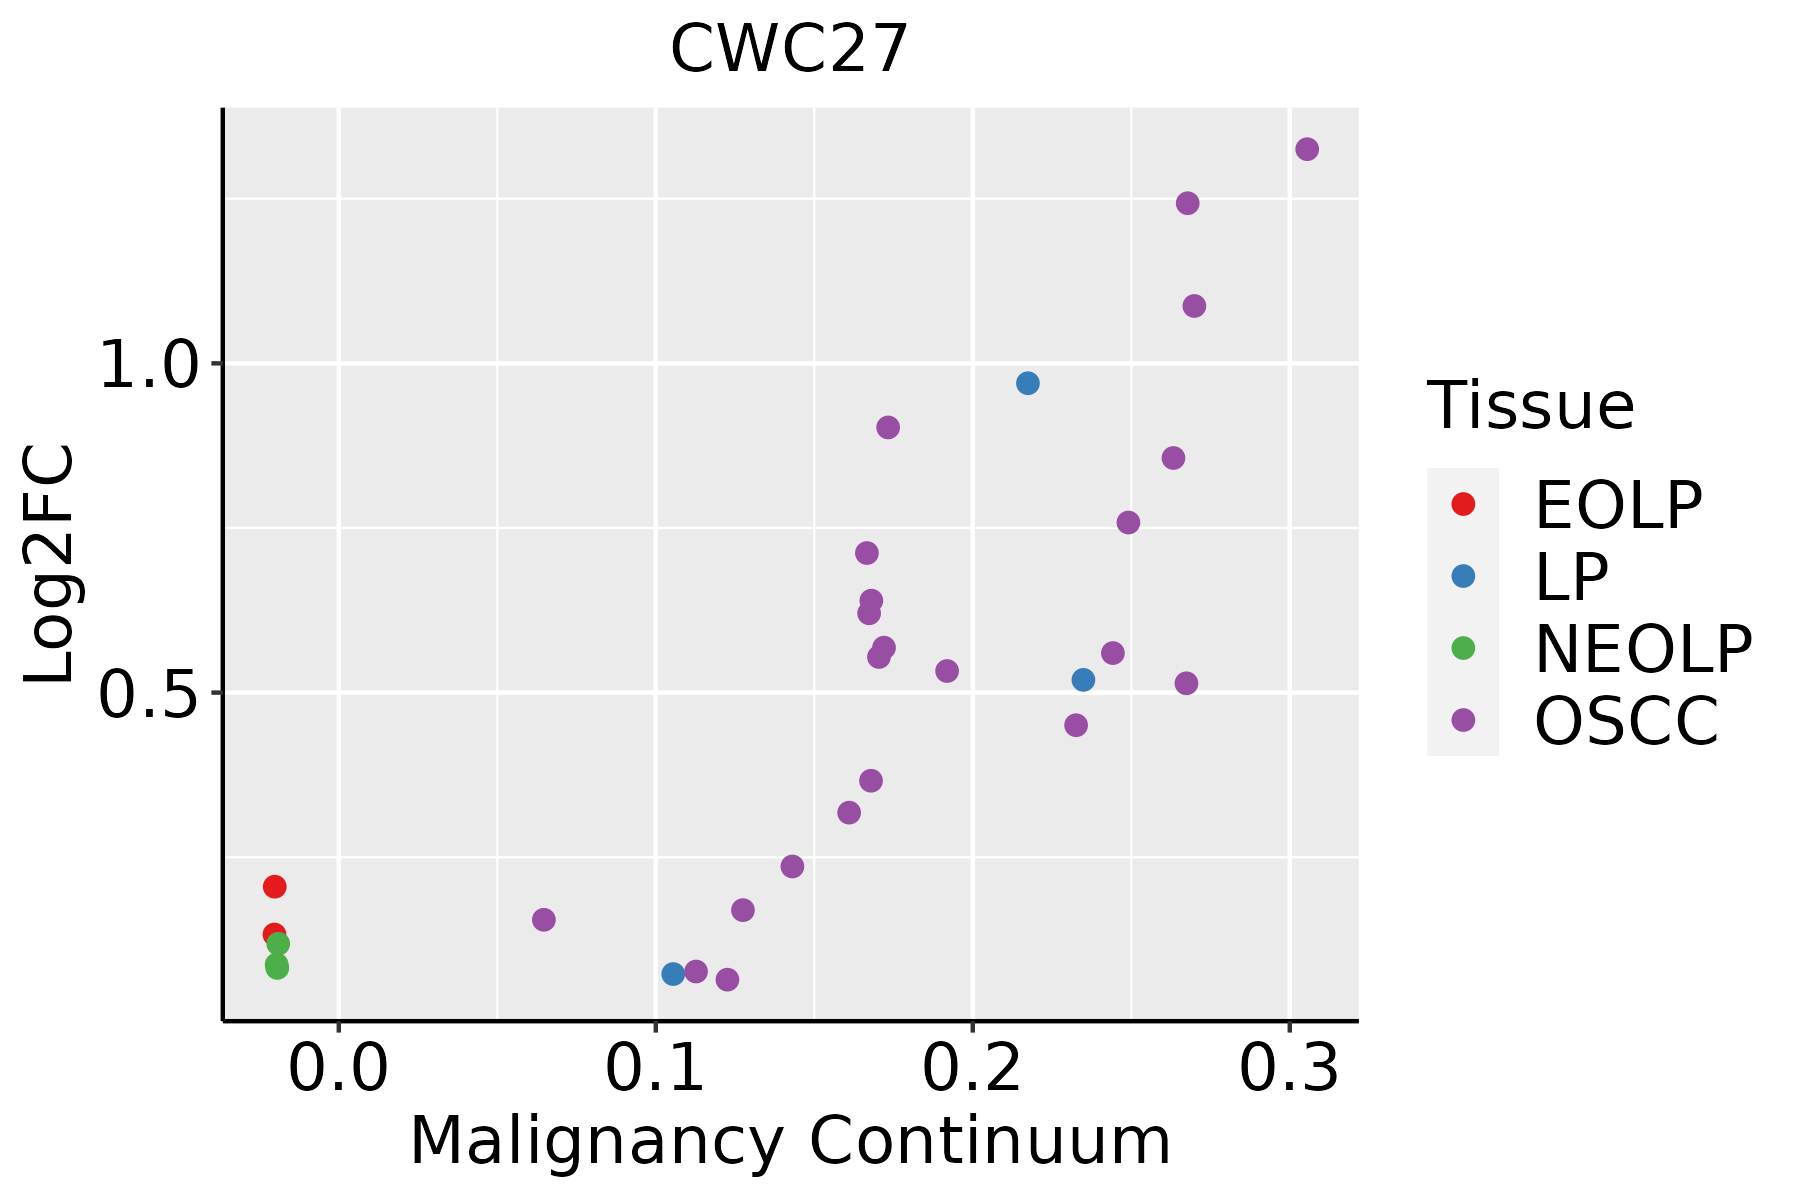 | EOLP: Erosive Oral lichen planus |
| LP: leukoplakia | ||
| NEOLP: Non-erosive oral lichen planus | ||
| OSCC: Oral squamous cell carcinoma | ||
| Skin | 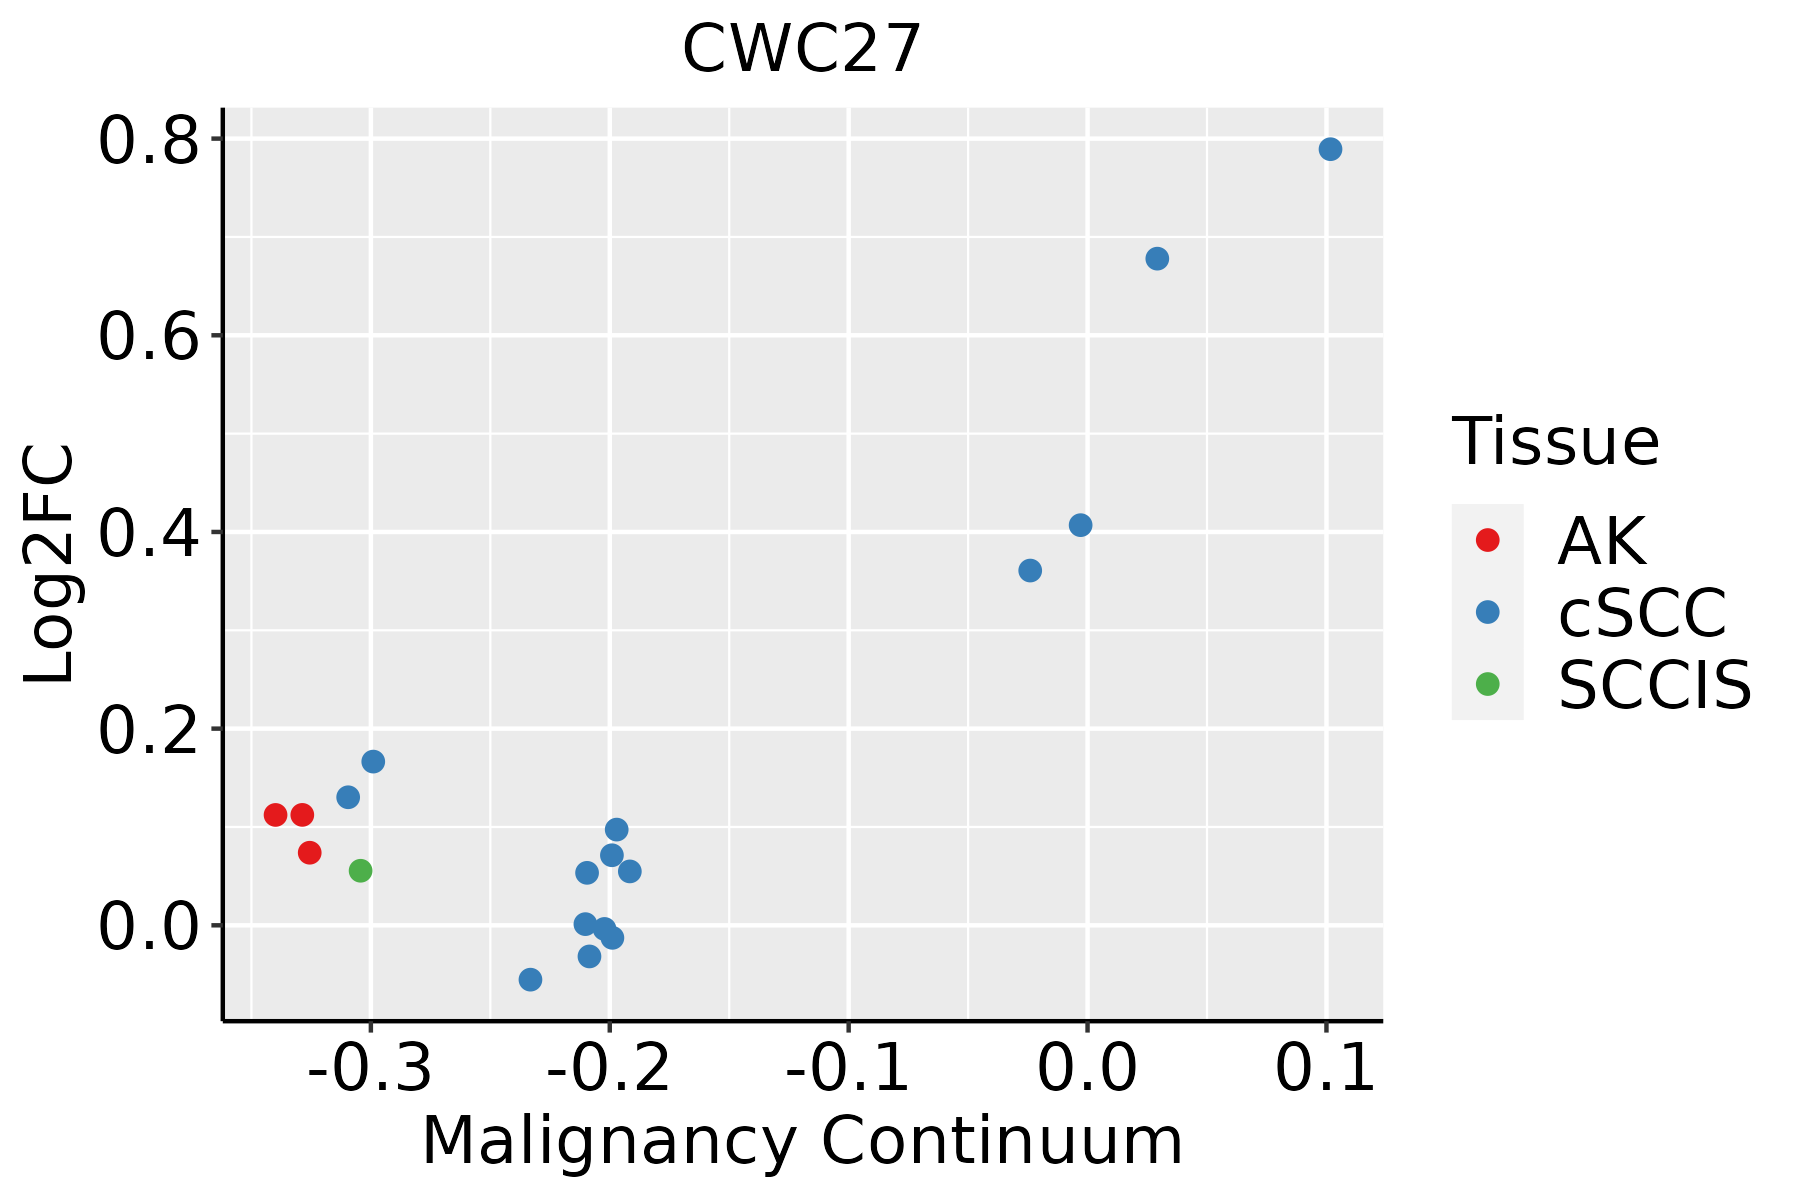 | AK: Actinic keratosis |
| cSCC: Cutaneous squamous cell carcinoma | ||
| SCCIS:squamous cell carcinoma in situ | ||
| Thyroid |  | ATC: Anaplastic thyroid cancer |
| HT: Hashimoto's thyroiditis | ||
| PTC: Papillary thyroid cancer |
| ∗log2FC in expression of this searched gene in stem-like cells from each diseased tissue sample relative to stem-like cells in normal samples in each tissue plotted against the malignancy continuum. Samples are colored based on if they are from different disease stage. |
Top |
Malignant transformation related pathway analysis |
| Find out the enriched GO biological processes and KEGG pathways involved in transition from healthy to precancer to cancer |
| Tissue | Disease Stage | Enriched GO biological Processes |
| Colorectum | AD |  |
| Colorectum | SER |  |
| Colorectum | MSS |  |
| Colorectum | MSI-H |  |
| Colorectum | FAP |  |
| ∗Top 15 enriched GO BP terms are showed in the bar plot of each disease state in each tissue. Each row represents a significant GO biological process which is colored according to the -log10(p.adjust). |
| Page: 1 2 3 4 5 6 7 8 9 |
| GO ID | Tissue | Disease Stage | Description | Gene Ratio | Bg Ratio | pvalue | p.adjust | Count |
| GO:0008380 | Colorectum | AD | RNA splicing | 169/3918 | 434/18723 | 3.59e-18 | 2.04e-15 | 169 |
| GO:0000377 | Colorectum | AD | RNA splicing, via transesterification reactions with bulged adenosine as nucleophile | 130/3918 | 320/18723 | 5.88e-16 | 2.16e-13 | 130 |
| GO:0000398 | Colorectum | AD | mRNA splicing, via spliceosome | 130/3918 | 320/18723 | 5.88e-16 | 2.16e-13 | 130 |
| GO:0000375 | Colorectum | AD | RNA splicing, via transesterification reactions | 131/3918 | 324/18723 | 7.11e-16 | 2.22e-13 | 131 |
| GO:0006457 | Colorectum | AD | protein folding | 73/3918 | 212/18723 | 3.24e-06 | 9.10e-05 | 73 |
| GO:00083802 | Colorectum | MSS | RNA splicing | 159/3467 | 434/18723 | 1.75e-19 | 1.22e-16 | 159 |
| GO:00003772 | Colorectum | MSS | RNA splicing, via transesterification reactions with bulged adenosine as nucleophile | 121/3467 | 320/18723 | 2.52e-16 | 8.27e-14 | 121 |
| GO:00003982 | Colorectum | MSS | mRNA splicing, via spliceosome | 121/3467 | 320/18723 | 2.52e-16 | 8.27e-14 | 121 |
| GO:00003752 | Colorectum | MSS | RNA splicing, via transesterification reactions | 122/3467 | 324/18723 | 2.75e-16 | 8.58e-14 | 122 |
| GO:00064572 | Colorectum | MSS | protein folding | 71/3467 | 212/18723 | 1.25e-07 | 5.91e-06 | 71 |
| GO:00083804 | Colorectum | FAP | RNA splicing | 108/2622 | 434/18723 | 7.90e-10 | 1.86e-07 | 108 |
| GO:00003754 | Colorectum | FAP | RNA splicing, via transesterification reactions | 84/2622 | 324/18723 | 8.06e-09 | 1.10e-06 | 84 |
| GO:00003774 | Colorectum | FAP | RNA splicing, via transesterification reactions with bulged adenosine as nucleophile | 83/2622 | 320/18723 | 9.66e-09 | 1.23e-06 | 83 |
| GO:00003984 | Colorectum | FAP | mRNA splicing, via spliceosome | 83/2622 | 320/18723 | 9.66e-09 | 1.23e-06 | 83 |
| GO:00064574 | Colorectum | FAP | protein folding | 44/2622 | 212/18723 | 4.36e-03 | 2.98e-02 | 44 |
| GO:00083805 | Colorectum | CRC | RNA splicing | 90/2078 | 434/18723 | 2.80e-09 | 7.97e-07 | 90 |
| GO:00003775 | Colorectum | CRC | RNA splicing, via transesterification reactions with bulged adenosine as nucleophile | 66/2078 | 320/18723 | 4.39e-07 | 3.37e-05 | 66 |
| GO:00003985 | Colorectum | CRC | mRNA splicing, via spliceosome | 66/2078 | 320/18723 | 4.39e-07 | 3.37e-05 | 66 |
| GO:00003755 | Colorectum | CRC | RNA splicing, via transesterification reactions | 66/2078 | 324/18723 | 7.00e-07 | 4.61e-05 | 66 |
| GO:0008380111 | Esophagus | ESCC | RNA splicing | 336/8552 | 434/18723 | 1.74e-42 | 3.67e-39 | 336 |
| Page: 1 2 3 4 |
| Pathway ID | Tissue | Disease Stage | Description | Gene Ratio | Bg Ratio | pvalue | p.adjust | qvalue | Count |
| Page: 1 |
Top |
Cell-cell communication analysis |
| Identification of potential cell-cell interactions between two cell types and their ligand-receptor pairs for different disease states |
| Ligand | Receptor | LRpair | Pathway | Tissue | Disease Stage |
| Page: 1 |
Top |
Single-cell gene regulatory network inference analysis |
| Find out the significant the regulons (TFs) and the target genes of each regulon across cell types for different disease states |
| TF | Cell Type | Tissue | Disease Stage | Target Gene | RSS | Regulon Activity |
| ∗The dot plots of a searched regulon are shown for all cell subpopulations in each disease state of each tissue based on the regulon specific score inferred using pySCENIC and by calculating the average expression. |
| Page: 1 |
Top |
Somatic mutation of malignant transformation related genes |
| Annotation of somatic variants for genes involved in malignant transformation |
| Hugo Symbol | Variant Class | Variant Classification | dbSNP RS | HGVSc | HGVSp | HGVSp Short | SWISSPROT | BIOTYPE | SIFT | PolyPhen | Tumor Sample Barcode | Tissue | Histology | Sex | Age | Stage | Therapy Types | Drugs | Outcome |
| CWC27 | SNV | Missense_Mutation | c.1060G>A | p.Asp354Asn | p.D354N | Q6UX04 | protein_coding | tolerated(1) | benign(0.001) | TCGA-A7-A26E-01 | Breast | breast invasive carcinoma | Female | >=65 | III/IV | Chemotherapy | cytoxan | SD | |
| CWC27 | SNV | Missense_Mutation | novel | c.1378N>A | p.Glu460Lys | p.E460K | Q6UX04 | protein_coding | tolerated(0.16) | probably_damaging(0.98) | TCGA-AC-A23H-01 | Breast | breast invasive carcinoma | Female | >=65 | I/II | Unknown | Unknown | PD |
| CWC27 | SNV | Missense_Mutation | novel | c.1331N>G | p.Phe444Cys | p.F444C | Q6UX04 | protein_coding | deleterious(0) | probably_damaging(0.921) | TCGA-AN-A046-01 | Breast | breast invasive carcinoma | Female | >=65 | I/II | Unknown | Unknown | SD |
| CWC27 | SNV | Missense_Mutation | rs754149136 | c.1259N>A | p.Met420Lys | p.M420K | Q6UX04 | protein_coding | deleterious(0) | possibly_damaging(0.69) | TCGA-BH-A18R-01 | Breast | breast invasive carcinoma | Female | <65 | I/II | Unknown | Unknown | SD |
| CWC27 | insertion | Frame_Shift_Ins | novel | c.1336_1337insAACATGTCTGGAGT | p.Ile446LysfsTer13 | p.I446Kfs*13 | Q6UX04 | protein_coding | TCGA-DS-A1OB-01 | Cervix | cervical & endocervical cancer | Female | <65 | I/II | Chemotherapy | carboplatin | PD | ||
| CWC27 | SNV | Missense_Mutation | rs751858333 | c.269G>A | p.Arg90Gln | p.R90Q | Q6UX04 | protein_coding | deleterious(0) | probably_damaging(0.999) | TCGA-AA-3966-01 | Colorectum | colon adenocarcinoma | Female | >=65 | I/II | Unknown | Unknown | SD |
| CWC27 | SNV | Missense_Mutation | c.209N>A | p.Gly70Asp | p.G70D | Q6UX04 | protein_coding | deleterious(0.01) | probably_damaging(0.998) | TCGA-AA-3972-01 | Colorectum | colon adenocarcinoma | Male | >=65 | III/IV | Chemotherapy | capecitabine | PD | |
| CWC27 | SNV | Missense_Mutation | novel | c.904N>A | p.Glu302Lys | p.E302K | Q6UX04 | protein_coding | tolerated(0.49) | benign(0.003) | TCGA-AA-3984-01 | Colorectum | colon adenocarcinoma | Female | <65 | I/II | Unknown | Unknown | SD |
| CWC27 | SNV | Missense_Mutation | c.283N>T | p.Arg95Trp | p.R95W | Q6UX04 | protein_coding | deleterious(0) | probably_damaging(0.999) | TCGA-AA-A00N-01 | Colorectum | colon adenocarcinoma | Male | >=65 | I/II | Unknown | Unknown | PD | |
| CWC27 | SNV | Missense_Mutation | c.347N>G | p.Thr116Arg | p.T116R | Q6UX04 | protein_coding | deleterious(0) | probably_damaging(1) | TCGA-AA-A010-01 | Colorectum | colon adenocarcinoma | Female | <65 | I/II | Chemotherapy | folinic | CR |
| Page: 1 2 3 4 5 6 |
Top |
Related drugs of malignant transformation related genes |
| Identification of chemicals and drugs interact with genes involved in malignant transfromation |
| (DGIdb 4.0) |
| Entrez ID | Symbol | Category | Interaction Types | Drug Claim Name | Drug Name | PMIDs |
| Page: 1 |

Copyright 2023-Present -The University of Texas Health Science Center at Houston |