Schematic overview of the cellular and molecular mechanisms involved in the cancer progression, including the proposed cellular and molecular mechanisms in cancer cells trajectory. AT1: alveolar type 1 cells; AT2: alveolar type 2 cells; AAH: atypical adenomatous hyperplasia; AIS: adenocarcinoma in situ; MIA: minimally invasive adenocarcinoma; IA: invasive adenocarcinoma; EMT: epithelial-mesenchymal transition

Home

Download

Statistics

Help

Contact

Center for Computational Systems Medicine
leaf

Gene summary

leaf

Malignant transformation analysis

leaf

Malignant transformation related pathway analysis

leaf

Cell-cell communication analysis

leaf

Single-cell gene regulatory network inference analysis

leaf

Somatic mutation of malignant transformation related genes

leaf

Related drugs of malignant transformation related genes

Gene: CWC25

Gene summary for CWC25

check button Gene summary.

Gene informationSpeciesHuman
Gene symbol

CWC25

Gene ID

54883

Gene nameCWC25 spliceosome associated protein homolog
Gene AliasCCDC49
Cytomap17q12
Gene Typeprotein-coding
GO ID

GO:0000375

UniProtAcc

Q9NXE8


Top

Malignant transformation analysis

check button Identification of the aberrant gene expression in precancerous and cancerous lesions by comparing the gene expression of stem-like cells in diseased tissues with normal stem cells
check button Malignant transformation involving gene list.
Entrez IDSymbolReplicatesSpeciesOrganTissueAdj P-valueLog2FCMalignancy
54883CWC25GSM4909290HumanBreastIDC3.31e-469.95e-010.2096
54883CWC25GSM4909292HumanBreastIDC1.12e-109.27e-010.1236
54883CWC25GSM4909293HumanBreastIDC6.80e-457.66e-010.1581
54883CWC25GSM4909296HumanBreastIDC1.38e-07-1.87e-010.1524
54883CWC25GSM4909297HumanBreastIDC6.54e-06-6.13e-020.1517
54883CWC25GSM4909311HumanBreastIDC9.06e-12-1.67e-010.1534
54883CWC25GSM4909312HumanBreastIDC2.86e-05-6.06e-020.1552
54883CWC25GSM4909319HumanBreastIDC1.20e-18-1.03e-010.1563
54883CWC25GSM4909321HumanBreastIDC4.28e-04-5.28e-020.1559
54883CWC25P1HumanBreastIDC1.02e-02-1.08e-010.1527
54883CWC25DCIS2HumanBreastDCIS4.88e-511.59e-010.0085
54883CWC25LZE3DHumanEsophagusHGIN8.77e-044.00e-010.0668
54883CWC25LZE4THumanEsophagusESCC2.96e-123.22e-010.0811
54883CWC25LZE7THumanEsophagusESCC5.14e-123.79e-010.0667
54883CWC25LZE8THumanEsophagusESCC1.43e-091.12e-010.067
54883CWC25LZE20THumanEsophagusESCC1.38e-043.40e-020.0662
54883CWC25LZE21D1HumanEsophagusHGIN1.21e-042.41e-010.0632
54883CWC25LZE22D1HumanEsophagusHGIN1.62e-051.24e-010.0595
54883CWC25LZE22THumanEsophagusESCC6.01e-041.78e-010.068
54883CWC25LZE24THumanEsophagusESCC1.30e-165.14e-010.0596
Page: 1 2 3 4 5 6 7 

check button Transcriptomic changes along malignancy continuum.
TissueExpression DynamicsAbbreviation
BreastThe image shows the transcriptomic changes along malignancy continuum.log2FC in expression of this searched gene in stem-like cells from each diseased tissue sample relative to stem-like cells in normal samples in each tissue plotted against the malignancy continuum. Samples are colored based on if they are from different disease stage.
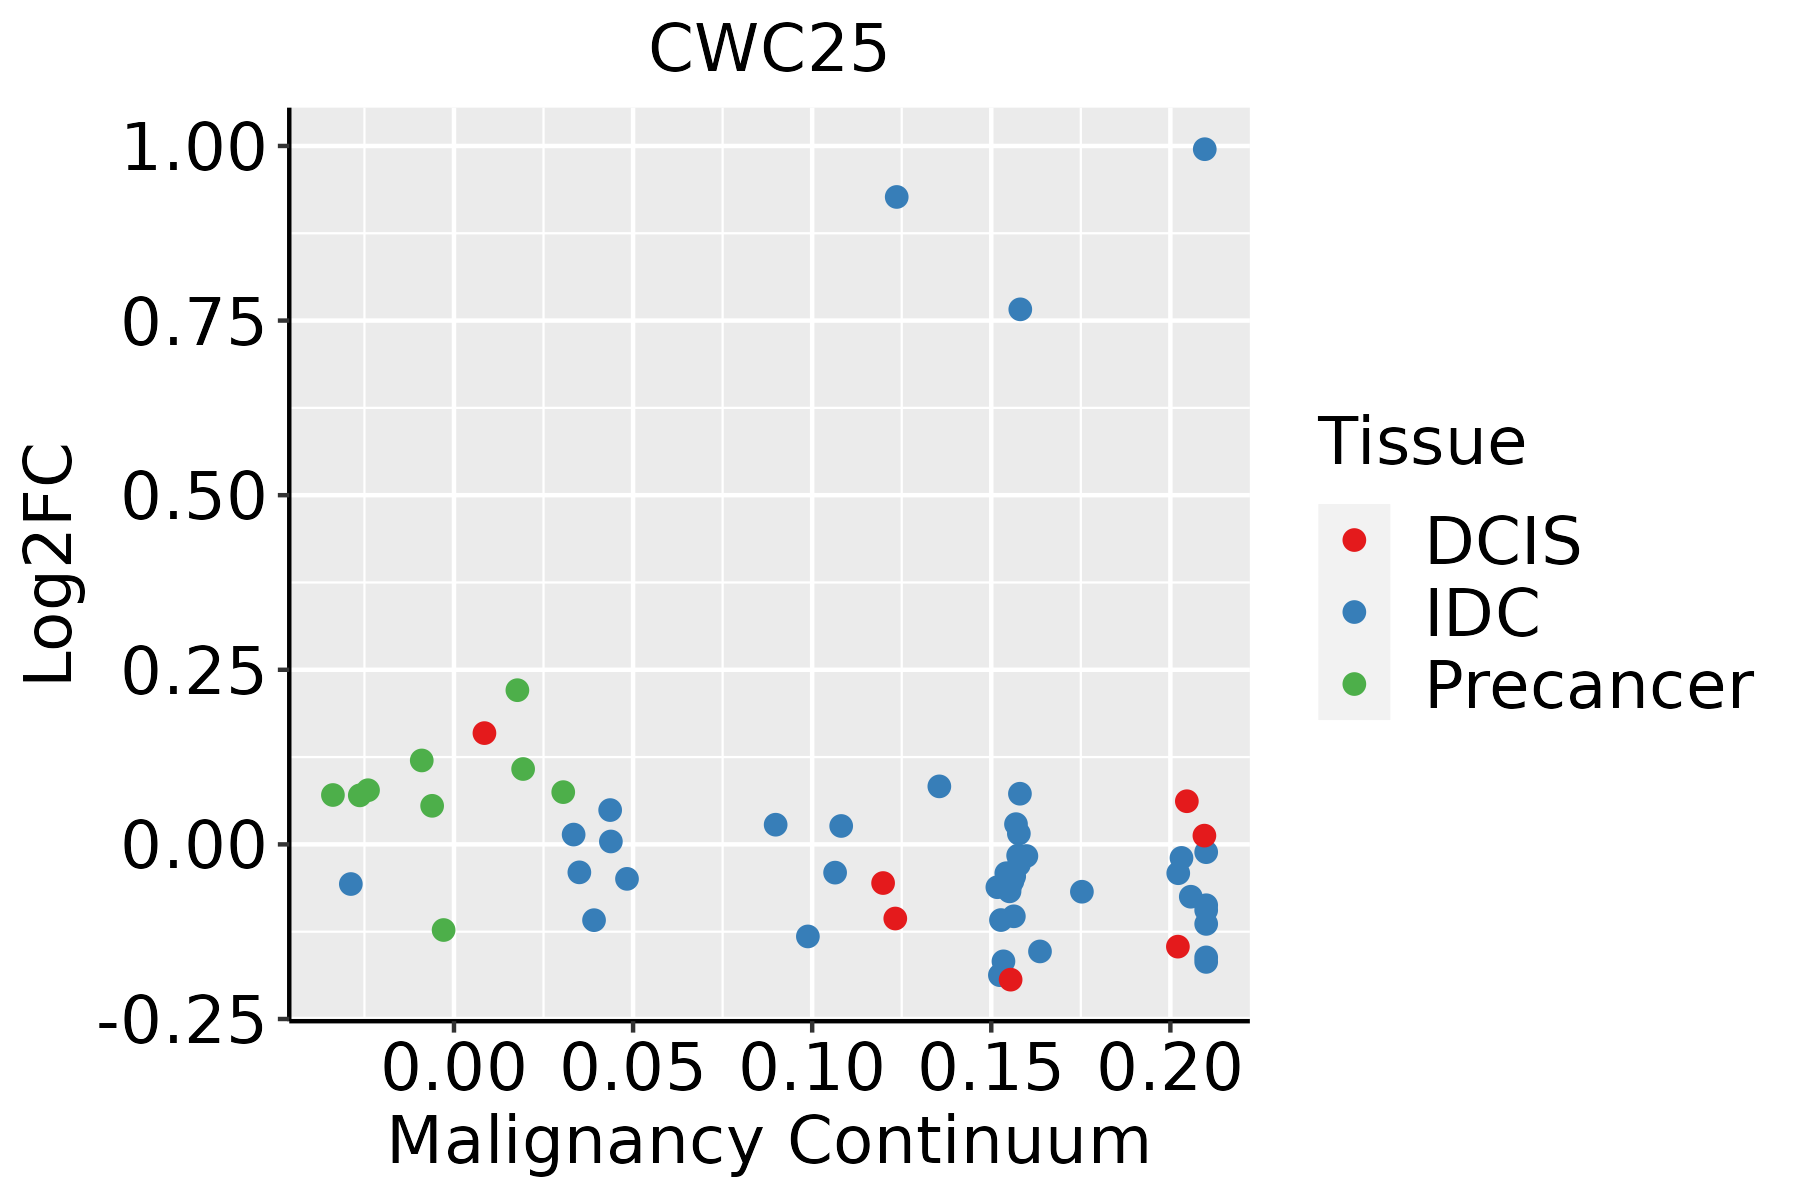
IDC: Invasive ductal carcinoma
DCIS: Ductal carcinoma in situ
Precancer(BRCA1-mut): Precancerous lesion from BRCA1 mutation carriers
EsophagusThe image shows the transcriptomic changes along malignancy continuum.log2FC in expression of this searched gene in stem-like cells from each diseased tissue sample relative to stem-like cells in normal samples in each tissue plotted against the malignancy continuum. Samples are colored based on if they are from different disease stage.ESCC: Esophageal squamous cell carcinoma
HGIN: High-grade intraepithelial neoplasias
LGIN: Low-grade intraepithelial neoplasias
LiverThe image shows the transcriptomic changes along malignancy continuum.log2FC in expression of this searched gene in stem-like cells from each diseased tissue sample relative to stem-like cells in normal samples in each tissue plotted against the malignancy continuum. Samples are colored based on if they are from different disease stage.HCC: Hepatocellular carcinoma
NAFLD: Non-alcoholic fatty liver disease
Oral CavityThe image shows the transcriptomic changes along malignancy continuum.log2FC in expression of this searched gene in stem-like cells from each diseased tissue sample relative to stem-like cells in normal samples in each tissue plotted against the malignancy continuum. Samples are colored based on if they are from different disease stage.
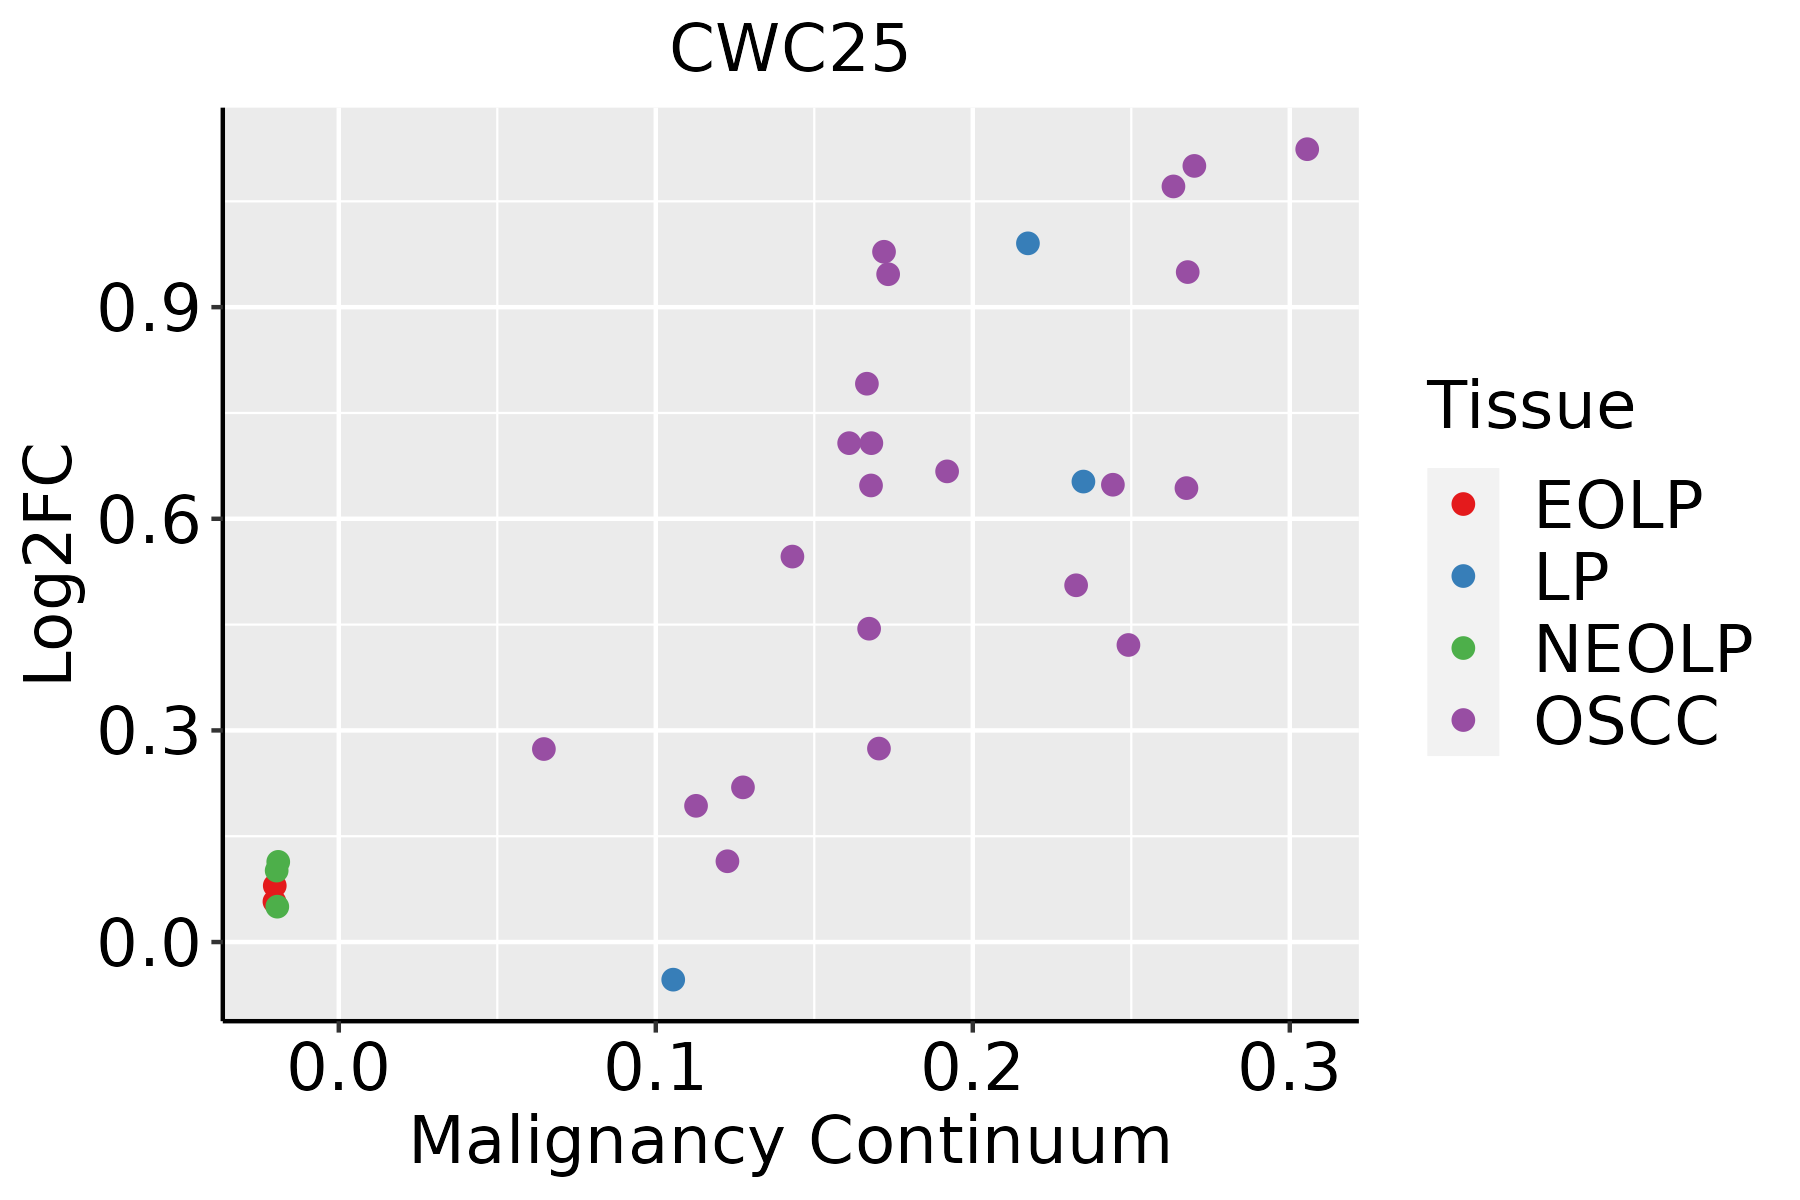
EOLP: Erosive Oral lichen planus
LP: leukoplakia
NEOLP: Non-erosive oral lichen planus
OSCC: Oral squamous cell carcinoma
SkinThe image shows the transcriptomic changes along malignancy continuum.log2FC in expression of this searched gene in stem-like cells from each diseased tissue sample relative to stem-like cells in normal samples in each tissue plotted against the malignancy continuum. Samples are colored based on if they are from different disease stage.
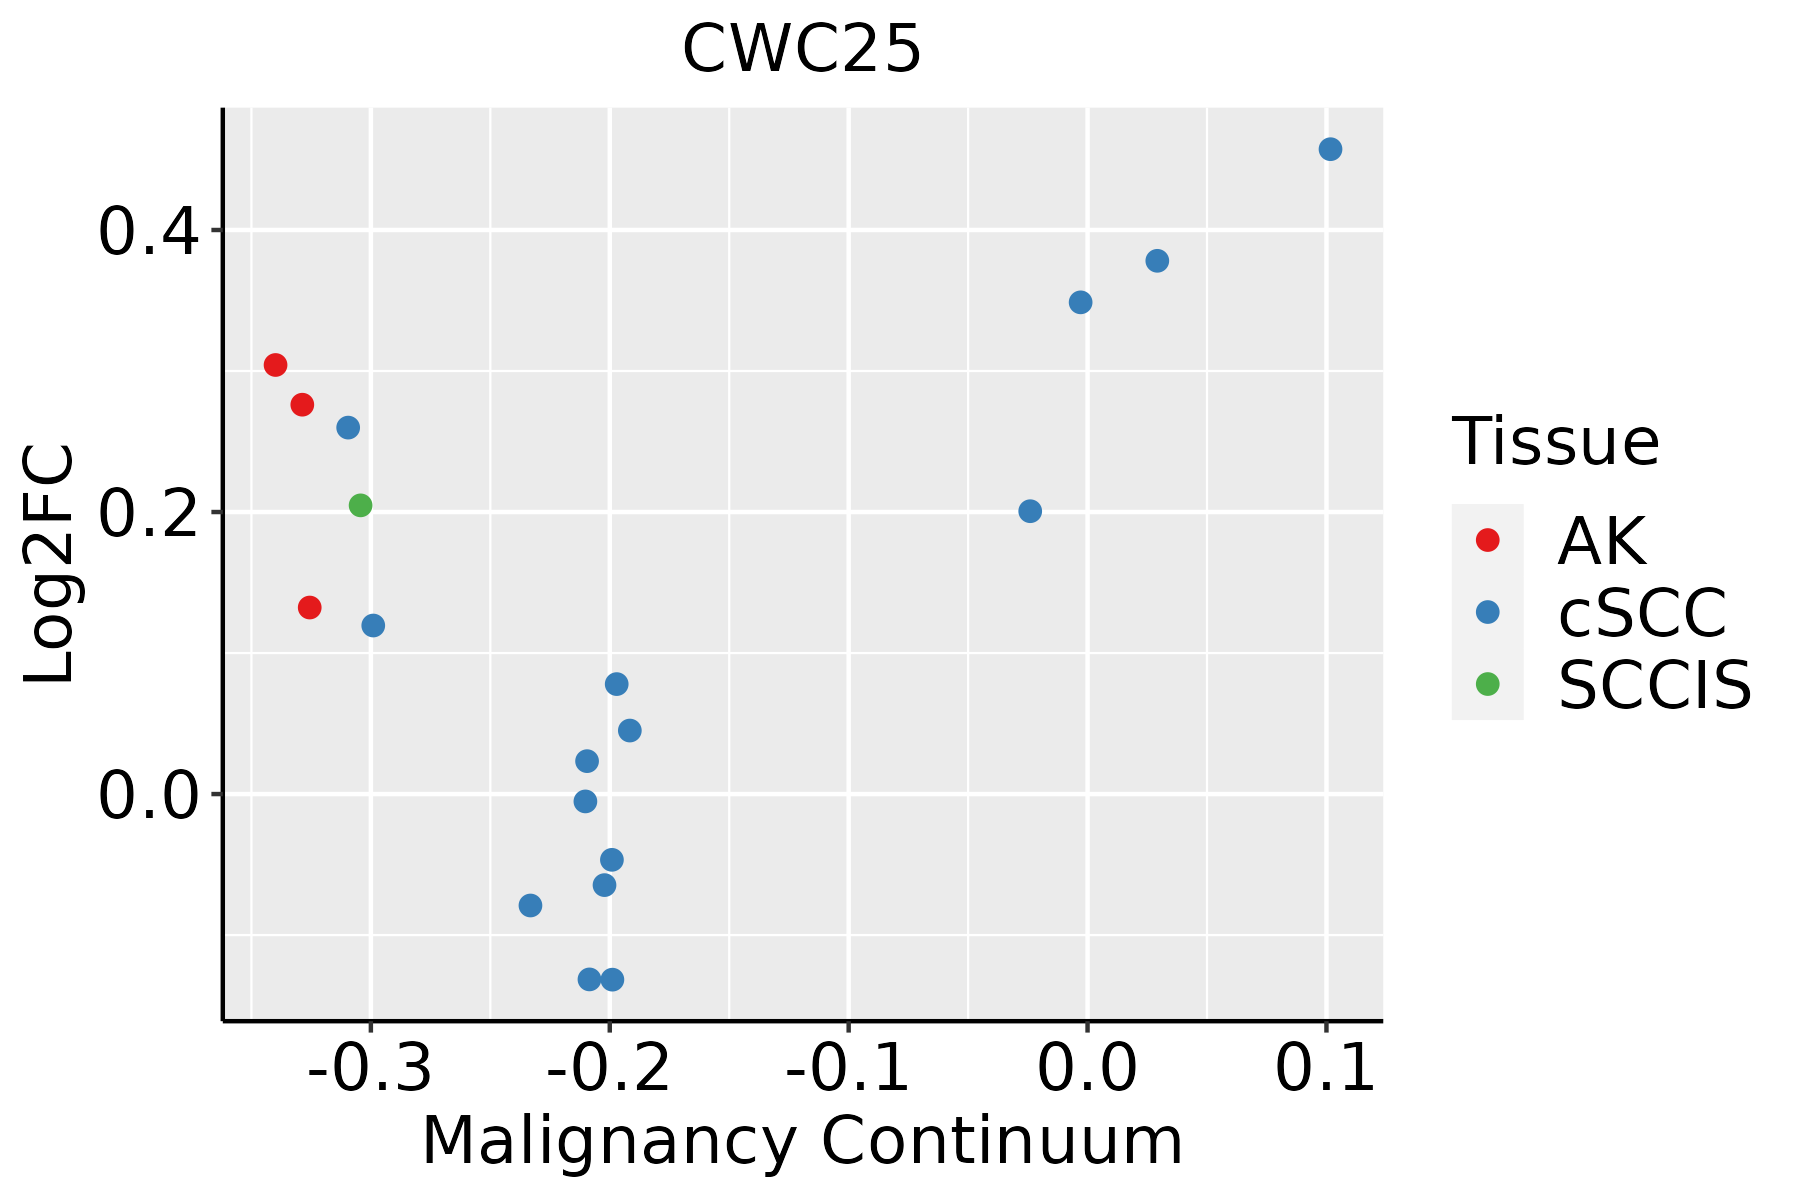
AK: Actinic keratosis
cSCC: Cutaneous squamous cell carcinoma
SCCIS:squamous cell carcinoma in situ
ThyroidThe image shows the transcriptomic changes along malignancy continuum.log2FC in expression of this searched gene in stem-like cells from each diseased tissue sample relative to stem-like cells in normal samples in each tissue plotted against the malignancy continuum. Samples are colored based on if they are from different disease stage.
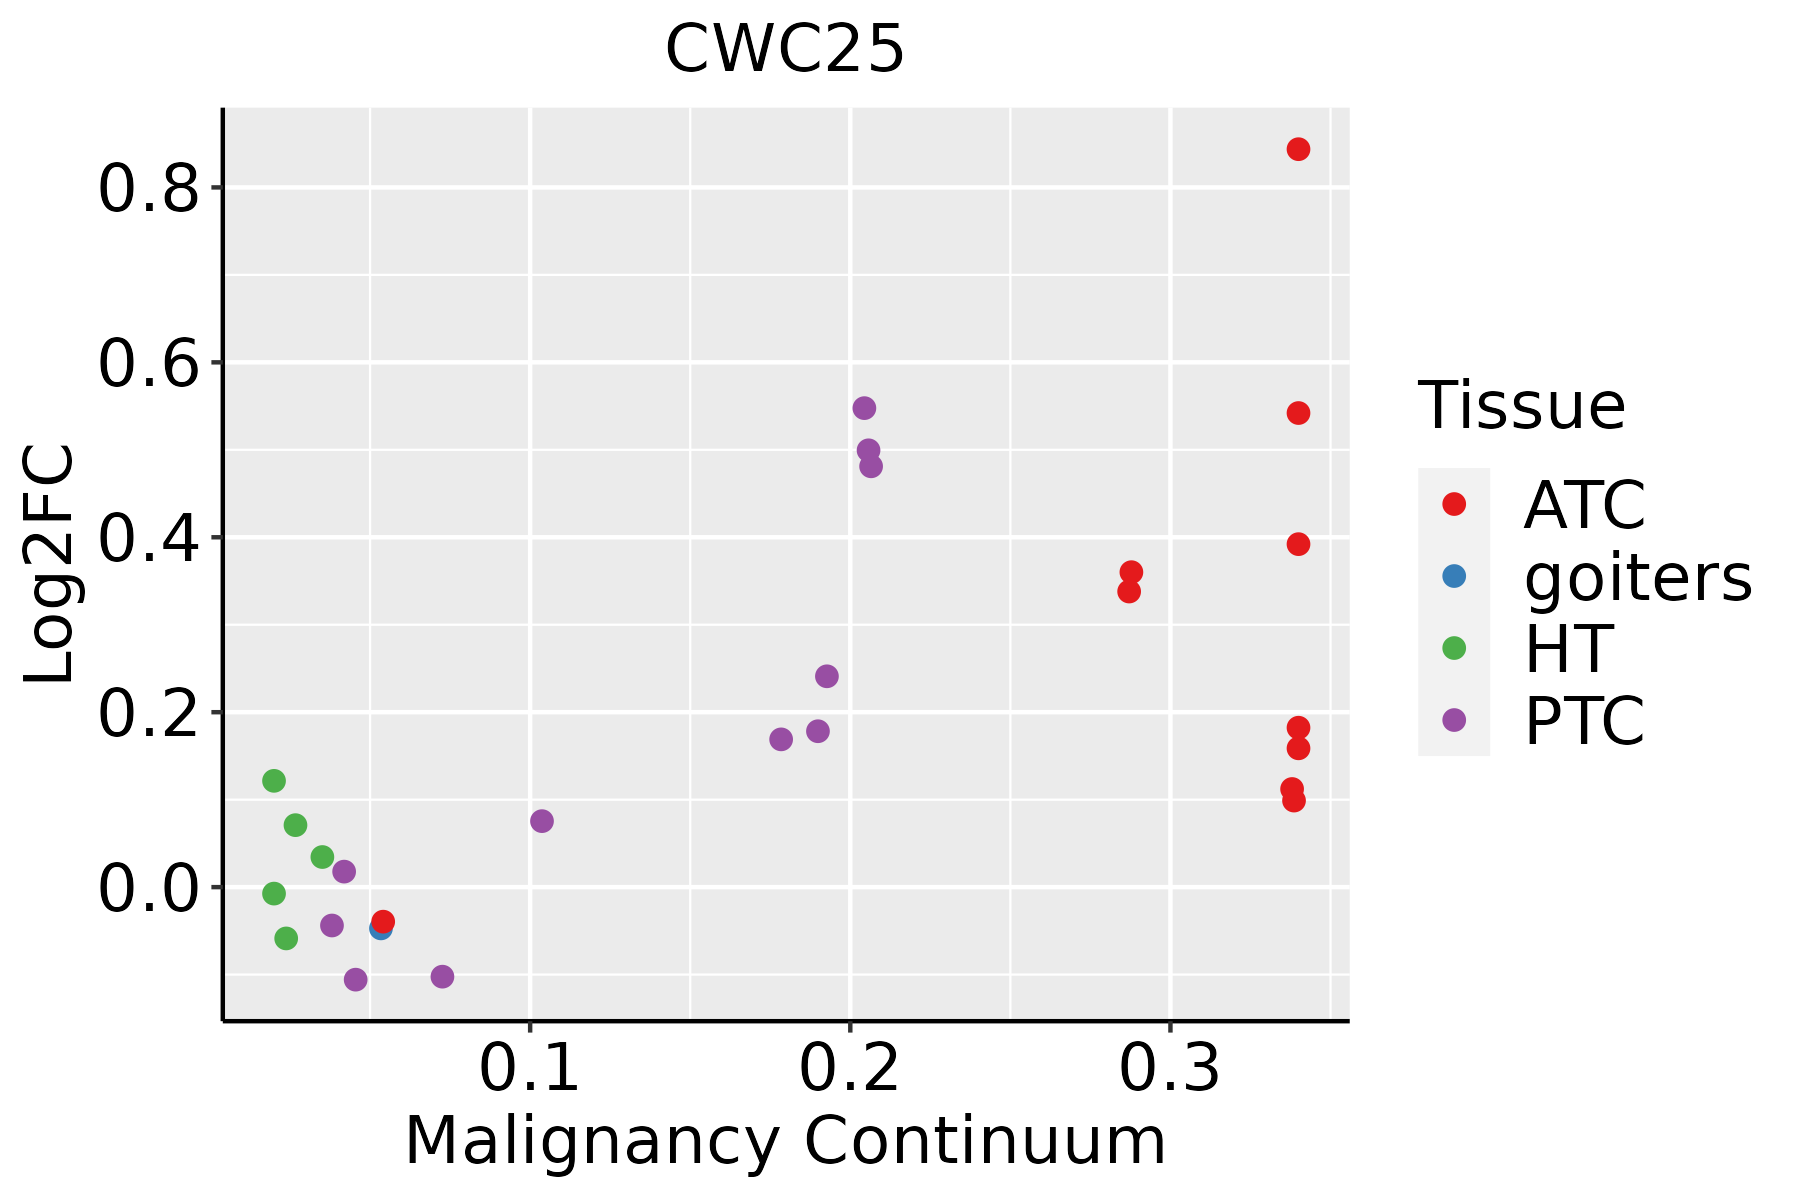
ATC: Anaplastic thyroid cancer
HT: Hashimoto's thyroiditis
PTC: Papillary thyroid cancer
∗log2FC in expression of this searched gene in stem-like cells from each diseased tissue sample relative to stem-like cells in normal samples in each tissue plotted against the malignancy continuum. Samples are colored based on if they are from different disease stage.

Top

Malignant transformation related pathway analysis

check buttonFind out the enriched GO biological processes and KEGG pathways involved in transition from healthy to precancer to cancer
check button Figure of enriched GO biological processes.
TissueDisease StageEnriched GO biological Processes
ColorectumADGO analysis - Figure of enriched GO biological processes: Top 15 enriched GO BP terms are showed in the bar plot of each disease state in each tissue. Each row represents a significant GO biological process which is colored according to the -log10(p.adjust).
ColorectumSERGO analysis - Figure of enriched GO biological processes: Top 15 enriched GO BP terms are showed in the bar plot of each disease state in each tissue. Each row represents a significant GO biological process which is colored according to the -log10(p.adjust).
ColorectumMSSGO analysis - Figure of enriched GO biological processes: Top 15 enriched GO BP terms are showed in the bar plot of each disease state in each tissue. Each row represents a significant GO biological process which is colored according to the -log10(p.adjust).
ColorectumMSI-HGO analysis - Figure of enriched GO biological processes: Top 15 enriched GO BP terms are showed in the bar plot of each disease state in each tissue. Each row represents a significant GO biological process which is colored according to the -log10(p.adjust).
ColorectumFAPGO analysis - Figure of enriched GO biological processes: Top 15 enriched GO BP terms are showed in the bar plot of each disease state in each tissue. Each row represents a significant GO biological process which is colored according to the -log10(p.adjust).
∗Top 15 enriched GO BP terms are showed in the bar plot of each disease state in each tissue. Each row represents a significant GO biological process which is colored according to the -log10(p.adjust).
Page: 1 2 3 4 5 6 7 8 9 

check button Enriched GO biological processes.
GO IDTissueDisease StageDescriptionGene RatioBg Ratiopvaluep.adjustCount
GO:000838014BreastIDCRNA splicing73/1434434/187231.27e-101.57e-0873
GO:000037514BreastIDCRNA splicing, via transesterification reactions58/1434324/187239.44e-109.58e-0858
GO:000037714BreastIDCRNA splicing, via transesterification reactions with bulged adenosine as nucleophile57/1434320/187231.60e-091.49e-0757
GO:000039814BreastIDCmRNA splicing, via spliceosome57/1434320/187231.60e-091.49e-0757
GO:000838024BreastDCISRNA splicing73/1390434/187233.05e-115.08e-0973
GO:000037524BreastDCISRNA splicing, via transesterification reactions58/1390324/187232.89e-103.34e-0858
GO:000037724BreastDCISRNA splicing, via transesterification reactions with bulged adenosine as nucleophile57/1390320/187235.01e-105.35e-0857
GO:000039824BreastDCISmRNA splicing, via spliceosome57/1390320/187235.01e-105.35e-0857
GO:000838026EsophagusHGINRNA splicing160/2587434/187233.74e-341.12e-30160
GO:000037520EsophagusHGINRNA splicing, via transesterification reactions115/2587324/187233.16e-233.80e-20115
GO:000037720EsophagusHGINRNA splicing, via transesterification reactions with bulged adenosine as nucleophile113/2587320/187231.24e-229.26e-20113
GO:000039820EsophagusHGINmRNA splicing, via spliceosome113/2587320/187231.24e-229.26e-20113
GO:0008380111EsophagusESCCRNA splicing336/8552434/187231.74e-423.67e-39336
GO:0000375111EsophagusESCCRNA splicing, via transesterification reactions248/8552324/187233.05e-301.49e-27248
GO:0000377111EsophagusESCCRNA splicing, via transesterification reactions with bulged adenosine as nucleophile244/8552320/187232.52e-291.07e-26244
GO:0000398111EsophagusESCCmRNA splicing, via spliceosome244/8552320/187232.52e-291.07e-26244
GO:000838012LiverCirrhoticRNA splicing229/4634434/187239.13e-372.86e-33229
GO:000037512LiverCirrhoticRNA splicing, via transesterification reactions175/4634324/187235.95e-307.47e-27175
GO:000037712LiverCirrhoticRNA splicing, via transesterification reactions with bulged adenosine as nucleophile172/4634320/187234.02e-293.60e-26172
GO:000039812LiverCirrhoticmRNA splicing, via spliceosome172/4634320/187234.02e-293.60e-26172
Page: 1 2 3 

check button Enriched KEGG pathways.
Pathway IDTissueDisease StageDescriptionGene RatioBg Ratiopvaluep.adjustqvalueCount
Page: 1 

Top

Cell-cell communication analysis

check buttonIdentification of potential cell-cell interactions between two cell types and their ligand-receptor pairs for different disease states
LigandReceptorLRpairPathwayTissueDisease Stage
Page: 1 

Top

Single-cell gene regulatory network inference analysis

check buttonFind out the significant the regulons (TFs) and the target genes of each regulon across cell types for different disease states
TFCell TypeTissueDisease StageTarget GeneRSSRegulon Activity
∗The dot plots of a searched regulon are shown for all cell subpopulations in each disease state of each tissue based on the regulon specific score inferred using pySCENIC and by calculating the average expression.
Page: 1 

Top

Somatic mutation of malignant transformation related genes

check buttonAnnotation of somatic variants for genes involved in malignant transformation
Hugo SymbolVariant ClassVariant ClassificationdbSNP RSHGVScHGVSpHGVSp ShortSWISSPROTBIOTYPESIFTPolyPhenTumor Sample BarcodeTissueHistologySexAgeStageTherapy TypesDrugsOutcome
CWC25SNVMissense_Mutationrs747456719c.37C>Ap.His13Asnp.H13NQ9NXE8protein_codingdeleterious(0)probably_damaging(0.999)TCGA-A8-A083-01Breastbreast invasive carcinomaFemale>=65I/IIUnknownUnknownSD
CWC25SNVMissense_Mutationrs747456719c.37N>Ap.His13Asnp.H13NQ9NXE8protein_codingdeleterious(0)probably_damaging(0.999)TCGA-A8-A095-01Breastbreast invasive carcinomaFemale<65I/IIChemotherapy5-fluorouracilCR
CWC25SNVMissense_Mutationrs747456719c.37N>Ap.His13Asnp.H13NQ9NXE8protein_codingdeleterious(0)probably_damaging(0.999)TCGA-AN-A0FV-01Breastbreast invasive carcinomaFemale<65I/IIUnknownUnknownSD
CWC25SNVMissense_Mutationrs555146635c.187N>Ap.Val63Ilep.V63IQ9NXE8protein_codingtolerated(0.19)benign(0.015)TCGA-AR-A24N-01Breastbreast invasive carcinomaFemale<65I/IIUnknownUnknownSD
CWC25SNVMissense_Mutationrs747456719c.37N>Ap.His13Asnp.H13NQ9NXE8protein_codingdeleterious(0)probably_damaging(0.999)TCGA-B6-A0I9-01Breastbreast invasive carcinomaFemale<65III/IVUnknownUnknownPD
CWC25SNVMissense_Mutationrs747456719c.37N>Ap.His13Asnp.H13NQ9NXE8protein_codingdeleterious(0)probably_damaging(0.999)TCGA-B6-A0IA-01Breastbreast invasive carcinomaFemale<65I/IIUnknownUnknownSD
CWC25SNVMissense_Mutationrs747456719c.37N>Ap.His13Asnp.H13NQ9NXE8protein_codingdeleterious(0)probably_damaging(0.999)TCGA-D8-A27M-01Breastbreast invasive carcinomaFemale<65I/IIChemotherapymethotrexate+5SD
CWC25insertionNonsense_Mutationnovelc.1018_1019insTCAAACCACCAGTGTTCAAAGTGACCCTGCTTCATTGAGTCCTGAAACp.Glu340delinsValLysProProValPheLysValThrLeuLeuHisTerValLeuLysGlnp.E340delinsVKPPVFKVTLLH*VLKQQ9NXE8protein_codingTCGA-A2-A0CQ-01Breastbreast invasive carcinomaFemale<65I/IIChemotherapyadriamycinSD
CWC25deletionIn_Frame_Delnovelc.37_63delNNNNNNNNNNNNNNNNNNNNNNNNNNNp.His13_Glu21delp.H13_E21delQ9NXE8protein_codingTCGA-C8-A130-01Breastbreast invasive carcinomaFemale<65III/IVUnknownUnknownSD
CWC25deletionFrame_Shift_Delnovelc.467delAp.Asn156IlefsTer3p.N156Ifs*3Q9NXE8protein_codingTCGA-EW-A2FV-01Breastbreast invasive carcinomaFemale<65III/IVChemotherapydocetaxelSD
Page: 1 2 3 4 5 

Top

Related drugs of malignant transformation related genes

check buttonIdentification of chemicals and drugs interact with genes involved in malignant transfromation
(DGIdb 4.0)
Entrez IDSymbolCategoryInteraction TypesDrug Claim NameDrug NamePMIDs
Page: 1