| Tissue | Expression Dynamics | Abbreviation |
| Cervix | 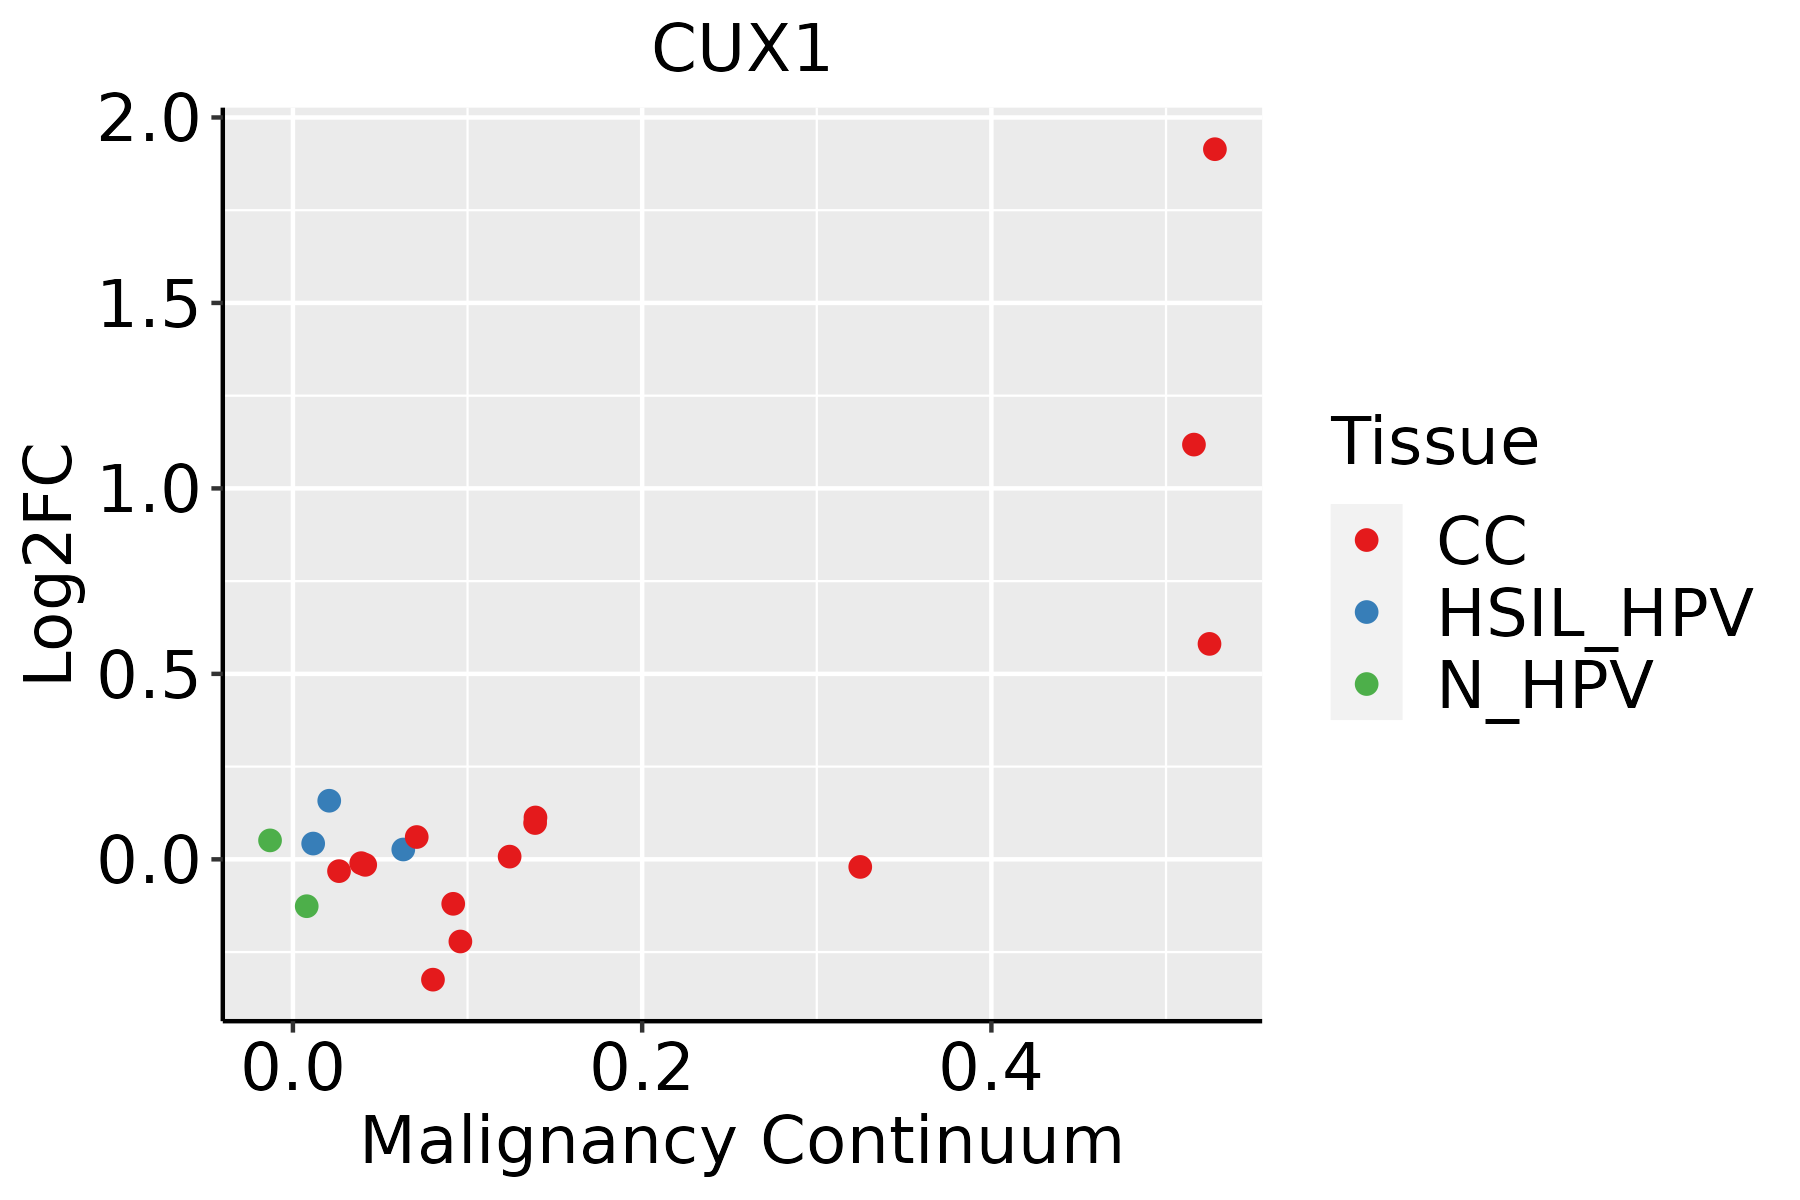 | CC: Cervix cancer |
| HSIL_HPV: HPV-infected high-grade squamous intraepithelial lesions |
| N_HPV: HPV-infected normal cervix |
| Colorectum (GSE201348) |  | FAP: Familial adenomatous polyposis |
| CRC: Colorectal cancer |
| Colorectum (HTA11) |  | AD: Adenomas |
| SER: Sessile serrated lesions |
| MSI-H: Microsatellite-high colorectal cancer |
| MSS: Microsatellite stable colorectal cancer |
| Endometrium | 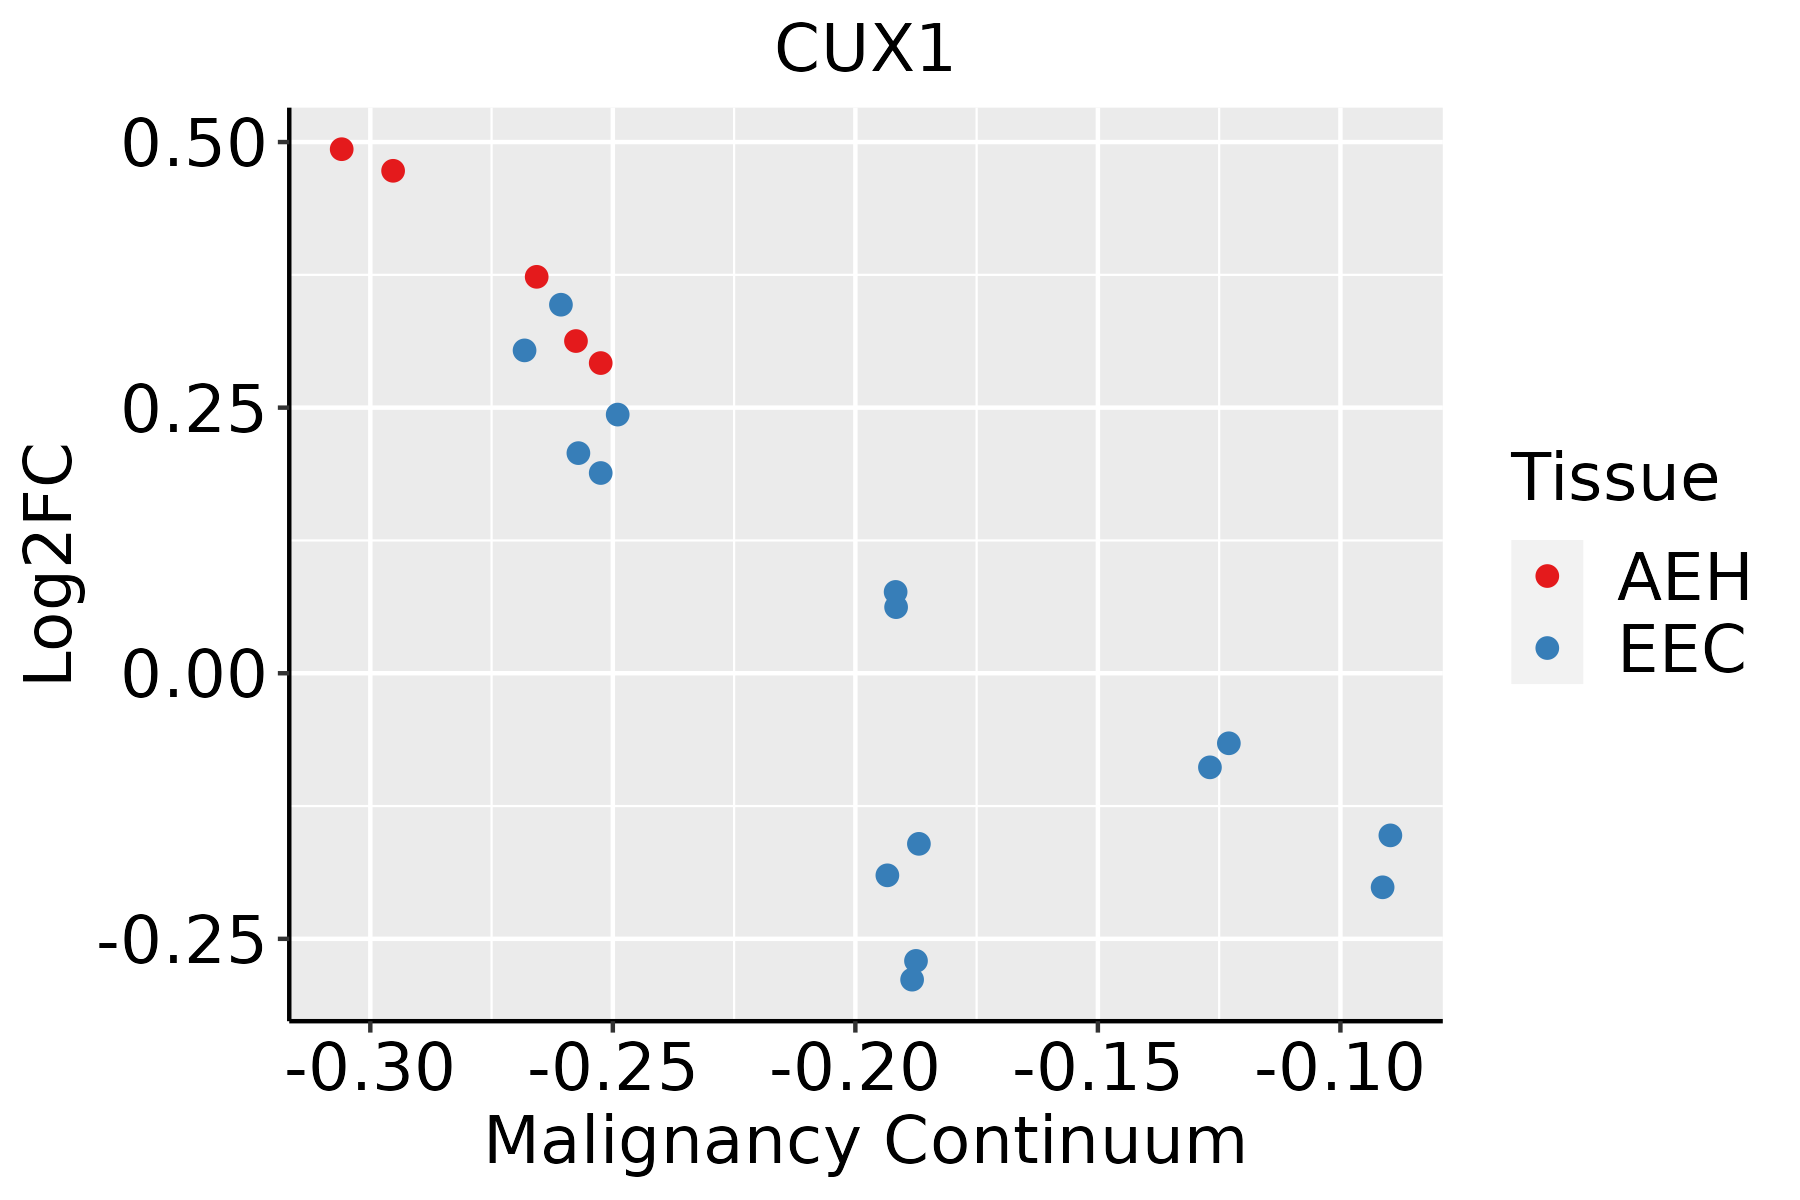 | AEH: Atypical endometrial hyperplasia |
| EEC: Endometrioid Cancer |
| Esophagus |  | ESCC: Esophageal squamous cell carcinoma |
| HGIN: High-grade intraepithelial neoplasias |
| LGIN: Low-grade intraepithelial neoplasias |
| GC | 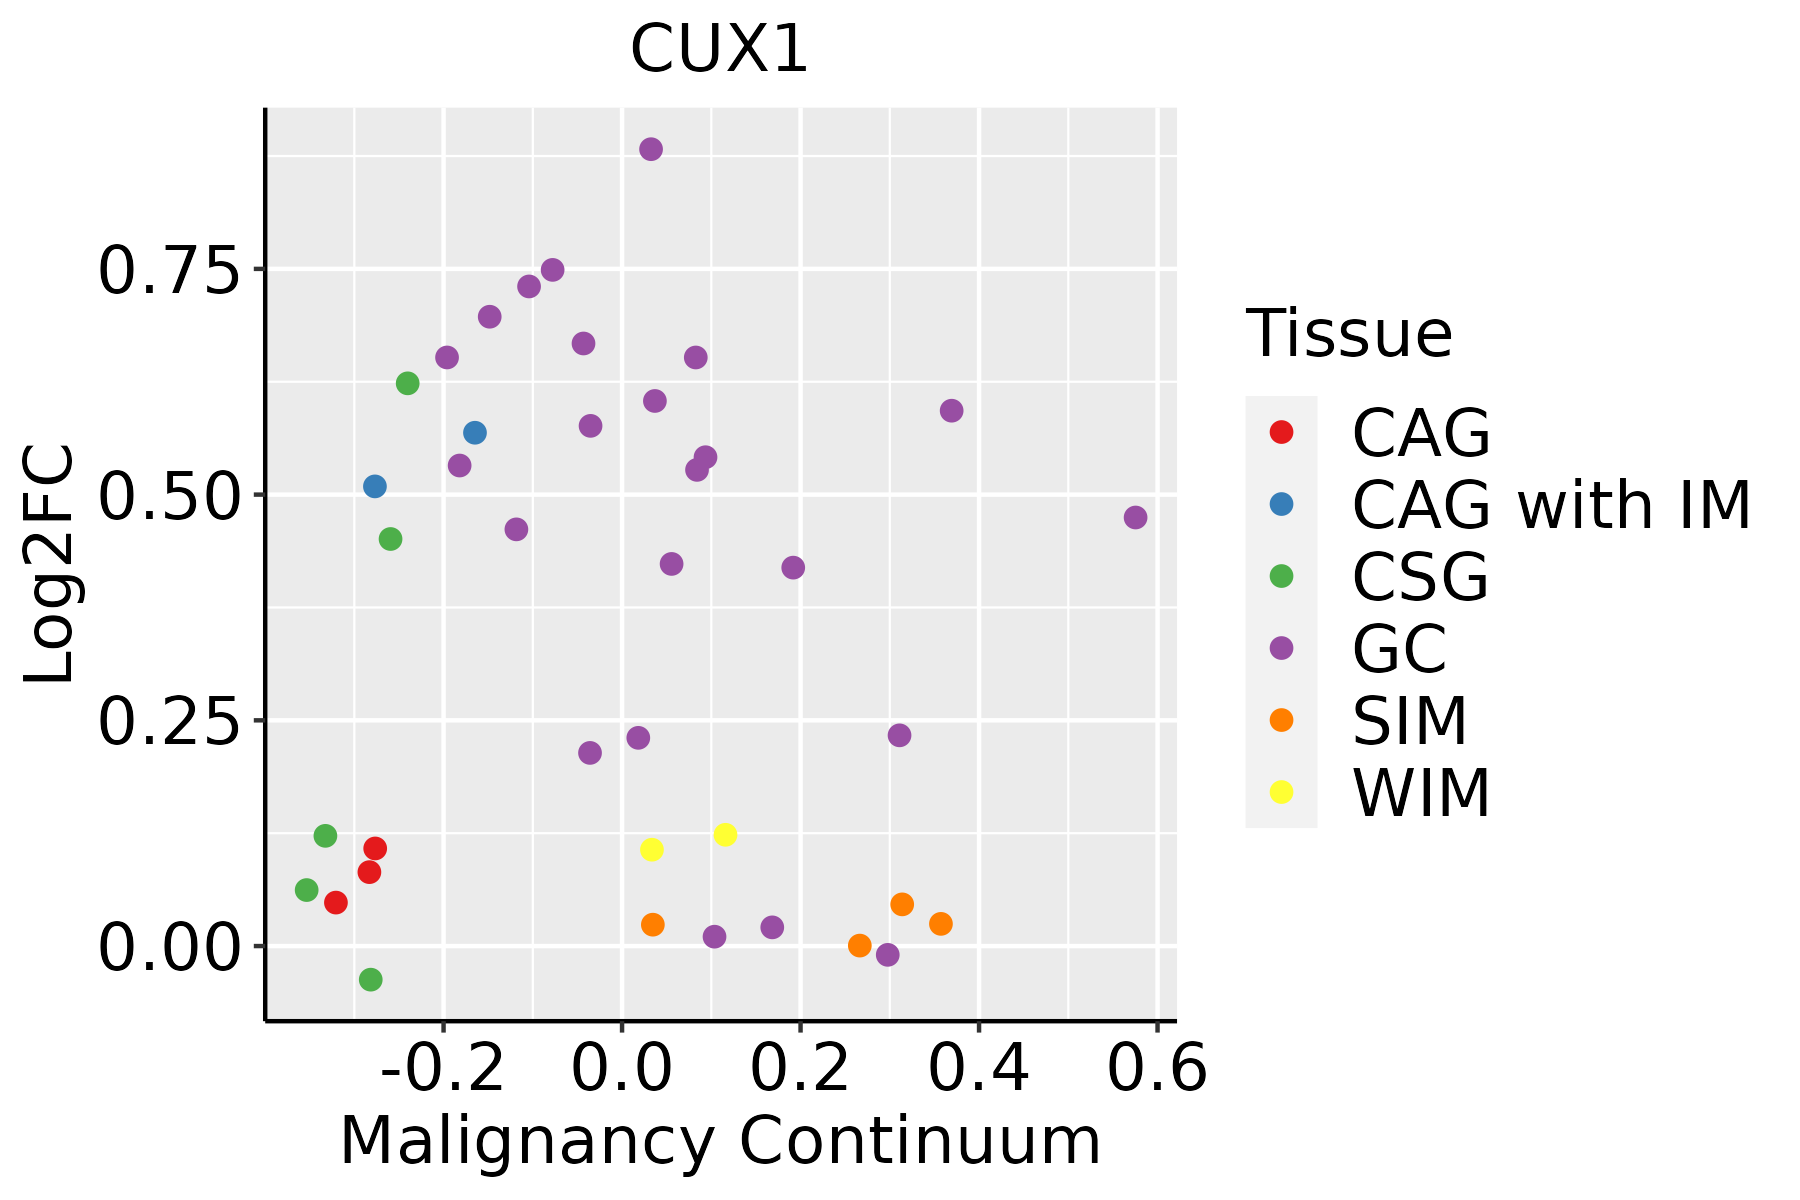 | CAG: Chronic atrophic gastritis |
| CAG with IM: Chronic atrophic gastritis with intestinal metaplasia |
| CSG: Chronic superficial gastritis |
| GC: Gastric cancer |
| SIM: Severe intestinal metaplasia |
| WIM: Wild intestinal metaplasia |
| Liver | 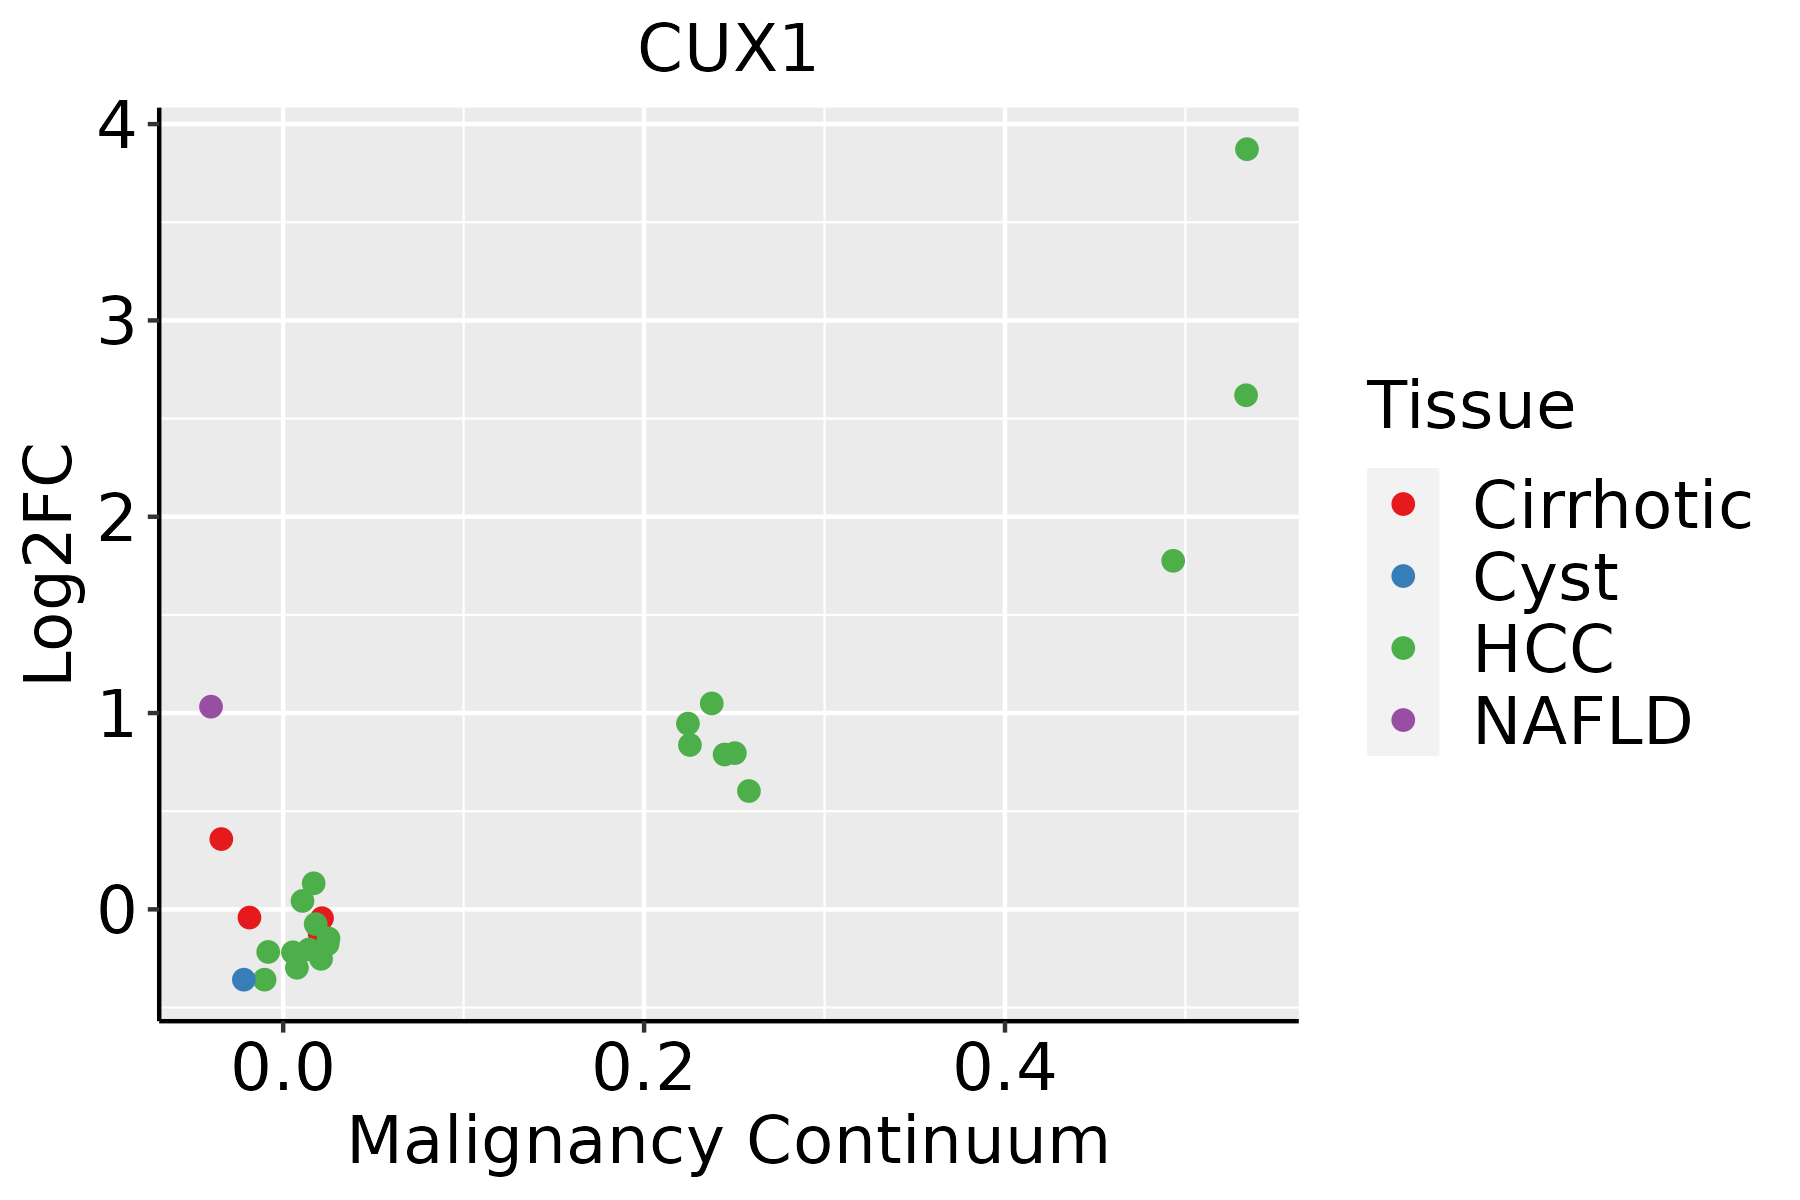 | HCC: Hepatocellular carcinoma |
| NAFLD: Non-alcoholic fatty liver disease |
| Lung | 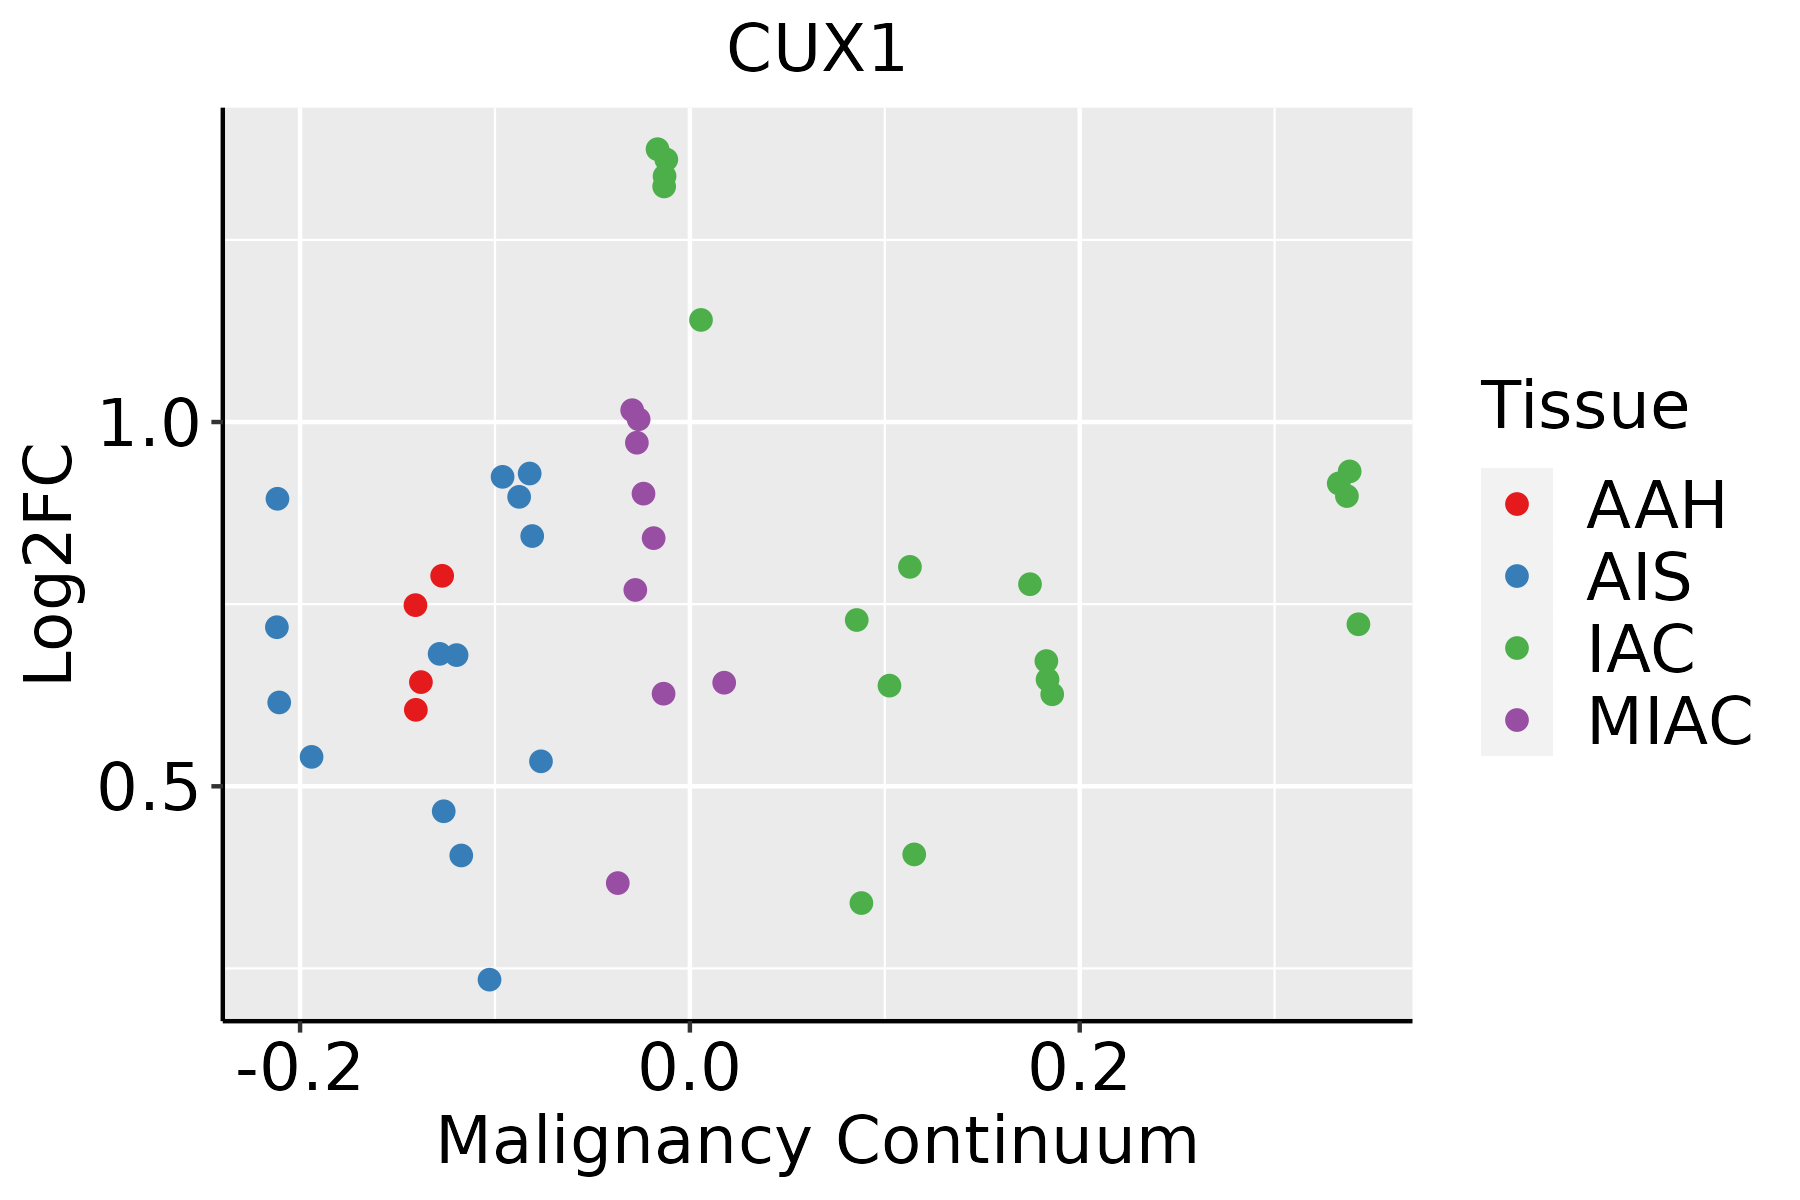 | AAH: Atypical adenomatous hyperplasia |
| AIS: Adenocarcinoma in situ |
| IAC: Invasive lung adenocarcinoma |
| MIA: Minimally invasive adenocarcinoma |
| Oral Cavity | 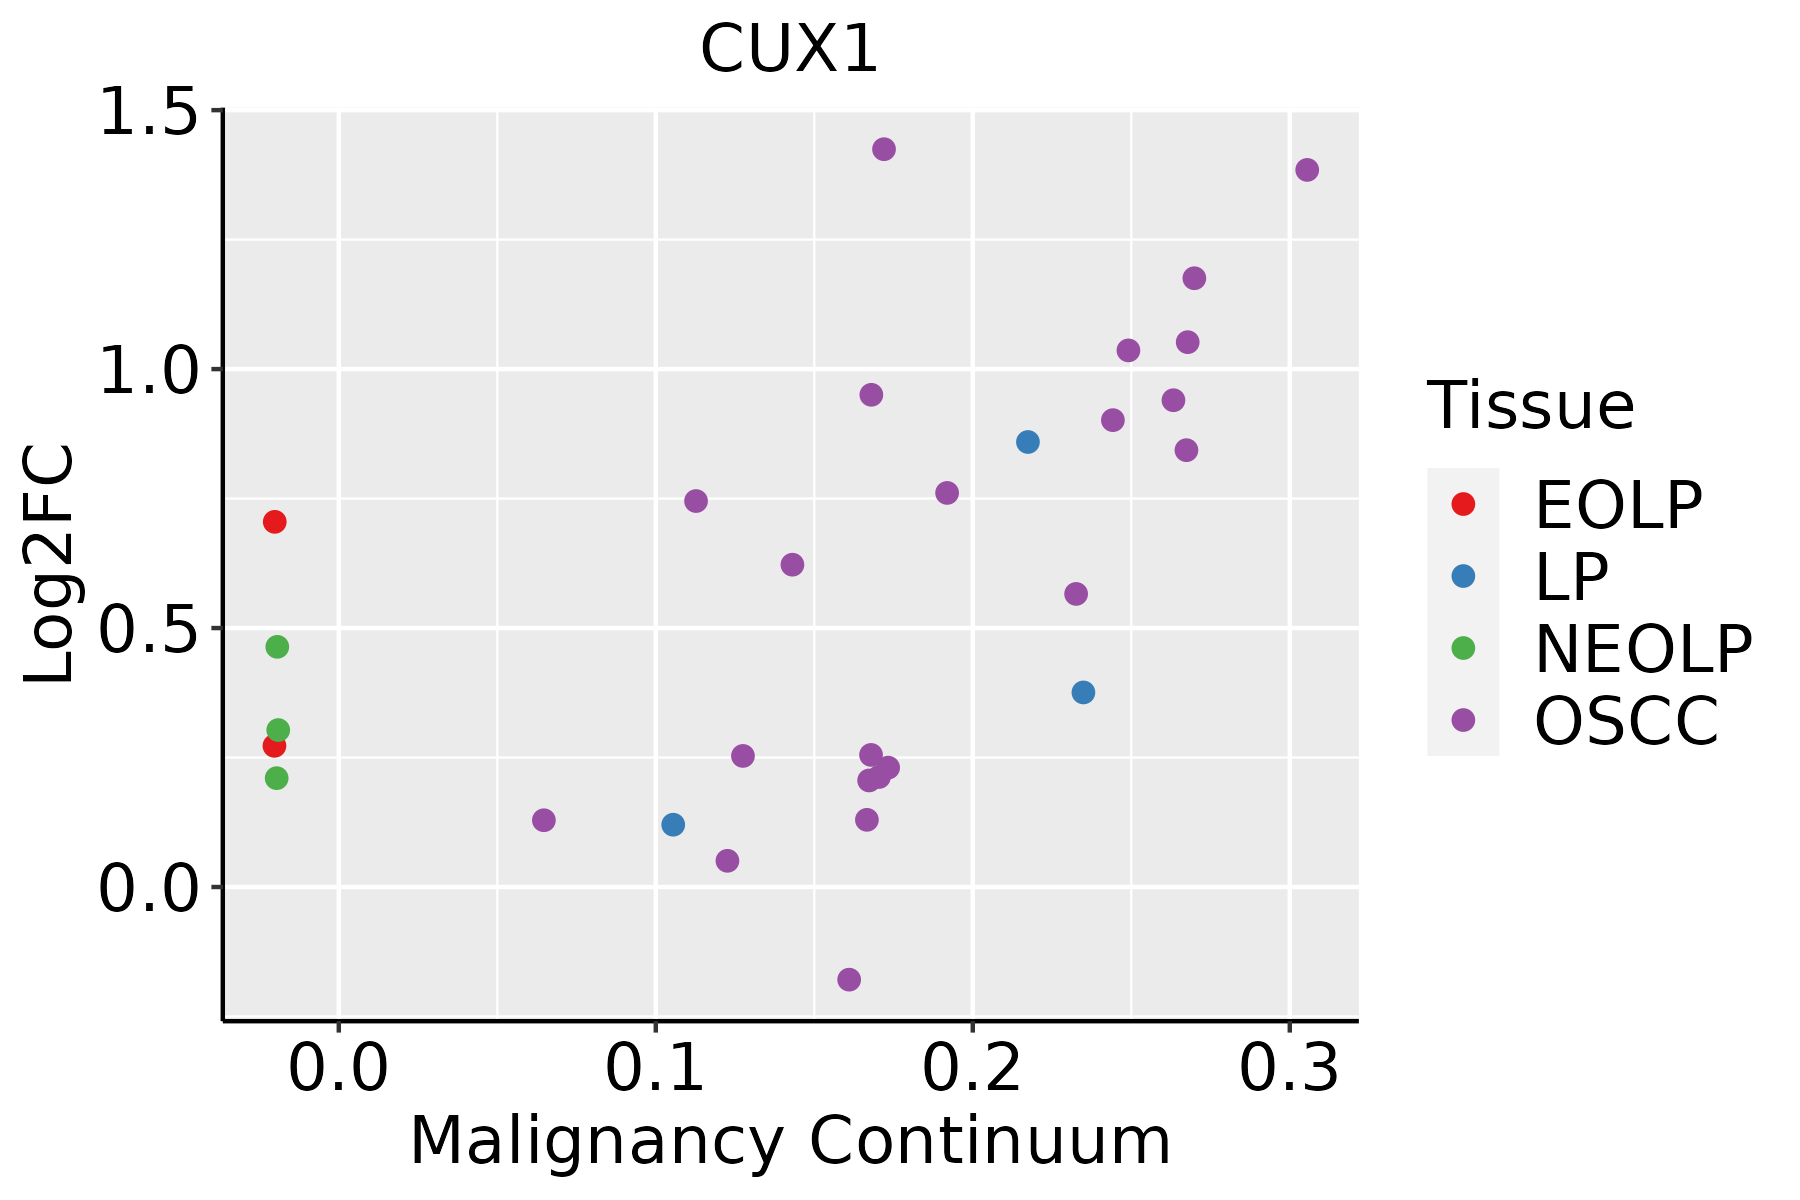 | EOLP: Erosive Oral lichen planus |
| LP: leukoplakia |
| NEOLP: Non-erosive oral lichen planus |
| OSCC: Oral squamous cell carcinoma |
| Prostate | 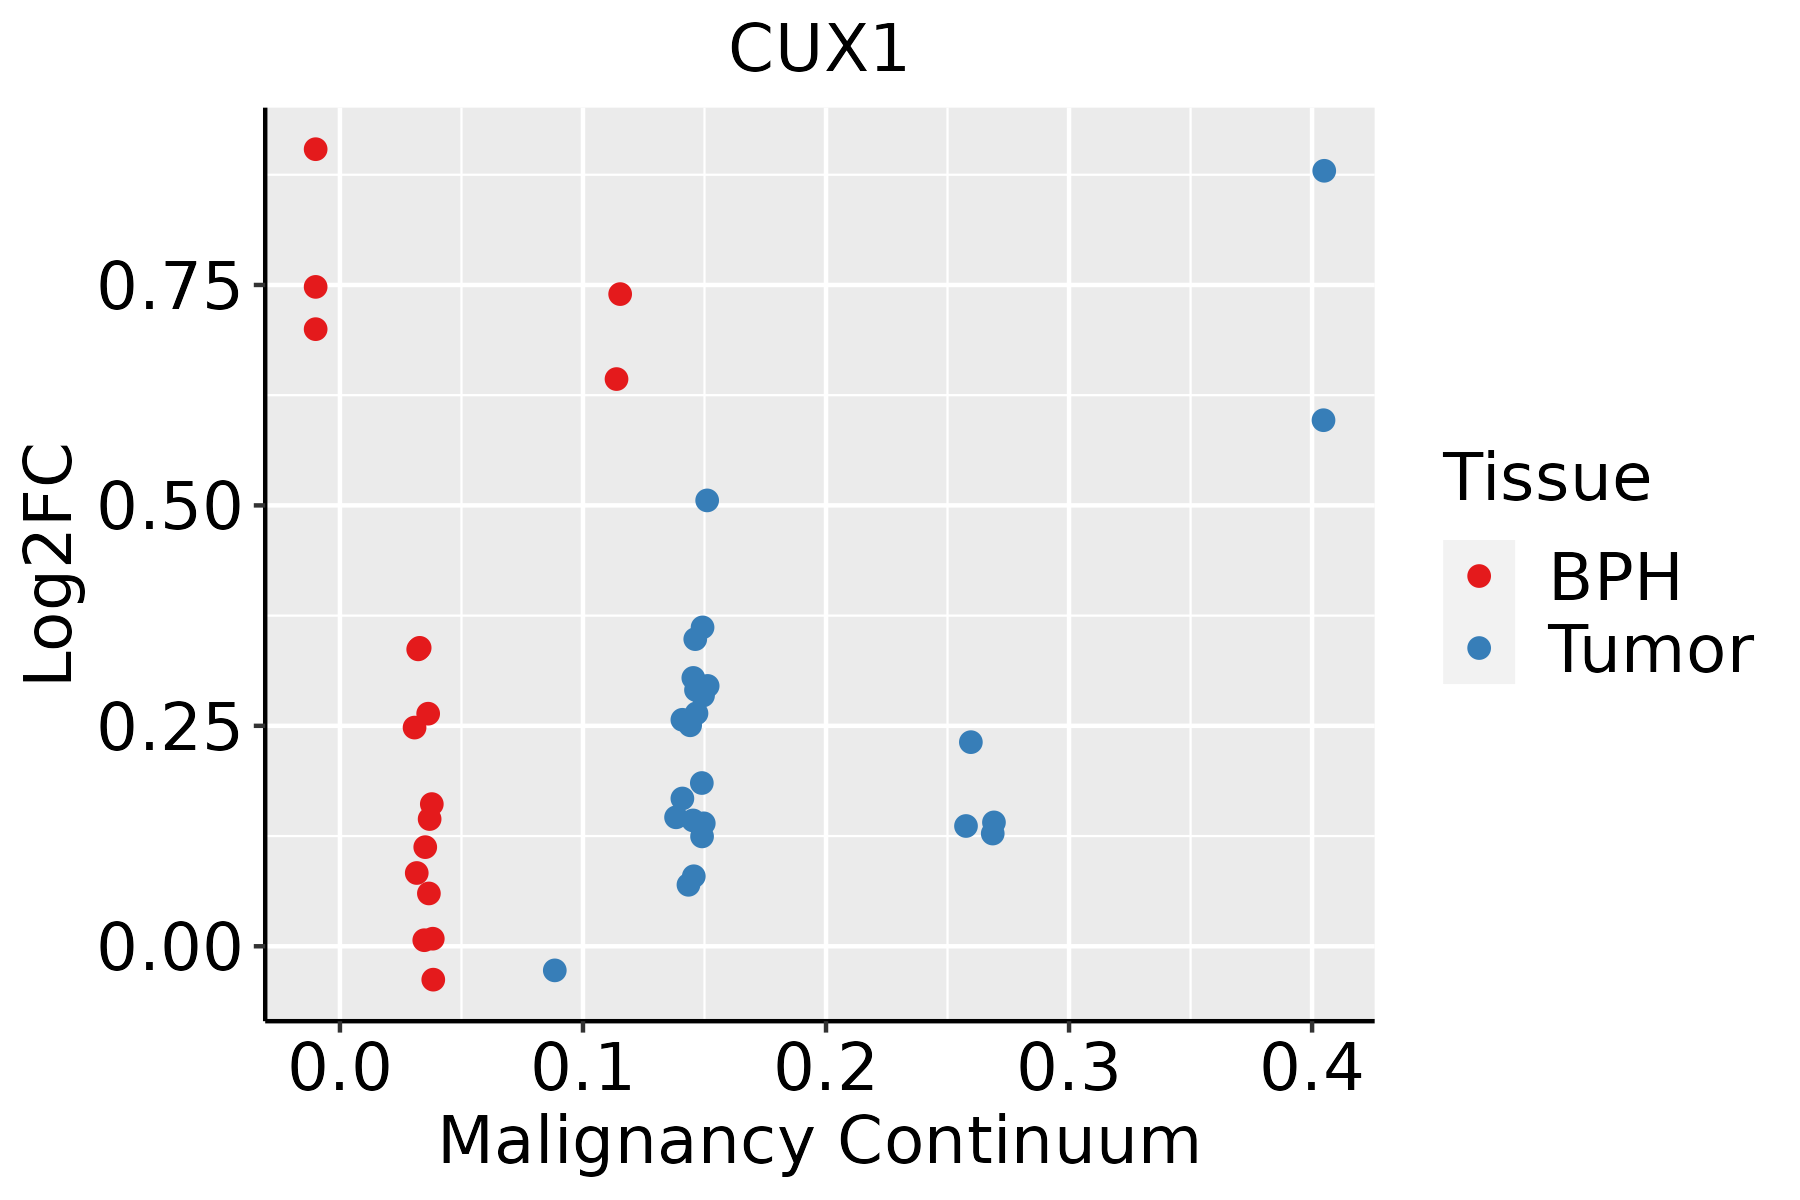 | BPH: Benign Prostatic Hyperplasia |
| Skin | 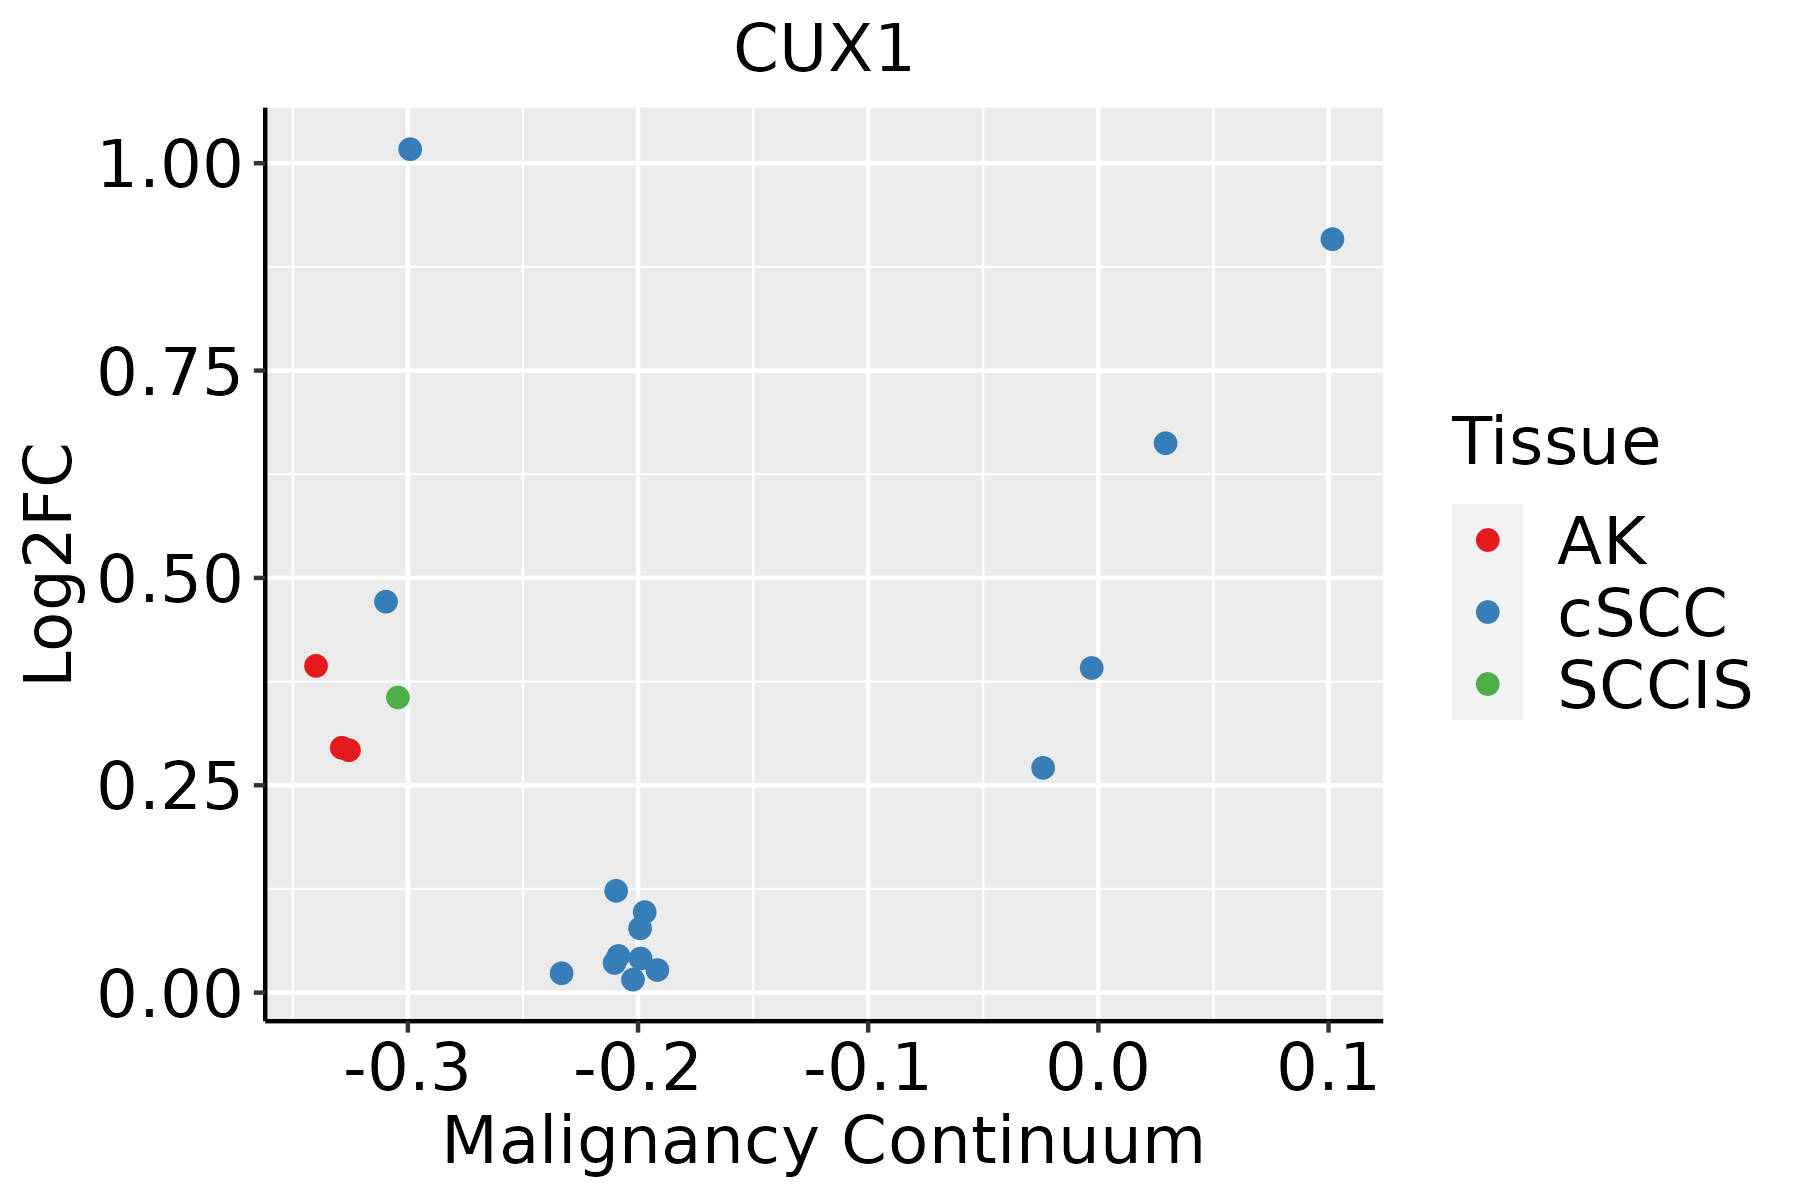 | AK: Actinic keratosis |
| cSCC: Cutaneous squamous cell carcinoma |
| SCCIS:squamous cell carcinoma in situ |
| Thyroid |  | ATC: Anaplastic thyroid cancer |
| HT: Hashimoto's thyroiditis |
| PTC: Papillary thyroid cancer |
| GO ID | Tissue | Disease Stage | Description | Gene Ratio | Bg Ratio | pvalue | p.adjust | Count |
| GO:002260410 | Cervix | CC | regulation of cell morphogenesis | 84/2311 | 309/18723 | 1.00e-12 | 4.29e-10 | 84 |
| GO:00107699 | Cervix | CC | regulation of cell morphogenesis involved in differentiation | 31/2311 | 96/18723 | 2.43e-07 | 1.05e-05 | 31 |
| GO:00163587 | Cervix | CC | dendrite development | 58/2311 | 243/18723 | 4.52e-07 | 1.76e-05 | 58 |
| GO:00109757 | Cervix | CC | regulation of neuron projection development | 88/2311 | 445/18723 | 4.26e-06 | 1.09e-04 | 88 |
| GO:00107206 | Cervix | CC | positive regulation of cell development | 64/2311 | 298/18723 | 5.69e-06 | 1.41e-04 | 64 |
| GO:00313467 | Cervix | CC | positive regulation of cell projection organization | 72/2311 | 353/18723 | 1.04e-05 | 2.32e-04 | 72 |
| GO:00107708 | Cervix | CC | positive regulation of cell morphogenesis involved in differentiation | 23/2311 | 79/18723 | 5.44e-05 | 8.04e-04 | 23 |
| GO:00481938 | Cervix | CC | Golgi vesicle transport | 58/2311 | 296/18723 | 2.24e-04 | 2.54e-03 | 58 |
| GO:00519603 | Cervix | CC | regulation of nervous system development | 77/2311 | 443/18723 | 1.13e-03 | 9.30e-03 | 77 |
| GO:00507676 | Cervix | CC | regulation of neurogenesis | 65/2311 | 364/18723 | 1.33e-03 | 1.05e-02 | 65 |
| GO:00507694 | Cervix | CC | positive regulation of neurogenesis | 43/2311 | 225/18723 | 2.25e-03 | 1.61e-02 | 43 |
| GO:00488135 | Cervix | CC | dendrite morphogenesis | 30/2311 | 146/18723 | 3.27e-03 | 2.13e-02 | 30 |
| GO:00519622 | Cervix | CC | positive regulation of nervous system development | 48/2311 | 272/18723 | 6.60e-03 | 3.65e-02 | 48 |
| GO:00507733 | Cervix | CC | regulation of dendrite development | 22/2311 | 103/18723 | 6.75e-03 | 3.71e-02 | 22 |
| GO:0048193 | Colorectum | AD | Golgi vesicle transport | 109/3918 | 296/18723 | 1.80e-10 | 1.68e-08 | 109 |
| GO:0022604 | Colorectum | AD | regulation of cell morphogenesis | 109/3918 | 309/18723 | 3.08e-09 | 2.07e-07 | 109 |
| GO:0010975 | Colorectum | AD | regulation of neuron projection development | 129/3918 | 445/18723 | 2.88e-05 | 5.37e-04 | 129 |
| GO:0031346 | Colorectum | AD | positive regulation of cell projection organization | 104/3918 | 353/18723 | 8.26e-05 | 1.30e-03 | 104 |
| GO:0010769 | Colorectum | AD | regulation of cell morphogenesis involved in differentiation | 35/3918 | 96/18723 | 3.26e-04 | 3.85e-03 | 35 |
| GO:0010770 | Colorectum | AD | positive regulation of cell morphogenesis involved in differentiation | 30/3918 | 79/18723 | 3.81e-04 | 4.38e-03 | 30 |
| Hugo Symbol | Variant Class | Variant Classification | dbSNP RS | HGVSc | HGVSp | HGVSp Short | SWISSPROT | BIOTYPE | SIFT | PolyPhen | Tumor Sample Barcode | Tissue | Histology | Sex | Age | Stage | Therapy Types | Drugs | Outcome |
| CUX1 | SNV | Missense_Mutation | | c.2893N>A | p.Glu965Lys | p.E965K | P39880 | protein_coding | deleterious(0) | probably_damaging(0.994) | TCGA-A2-A0D2-01 | Breast | breast invasive carcinoma | Female | <65 | I/II | Chemotherapy | adriamycin | SD |
| CUX1 | SNV | Missense_Mutation | rs782031337 | c.2470N>C | p.Glu824Gln | p.E824Q | P39880 | protein_coding | deleterious(0) | possibly_damaging(0.57) | TCGA-AC-A23H-01 | Breast | breast invasive carcinoma | Female | >=65 | I/II | Unknown | Unknown | PD |
| CUX1 | SNV | Missense_Mutation | novel | c.213N>A | p.Phe71Leu | p.F71L | P39880 | protein_coding | deleterious(0.04) | probably_damaging(0.969) | TCGA-AR-A0TY-01 | Breast | breast invasive carcinoma | Female | <65 | I/II | Unspecific | Paclitaxel | PD |
| CUX1 | SNV | Missense_Mutation | rs782680467 | c.352N>T | p.Arg118Cys | p.R118C | P39880 | protein_coding | deleterious(0) | probably_damaging(0.998) | TCGA-B6-A0IB-01 | Breast | breast invasive carcinoma | Female | <65 | III/IV | Unknown | Unknown | PD |
| CUX1 | SNV | Missense_Mutation | | c.1879G>A | p.Asp627Asn | p.D627N | P39880 | protein_coding | deleterious(0.02) | probably_damaging(0.992) | TCGA-BH-A0HF-01 | Breast | breast invasive carcinoma | Female | >=65 | I/II | Hormone Therapy | arimidex | SD |
| CUX1 | SNV | Missense_Mutation | rs369468371 | c.2575N>A | p.Gly859Ser | p.G859S | P39880 | protein_coding | tolerated(1) | benign(0) | TCGA-D8-A1XZ-01 | Breast | breast invasive carcinoma | Female | >=65 | III/IV | Hormone Therapy | tamoxiphen+anastrozolum | SD |
| CUX1 | SNV | Missense_Mutation | | c.1976N>A | p.Arg659Gln | p.R659Q | P39880 | protein_coding | deleterious_low_confidence(0.01) | probably_damaging(0.99) | TCGA-D8-A27G-01 | Breast | breast invasive carcinoma | Female | >=65 | I/II | Unknown | Unknown | SD |
| CUX1 | SNV | Missense_Mutation | novel | c.1079N>T | p.Ala360Val | p.A360V | P39880 | protein_coding | tolerated(0.21) | possibly_damaging(0.647) | TCGA-E9-A54Y-01 | Breast | breast invasive carcinoma | Female | <65 | III/IV | Unknown | Unknown | SD |
| CUX1 | SNV | Missense_Mutation | rs369826605 | c.2896N>C | p.Lys966Gln | p.K966Q | P39880 | protein_coding | deleterious(0.02) | probably_damaging(0.997) | TCGA-LL-A441-01 | Breast | breast invasive carcinoma | Female | <65 | I/II | Chemotherapy | taxotere | CR |
| CUX1 | insertion | In_Frame_Ins | novel | c.167_168insGACCCA | p.Thr56_Pro57insThrHis | p.T56_P57insTH | P39880 | protein_coding | | | TCGA-A8-A06Q-01 | Breast | breast invasive carcinoma | Female | <65 | III/IV | Unknown | Unknown | SD |


