
|
|||||
|
 | |
| |
| |
| |
| |
| |
|
Gene: CUTC |
Gene summary for CUTC |
| Gene information | Species | Human | Gene symbol | CUTC | Gene ID | 51076 |
| Gene name | cutC copper transporter | |
| Gene Alias | CGI-32 | |
| Cytomap | 10q24.2 | |
| Gene Type | protein-coding | GO ID | GO:0000041 | UniProtAcc | Q9NTM9 |
Top |
Malignant transformation analysis |
| Identification of the aberrant gene expression in precancerous and cancerous lesions by comparing the gene expression of stem-like cells in diseased tissues with normal stem cells |
| Entrez ID | Symbol | Replicates | Species | Organ | Tissue | Adj P-value | Log2FC | Malignancy |
| 51076 | CUTC | LZE4T | Human | Esophagus | ESCC | 6.33e-05 | 1.30e-01 | 0.0811 |
| 51076 | CUTC | LZE24T | Human | Esophagus | ESCC | 2.92e-13 | 2.57e-01 | 0.0596 |
| 51076 | CUTC | LZE6T | Human | Esophagus | ESCC | 1.68e-12 | 2.96e-01 | 0.0845 |
| 51076 | CUTC | P2T-E | Human | Esophagus | ESCC | 5.03e-12 | 1.94e-01 | 0.1177 |
| 51076 | CUTC | P4T-E | Human | Esophagus | ESCC | 1.79e-10 | 2.25e-01 | 0.1323 |
| 51076 | CUTC | P5T-E | Human | Esophagus | ESCC | 7.14e-13 | 1.77e-01 | 0.1327 |
| 51076 | CUTC | P8T-E | Human | Esophagus | ESCC | 3.19e-12 | 1.15e-01 | 0.0889 |
| 51076 | CUTC | P9T-E | Human | Esophagus | ESCC | 4.76e-07 | 1.93e-01 | 0.1131 |
| 51076 | CUTC | P10T-E | Human | Esophagus | ESCC | 1.72e-05 | 3.01e-04 | 0.116 |
| 51076 | CUTC | P11T-E | Human | Esophagus | ESCC | 3.94e-02 | 1.05e-01 | 0.1426 |
| 51076 | CUTC | P12T-E | Human | Esophagus | ESCC | 5.91e-22 | 2.59e-01 | 0.1122 |
| 51076 | CUTC | P15T-E | Human | Esophagus | ESCC | 1.83e-08 | 1.42e-01 | 0.1149 |
| 51076 | CUTC | P16T-E | Human | Esophagus | ESCC | 4.09e-20 | 1.72e-01 | 0.1153 |
| 51076 | CUTC | P17T-E | Human | Esophagus | ESCC | 4.53e-03 | 1.81e-01 | 0.1278 |
| 51076 | CUTC | P19T-E | Human | Esophagus | ESCC | 1.23e-03 | 3.62e-01 | 0.1662 |
| 51076 | CUTC | P20T-E | Human | Esophagus | ESCC | 1.42e-14 | 1.60e-01 | 0.1124 |
| 51076 | CUTC | P21T-E | Human | Esophagus | ESCC | 6.04e-22 | 2.31e-01 | 0.1617 |
| 51076 | CUTC | P22T-E | Human | Esophagus | ESCC | 3.88e-13 | 1.21e-01 | 0.1236 |
| 51076 | CUTC | P23T-E | Human | Esophagus | ESCC | 2.71e-22 | 5.15e-01 | 0.108 |
| 51076 | CUTC | P24T-E | Human | Esophagus | ESCC | 3.67e-08 | 1.42e-01 | 0.1287 |
| Page: 1 2 3 4 |
| Tissue | Expression Dynamics | Abbreviation |
| Esophagus | 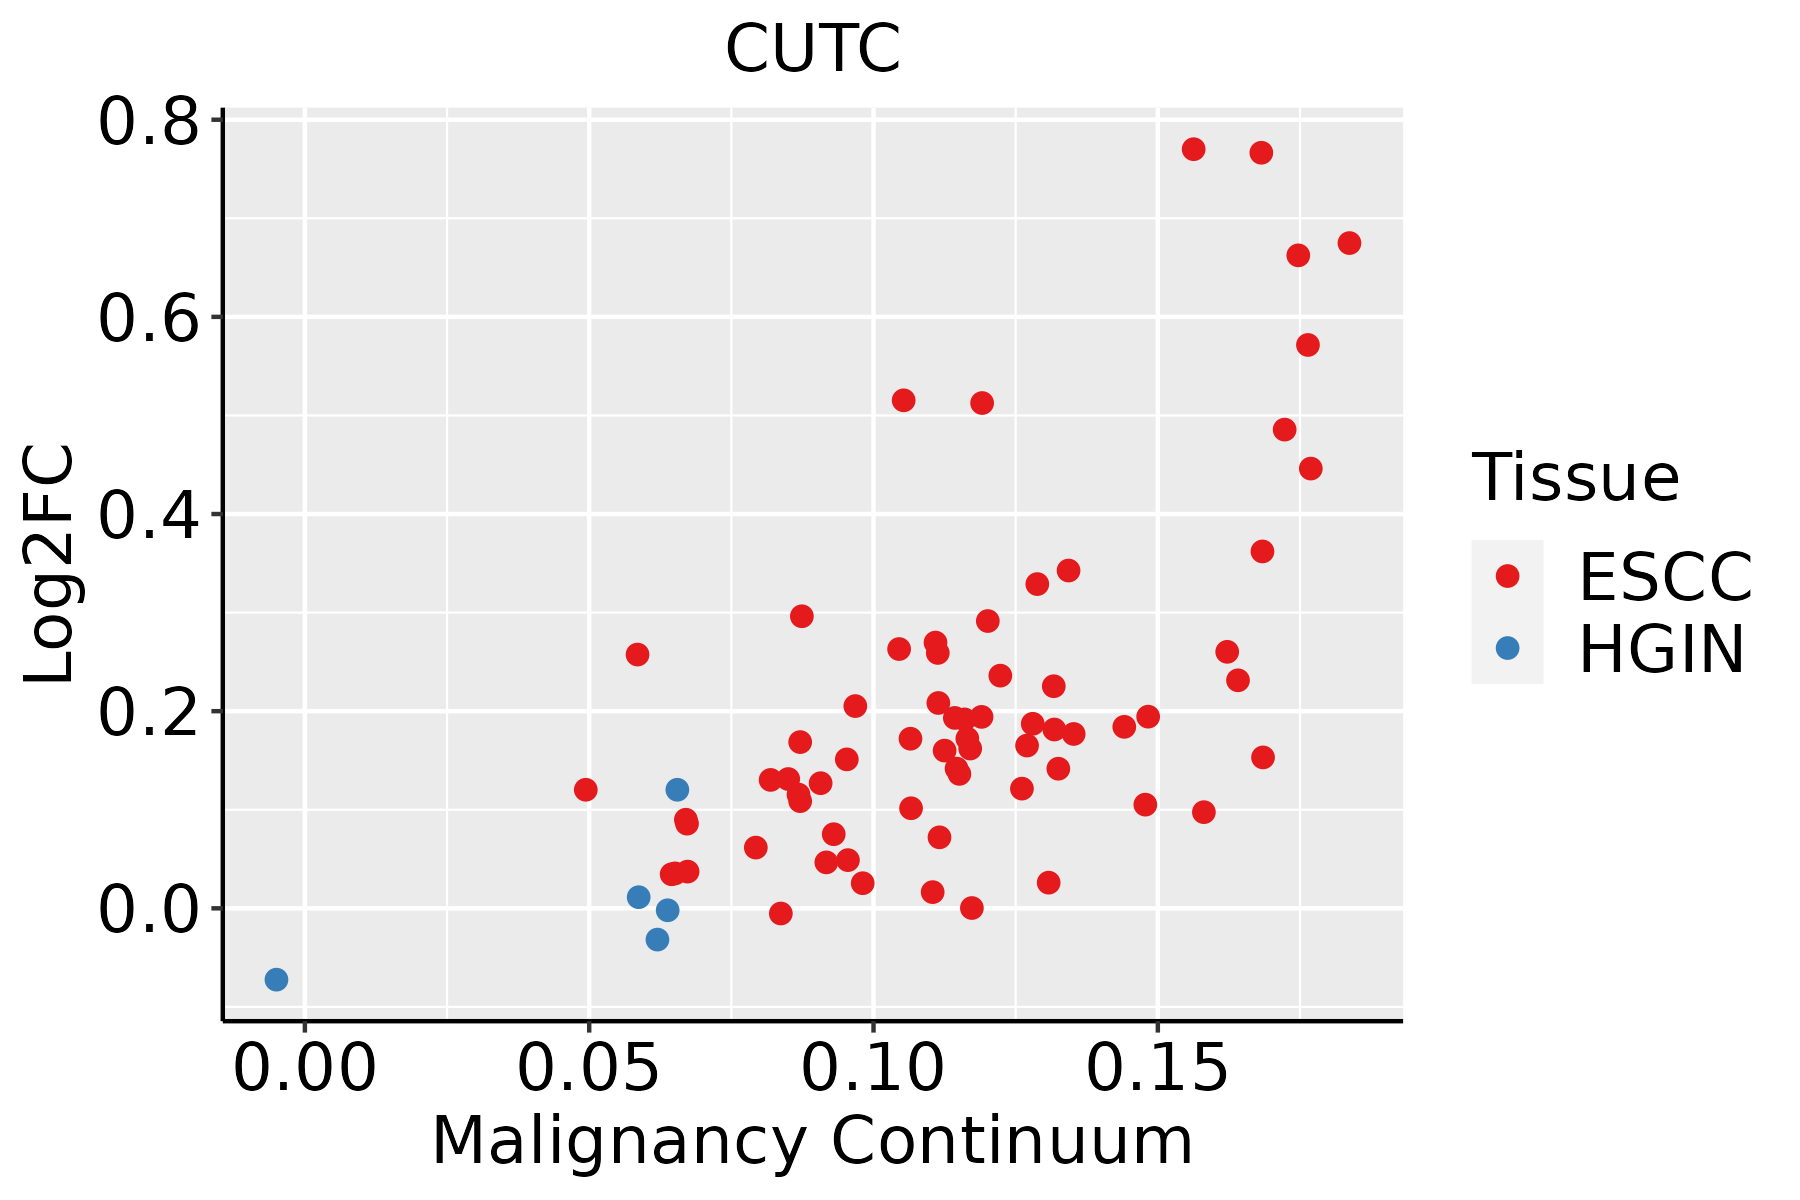 | ESCC: Esophageal squamous cell carcinoma |
| HGIN: High-grade intraepithelial neoplasias | ||
| LGIN: Low-grade intraepithelial neoplasias | ||
| Liver | 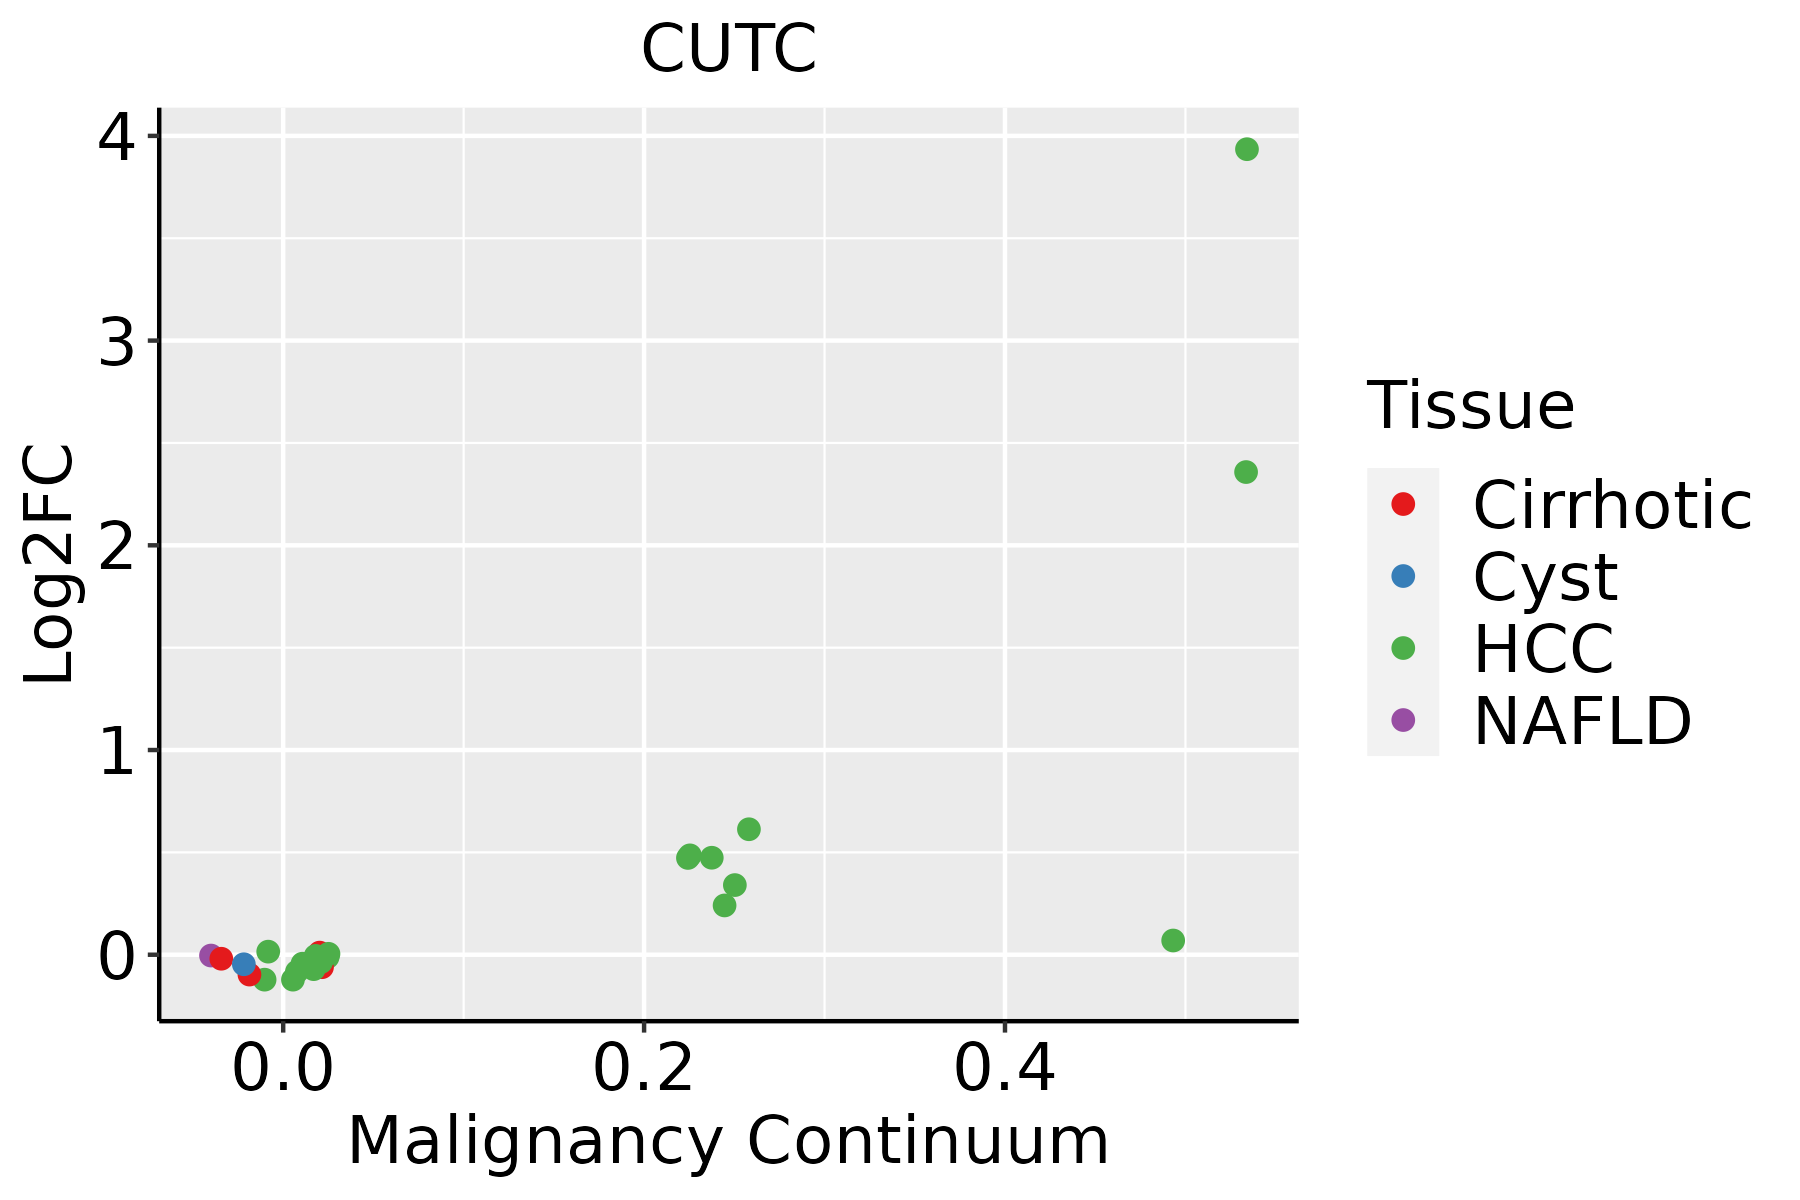 | HCC: Hepatocellular carcinoma |
| NAFLD: Non-alcoholic fatty liver disease | ||
| Oral Cavity | 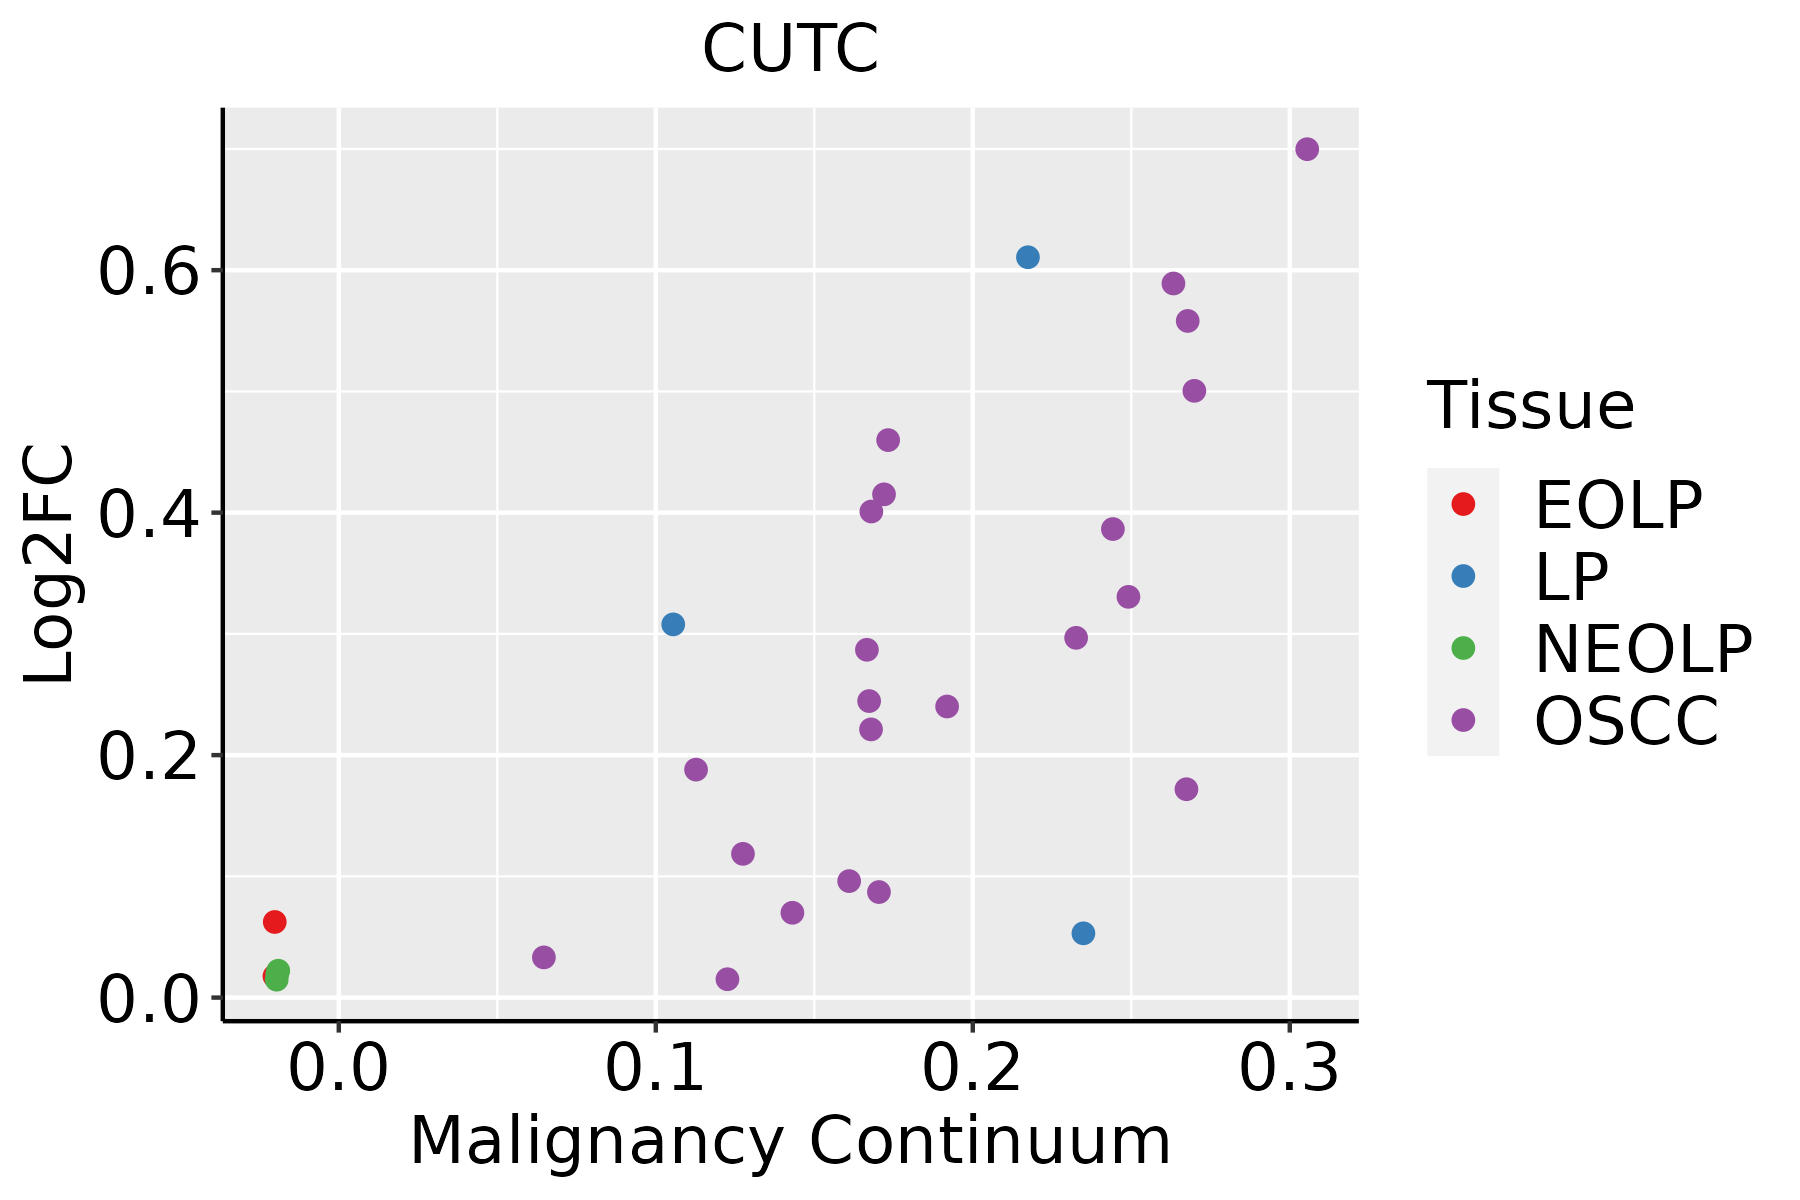 | EOLP: Erosive Oral lichen planus |
| LP: leukoplakia | ||
| NEOLP: Non-erosive oral lichen planus | ||
| OSCC: Oral squamous cell carcinoma |
| ∗log2FC in expression of this searched gene in stem-like cells from each diseased tissue sample relative to stem-like cells in normal samples in each tissue plotted against the malignancy continuum. Samples are colored based on if they are from different disease stage. |
Top |
Malignant transformation related pathway analysis |
| Find out the enriched GO biological processes and KEGG pathways involved in transition from healthy to precancer to cancer |
| Tissue | Disease Stage | Enriched GO biological Processes |
| Colorectum | AD |  |
| Colorectum | SER |  |
| Colorectum | MSS |  |
| Colorectum | MSI-H |  |
| Colorectum | FAP |  |
| ∗Top 15 enriched GO BP terms are showed in the bar plot of each disease state in each tissue. Each row represents a significant GO biological process which is colored according to the -log10(p.adjust). |
| Page: 1 2 3 4 5 6 7 8 9 |
| GO ID | Tissue | Disease Stage | Description | Gene Ratio | Bg Ratio | pvalue | p.adjust | Count |
| GO:005507617 | Esophagus | ESCC | transition metal ion homeostasis | 87/8552 | 138/18723 | 2.85e-05 | 2.37e-04 | 87 |
| GO:00550703 | Esophagus | ESCC | copper ion homeostasis | 15/8552 | 18/18723 | 1.20e-03 | 5.88e-03 | 15 |
| GO:00512623 | Esophagus | ESCC | protein tetramerization | 54/8552 | 87/18723 | 1.50e-03 | 7.06e-03 | 54 |
| GO:00512592 | Esophagus | ESCC | protein complex oligomerization | 130/8552 | 238/18723 | 3.29e-03 | 1.36e-02 | 130 |
| GO:005507612 | Liver | HCC | transition metal ion homeostasis | 81/7958 | 138/18723 | 8.87e-05 | 7.72e-04 | 81 |
| GO:0055070 | Liver | HCC | copper ion homeostasis | 14/7958 | 18/18723 | 2.57e-03 | 1.23e-02 | 14 |
| GO:00000411 | Liver | HCC | transition metal ion transport | 59/7958 | 105/18723 | 3.18e-03 | 1.47e-02 | 59 |
| GO:0051262 | Liver | HCC | protein tetramerization | 50/7958 | 87/18723 | 3.42e-03 | 1.55e-02 | 50 |
| GO:005507610 | Oral cavity | OSCC | transition metal ion homeostasis | 81/7305 | 138/18723 | 2.13e-06 | 2.72e-05 | 81 |
| GO:0051259 | Oral cavity | OSCC | protein complex oligomerization | 121/7305 | 238/18723 | 1.29e-04 | 9.21e-04 | 121 |
| GO:00550702 | Oral cavity | OSCC | copper ion homeostasis | 14/7305 | 18/18723 | 9.51e-04 | 4.96e-03 | 14 |
| GO:00512622 | Oral cavity | OSCC | protein tetramerization | 48/7305 | 87/18723 | 1.60e-03 | 7.62e-03 | 48 |
| GO:00512591 | Oral cavity | LP | protein complex oligomerization | 85/4623 | 238/18723 | 8.81e-05 | 1.11e-03 | 85 |
| GO:005507616 | Oral cavity | LP | transition metal ion homeostasis | 54/4623 | 138/18723 | 1.19e-04 | 1.40e-03 | 54 |
| GO:005126211 | Oral cavity | LP | protein tetramerization | 35/4623 | 87/18723 | 9.81e-04 | 8.28e-03 | 35 |
| GO:00550701 | Oral cavity | LP | copper ion homeostasis | 10/4623 | 18/18723 | 4.91e-03 | 3.06e-02 | 10 |
| Page: 1 |
| Pathway ID | Tissue | Disease Stage | Description | Gene Ratio | Bg Ratio | pvalue | p.adjust | qvalue | Count |
| Page: 1 |
Top |
Cell-cell communication analysis |
| Identification of potential cell-cell interactions between two cell types and their ligand-receptor pairs for different disease states |
| Ligand | Receptor | LRpair | Pathway | Tissue | Disease Stage |
| Page: 1 |
Top |
Single-cell gene regulatory network inference analysis |
| Find out the significant the regulons (TFs) and the target genes of each regulon across cell types for different disease states |
| TF | Cell Type | Tissue | Disease Stage | Target Gene | RSS | Regulon Activity |
| ∗The dot plots of a searched regulon are shown for all cell subpopulations in each disease state of each tissue based on the regulon specific score inferred using pySCENIC and by calculating the average expression. |
| Page: 1 |
Top |
Somatic mutation of malignant transformation related genes |
| Annotation of somatic variants for genes involved in malignant transformation |
| Hugo Symbol | Variant Class | Variant Classification | dbSNP RS | HGVSc | HGVSp | HGVSp Short | SWISSPROT | BIOTYPE | SIFT | PolyPhen | Tumor Sample Barcode | Tissue | Histology | Sex | Age | Stage | Therapy Types | Drugs | Outcome |
| CUTC | SNV | Missense_Mutation | novel | c.713C>T | p.Ser238Leu | p.S238L | Q9NTM9 | protein_coding | tolerated(0.19) | benign(0.007) | TCGA-2W-A8YY-01 | Cervix | cervical & endocervical cancer | Female | <65 | I/II | Chemotherapy | cisplatin | CR |
| CUTC | SNV | Missense_Mutation | c.188N>A | p.Ser63Asn | p.S63N | Q9NTM9 | protein_coding | deleterious(0) | possibly_damaging(0.673) | TCGA-AA-3833-01 | Colorectum | colon adenocarcinoma | Female | <65 | I/II | Unknown | Unknown | SD | |
| CUTC | SNV | Missense_Mutation | novel | c.266N>A | p.Phe89Tyr | p.F89Y | Q9NTM9 | protein_coding | deleterious(0) | probably_damaging(1) | TCGA-AA-3984-01 | Colorectum | colon adenocarcinoma | Female | <65 | I/II | Unknown | Unknown | SD |
| CUTC | SNV | Missense_Mutation | c.467C>A | p.Ala156Glu | p.A156E | Q9NTM9 | protein_coding | tolerated(1) | benign(0.007) | TCGA-CK-5916-01 | Colorectum | colon adenocarcinoma | Female | >=65 | I/II | Unknown | Unknown | PD | |
| CUTC | deletion | Frame_Shift_Del | c.233delN | p.Phe79LeufsTer2 | p.F79Lfs*2 | Q9NTM9 | protein_coding | TCGA-G4-6628-01 | Colorectum | colon adenocarcinoma | Male | >=65 | I/II | Unknown | Unknown | SD | |||
| CUTC | SNV | Missense_Mutation | rs758173583 | c.802G>A | p.Ala268Thr | p.A268T | Q9NTM9 | protein_coding | tolerated(0.07) | possibly_damaging(0.869) | TCGA-AP-A1DM-01 | Endometrium | uterine corpus endometrioid carcinoma | Female | <65 | I/II | Unknown | Unknown | SD |
| CUTC | SNV | Missense_Mutation | novel | c.547C>T | p.Pro183Ser | p.P183S | Q9NTM9 | protein_coding | tolerated(0.11) | benign(0.023) | TCGA-AP-A1DV-01 | Endometrium | uterine corpus endometrioid carcinoma | Female | <65 | I/II | Unknown | Unknown | SD |
| CUTC | SNV | Missense_Mutation | rs749464623 | c.310N>T | p.Arg104Cys | p.R104C | Q9NTM9 | protein_coding | tolerated(0.05) | benign(0.025) | TCGA-AX-A05Z-01 | Endometrium | uterine corpus endometrioid carcinoma | Female | <65 | III/IV | Chemotherapy | adriamycin | SD |
| CUTC | SNV | Missense_Mutation | c.407N>G | p.Ile136Ser | p.I136S | Q9NTM9 | protein_coding | tolerated(0.4) | benign(0.01) | TCGA-AX-A05Z-01 | Endometrium | uterine corpus endometrioid carcinoma | Female | <65 | III/IV | Chemotherapy | adriamycin | SD | |
| CUTC | SNV | Missense_Mutation | rs745863158 | c.301G>A | p.Ala101Thr | p.A101T | Q9NTM9 | protein_coding | tolerated(0.55) | benign(0.001) | TCGA-AX-A06F-01 | Endometrium | uterine corpus endometrioid carcinoma | Female | <65 | III/IV | Chemotherapy | carboplatin | SD |
| Page: 1 2 3 4 |
Top |
Related drugs of malignant transformation related genes |
| Identification of chemicals and drugs interact with genes involved in malignant transfromation |
| (DGIdb 4.0) |
| Entrez ID | Symbol | Category | Interaction Types | Drug Claim Name | Drug Name | PMIDs |
| Page: 1 |

Copyright 2023-Present -The University of Texas Health Science Center at Houston |