
|
|||||
|
 | |
| |
| |
| |
| |
| |
|
Gene: CUL9 |
Gene summary for CUL9 |
| Gene information | Species | Human | Gene symbol | CUL9 | Gene ID | 23113 |
| Gene name | cullin 9 | |
| Gene Alias | H7AP1 | |
| Cytomap | 6p21.1 | |
| Gene Type | protein-coding | GO ID | GO:0000226 | UniProtAcc | Q8IWT3 |
Top |
Malignant transformation analysis |
| Identification of the aberrant gene expression in precancerous and cancerous lesions by comparing the gene expression of stem-like cells in diseased tissues with normal stem cells |
| Entrez ID | Symbol | Replicates | Species | Organ | Tissue | Adj P-value | Log2FC | Malignancy |
| 23113 | CUL9 | male-WTA | Human | Thyroid | PTC | 4.25e-03 | 7.50e-02 | 0.1037 |
| 23113 | CUL9 | PTC04 | Human | Thyroid | PTC | 6.69e-05 | 9.05e-02 | 0.1927 |
| 23113 | CUL9 | PTC05 | Human | Thyroid | PTC | 5.59e-04 | 2.11e-01 | 0.2065 |
| 23113 | CUL9 | PTC06 | Human | Thyroid | PTC | 7.40e-06 | 1.99e-01 | 0.2057 |
| 23113 | CUL9 | PTC07 | Human | Thyroid | PTC | 3.79e-10 | 1.17e-01 | 0.2044 |
| 23113 | CUL9 | ATC13 | Human | Thyroid | ATC | 3.00e-34 | 5.34e-01 | 0.34 |
| 23113 | CUL9 | ATC2 | Human | Thyroid | ATC | 6.46e-06 | 4.80e-01 | 0.34 |
| 23113 | CUL9 | ATC5 | Human | Thyroid | ATC | 2.52e-37 | 5.72e-01 | 0.34 |
| Page: 1 |
| Tissue | Expression Dynamics | Abbreviation |
| Thyroid | 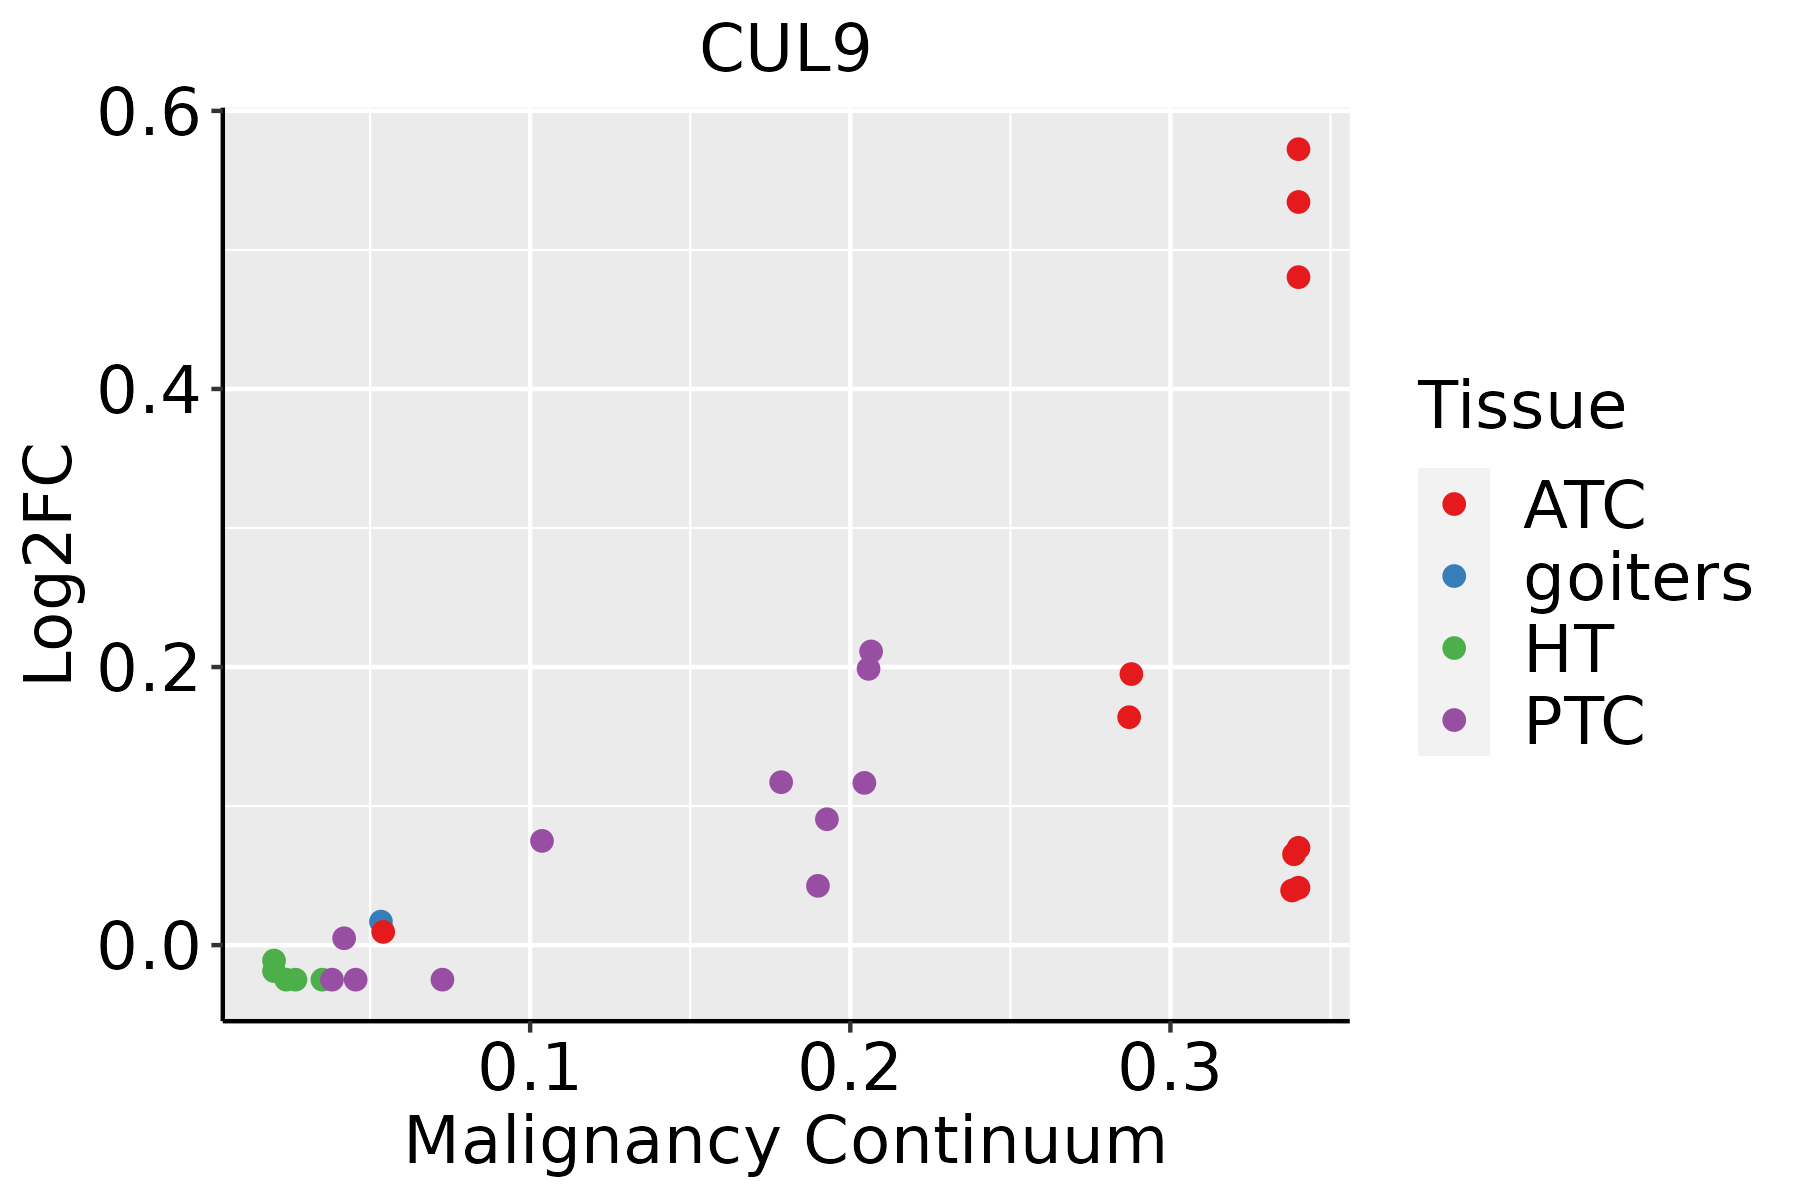 | ATC: Anaplastic thyroid cancer |
| HT: Hashimoto's thyroiditis | ||
| PTC: Papillary thyroid cancer |
| ∗log2FC in expression of this searched gene in stem-like cells from each diseased tissue sample relative to stem-like cells in normal samples in each tissue plotted against the malignancy continuum. Samples are colored based on if they are from different disease stage. |
Top |
Malignant transformation related pathway analysis |
| Find out the enriched GO biological processes and KEGG pathways involved in transition from healthy to precancer to cancer |
| Tissue | Disease Stage | Enriched GO biological Processes |
| Colorectum | AD |  |
| Colorectum | SER |  |
| Colorectum | MSS |  |
| Colorectum | MSI-H |  |
| Colorectum | FAP |  |
| ∗Top 15 enriched GO BP terms are showed in the bar plot of each disease state in each tissue. Each row represents a significant GO biological process which is colored according to the -log10(p.adjust). |
| Page: 1 2 3 4 5 6 7 8 9 |
| GO ID | Tissue | Disease Stage | Description | Gene Ratio | Bg Ratio | pvalue | p.adjust | Count |
| GO:000734619 | Thyroid | PTC | regulation of mitotic cell cycle | 212/5968 | 457/18723 | 4.03e-11 | 1.44e-09 | 212 |
| GO:01400148 | Thyroid | PTC | mitotic nuclear division | 135/5968 | 287/18723 | 4.90e-08 | 1.04e-06 | 135 |
| GO:00482855 | Thyroid | PTC | organelle fission | 188/5968 | 488/18723 | 9.64e-04 | 5.77e-03 | 188 |
| GO:00070885 | Thyroid | PTC | regulation of mitotic nuclear division | 51/5968 | 110/18723 | 1.02e-03 | 6.07e-03 | 51 |
| GO:00002804 | Thyroid | PTC | nuclear division | 167/5968 | 439/18723 | 3.27e-03 | 1.60e-02 | 167 |
| GO:00517833 | Thyroid | PTC | regulation of nuclear division | 59/5968 | 139/18723 | 5.50e-03 | 2.50e-02 | 59 |
| GO:014001416 | Thyroid | ATC | mitotic nuclear division | 171/6293 | 287/18723 | 1.13e-19 | 1.66e-17 | 171 |
| GO:000734622 | Thyroid | ATC | regulation of mitotic cell cycle | 236/6293 | 457/18723 | 7.58e-16 | 5.92e-14 | 236 |
| GO:004828512 | Thyroid | ATC | organelle fission | 229/6293 | 488/18723 | 4.79e-10 | 1.29e-08 | 229 |
| GO:000028011 | Thyroid | ATC | nuclear division | 207/6293 | 439/18723 | 1.98e-09 | 4.80e-08 | 207 |
| GO:000708811 | Thyroid | ATC | regulation of mitotic nuclear division | 67/6293 | 110/18723 | 3.98e-09 | 9.08e-08 | 67 |
| GO:005178311 | Thyroid | ATC | regulation of nuclear division | 77/6293 | 139/18723 | 1.01e-07 | 1.70e-06 | 77 |
| Page: 1 |
| Pathway ID | Tissue | Disease Stage | Description | Gene Ratio | Bg Ratio | pvalue | p.adjust | qvalue | Count |
| Page: 1 |
Top |
Cell-cell communication analysis |
| Identification of potential cell-cell interactions between two cell types and their ligand-receptor pairs for different disease states |
| Ligand | Receptor | LRpair | Pathway | Tissue | Disease Stage |
| Page: 1 |
Top |
Single-cell gene regulatory network inference analysis |
| Find out the significant the regulons (TFs) and the target genes of each regulon across cell types for different disease states |
| TF | Cell Type | Tissue | Disease Stage | Target Gene | RSS | Regulon Activity |
| ∗The dot plots of a searched regulon are shown for all cell subpopulations in each disease state of each tissue based on the regulon specific score inferred using pySCENIC and by calculating the average expression. |
| Page: 1 |
Top |
Somatic mutation of malignant transformation related genes |
| Annotation of somatic variants for genes involved in malignant transformation |
| Hugo Symbol | Variant Class | Variant Classification | dbSNP RS | HGVSc | HGVSp | HGVSp Short | SWISSPROT | BIOTYPE | SIFT | PolyPhen | Tumor Sample Barcode | Tissue | Histology | Sex | Age | Stage | Therapy Types | Drugs | Outcome |
| CUL9 | SNV | Missense_Mutation | novel | c.3455T>C | p.Phe1152Ser | p.F1152S | Q8IWT3 | protein_coding | deleterious(0) | probably_damaging(0.998) | TCGA-A8-A092-01 | Breast | breast invasive carcinoma | Female | <65 | III/IV | Chemotherapy | paclitaxel | CR |
| CUL9 | SNV | Missense_Mutation | rs751758496 | c.2634N>T | p.Leu878Phe | p.L878F | Q8IWT3 | protein_coding | deleterious(0.01) | benign(0.386) | TCGA-A8-A09A-01 | Breast | breast invasive carcinoma | Female | <65 | I/II | Hormone Therapy | tamoxiphen | SD |
| CUL9 | SNV | Missense_Mutation | rs755969849 | c.1561C>A | p.Leu521Ile | p.L521I | Q8IWT3 | protein_coding | tolerated(0.51) | benign(0.003) | TCGA-AN-A046-01 | Breast | breast invasive carcinoma | Female | >=65 | I/II | Unknown | Unknown | SD |
| CUL9 | SNV | Missense_Mutation | c.1852N>A | p.Ala618Thr | p.A618T | Q8IWT3 | protein_coding | tolerated(0.52) | benign(0) | TCGA-AO-A128-01 | Breast | breast invasive carcinoma | Female | <65 | I/II | Chemotherapy | doxorubicin | SD | |
| CUL9 | SNV | Missense_Mutation | rs374310005 | c.2959N>T | p.Arg987Cys | p.R987C | Q8IWT3 | protein_coding | tolerated(0.09) | benign(0.009) | TCGA-AR-A1AQ-01 | Breast | breast invasive carcinoma | Female | <65 | I/II | Chemotherapy | doxorubicin | SD |
| CUL9 | SNV | Missense_Mutation | c.4154N>G | p.Ser1385Cys | p.S1385C | Q8IWT3 | protein_coding | tolerated(0.1) | benign(0.021) | TCGA-B6-A0RG-01 | Breast | breast invasive carcinoma | Female | <65 | I/II | Unknown | Unknown | SD | |
| CUL9 | SNV | Missense_Mutation | c.7184C>T | p.Ser2395Phe | p.S2395F | Q8IWT3 | protein_coding | deleterious(0.01) | possibly_damaging(0.548) | TCGA-BH-A0AV-01 | Breast | breast invasive carcinoma | Female | <65 | I/II | Chemotherapy | taxotere | CR | |
| CUL9 | SNV | Missense_Mutation | novel | c.1108N>C | p.Ser370Pro | p.S370P | Q8IWT3 | protein_coding | tolerated(0.44) | benign(0.034) | TCGA-BH-A0DG-01 | Breast | breast invasive carcinoma | Female | <65 | I/II | Chemotherapy | taxotere | CR |
| CUL9 | SNV | Missense_Mutation | c.647N>C | p.Gln216Pro | p.Q216P | Q8IWT3 | protein_coding | deleterious(0) | probably_damaging(0.994) | TCGA-E2-A15D-01 | Breast | breast invasive carcinoma | Female | <65 | I/II | Hormone Therapy | tamoxiphen | SD | |
| CUL9 | SNV | Missense_Mutation | c.6409N>C | p.Glu2137Gln | p.E2137Q | Q8IWT3 | protein_coding | deleterious(0.02) | benign(0.174) | TCGA-E2-A1AZ-01 | Breast | breast invasive carcinoma | Female | <65 | I/II | Chemotherapy | adriamycin | SD |
| Page: 1 2 3 4 5 6 7 8 9 10 11 12 13 14 15 16 17 18 19 20 21 22 23 24 25 |
Top |
Related drugs of malignant transformation related genes |
| Identification of chemicals and drugs interact with genes involved in malignant transfromation |
| (DGIdb 4.0) |
| Entrez ID | Symbol | Category | Interaction Types | Drug Claim Name | Drug Name | PMIDs |
| Page: 1 |

Copyright 2023-Present -The University of Texas Health Science Center at Houston |